| Param | Original file | Final file |
|---|---|---|
| Filename | modeM0/AS1A13_008T01_9000005898_43690cztM0_level2.fits | modeM0/AS1A13_008T01_9000005898_43690cztM0_level2_quad_clean.evt |
| Size (bytes) | 838,601,280 | 113,336,640 |
| Size | 799.8 MB | 108.1 MB |
| Events in quadrant A | 11,941,068 | 757,724 |
| Events in quadrant B | 3,983,086 | 834,517 |
| Events in quadrant C | 8,966,318 | 671,931 |
| Events in quadrant D | 5,653,102 | 714,604 |
| Mode M9 | |||
|---|---|---|---|
| Quadrant | BADHDUFLAG | Total packets | Discarded packets |
| A | 0 | 16 | 0 |
| B | 0 | 17 | 0 |
| C | 0 | 17 | 0 |
| D | 0 | 17 | 0 |
| Mode SS | |||
|---|---|---|---|
| Quadrant | BADHDUFLAG | Total packets | Discarded packets |
| A | 0 | 132 | 0 |
| B | 0 | 132 | 0 |
| C | 0 | 132 | 0 |
| D | 0 | 132 | 0 |
| Mode M0 | |||
|---|---|---|---|
| Quadrant | BADHDUFLAG | Total packets | Discarded packets |
| A | 0 | 39958 | 2 |
| B | 0 | 16073 | 2 |
| C | 0 | 31132 | 13 |
| D | 0 | 21139 | 2 |
| Quadrant | Total seconds | Saturated seconds | Saturation percentage |
|---|---|---|---|
| A | 6469 | 2622 | 40.531767% |
| B | 6469 | 215 | 3.323543% |
| C | 6442 | 2081 | 32.303632% |
| D | 6468 | 483 | 7.467532% |
Noise dominated data is calculated using 1-second bins in cleaned event files. If a bin has >2000 counts, and if more than 50% of those come from <1% of pixels, then it is considered to be noise-dominated and hence unusable.
| Quadrant | # 1 sec bins | Bins with >0 counts | Bins with >2000 counts | High rate bins dominated by noise | Noise dominated (total time) | Noise dominated (detector-on time) | Marked lightcurve |
|---|---|---|---|---|---|---|---|
| A | 7629 | 6470 | 2116 | 2116 | 27.74% | 32.70% | 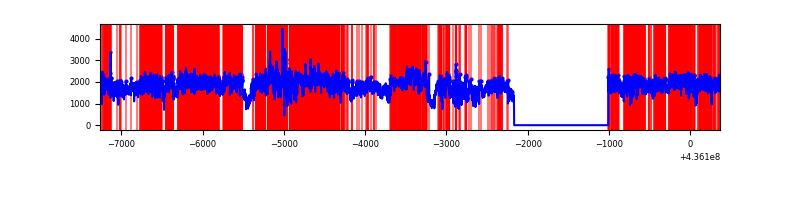 |
| B | 7629 | 6470 | 78 | 78 | 1.02% | 1.21% | 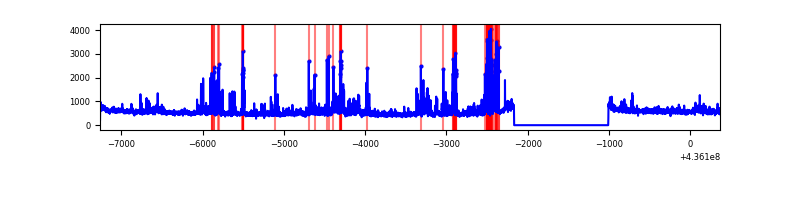 |
| C | 7628 | 6444 | 1580 | 1580 | 20.71% | 24.52% | 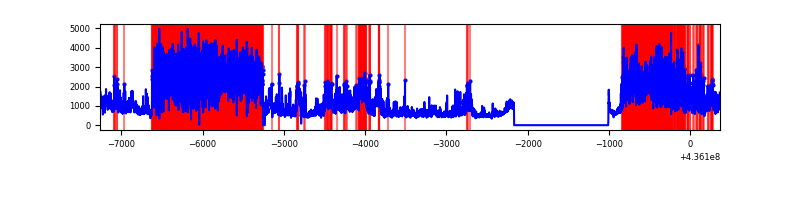 |
| D | 7628 | 6469 | 298 | 298 | 3.91% | 4.61% | 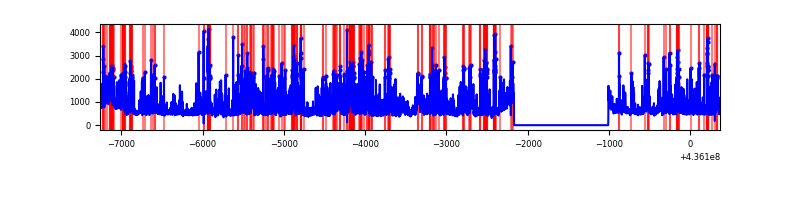 |
Top three noisy pixels from each quadrant. If the there are fewer than three noisy pixels in the level2.evt file, extra rows are filled as -1
| Pixel properties | Quadrant properties | ||||||
|---|---|---|---|---|---|---|---|
| Quadrant | DetID | PixID | Counts | Sigma | Mean | Median | Sigma |
| A | 15 | 222 | 5128938 | 33192.68 | 755 | 742 | 154.5 |
| A | 14 | 63 | 2536013 | 16409.75 | 755 | 742 | 154.5 |
| A | 10 | 83 | 863034 | 5581.26 | 755 | 742 | 154.5 |
| B | 5 | 235 | 350872 | 2217.96 | 808 | 786 | 157.8 |
| B | 10 | 128 | 125233 | 788.43 | 808 | 786 | 157.8 |
| B | 4 | 206 | 85715 | 538.06 | 808 | 786 | 157.8 |
| C | 15 | 157 | 2340036 | 14971.07 | 670 | 676 | 156.3 |
| C | 15 | 142 | 2025356 | 12957.23 | 670 | 676 | 156.3 |
| C | 3 | 233 | 1796359 | 11491.73 | 670 | 676 | 156.3 |
| D | 7 | 80 | 452713 | 2274.46 | 781 | 757 | 198.7 |
| D | 14 | 210 | 345277 | 1733.79 | 781 | 757 | 198.7 |
| D | 5 | 235 | 262025 | 1314.83 | 781 | 757 | 198.7 |
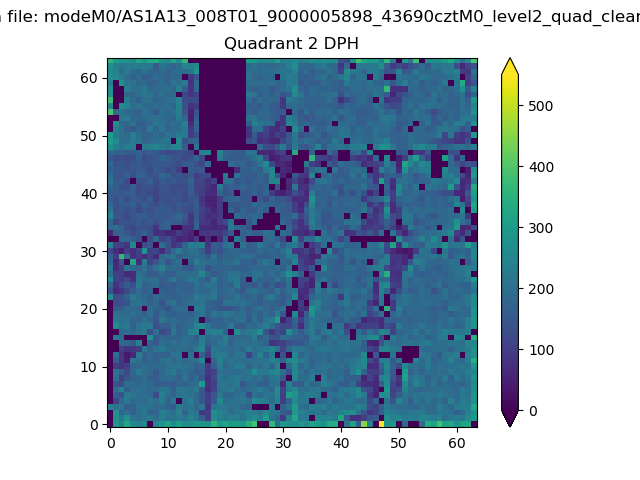
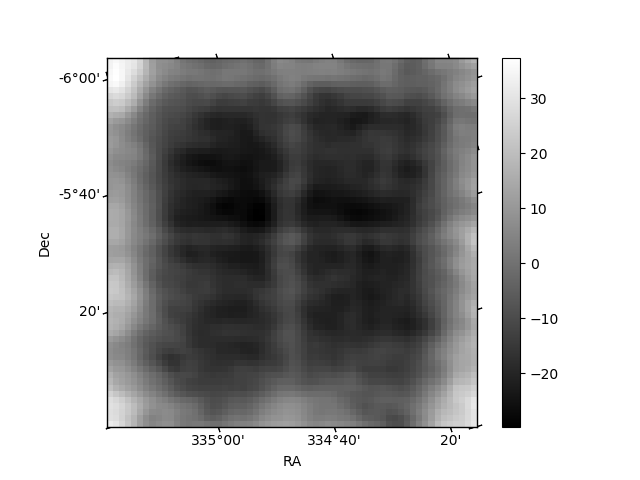
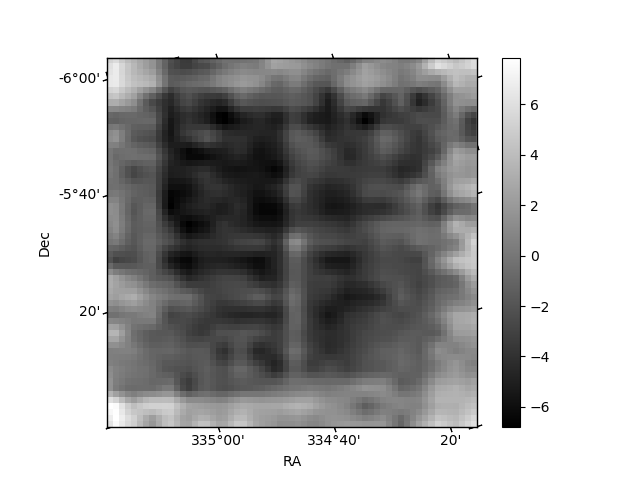
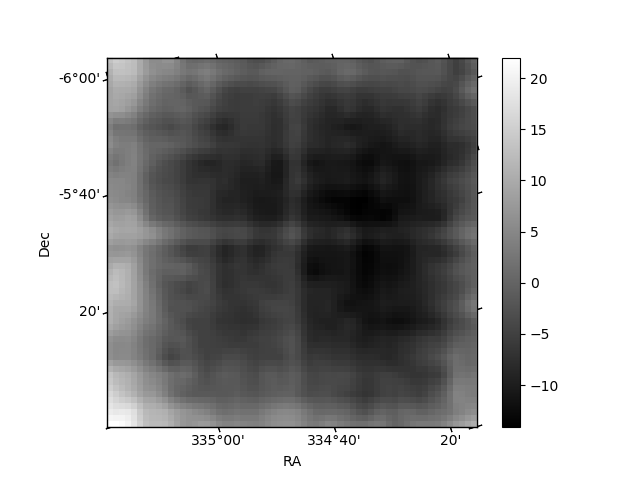
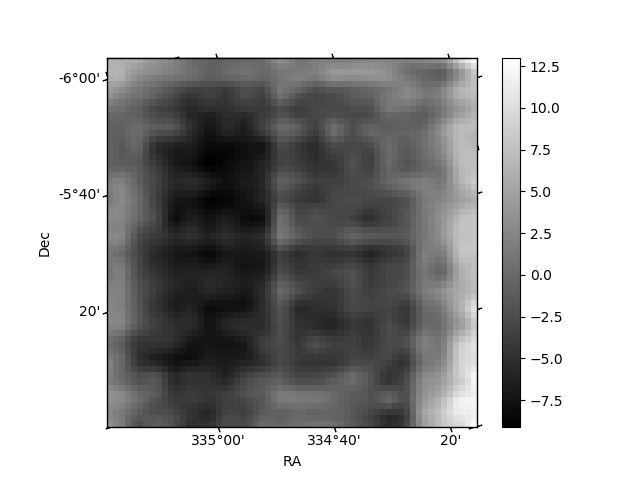
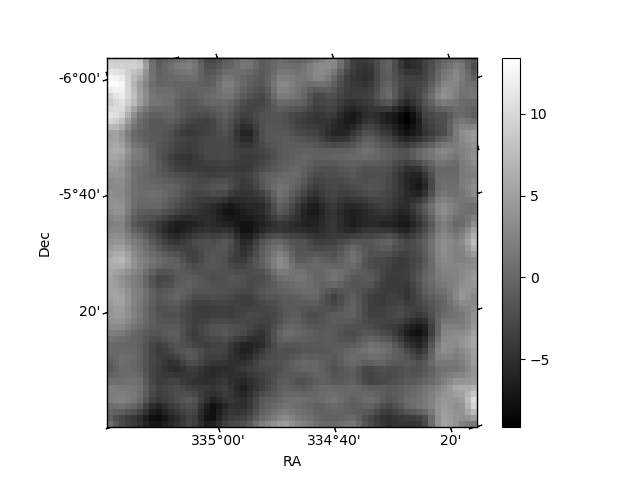
Histogram calculated using DETX and DETY for each event in the final _common_clean file
| Quadrant A | 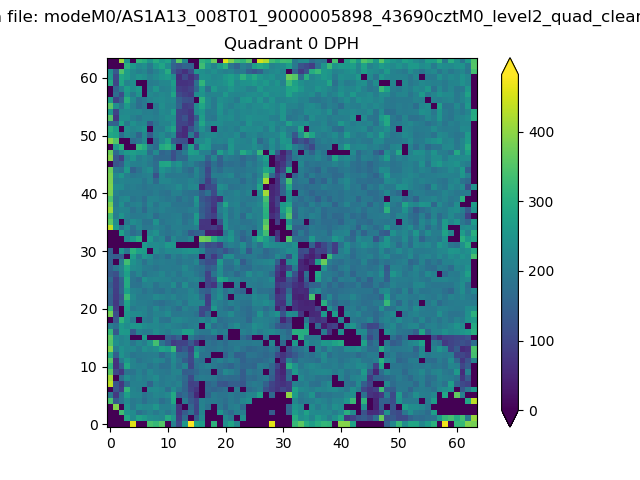 |
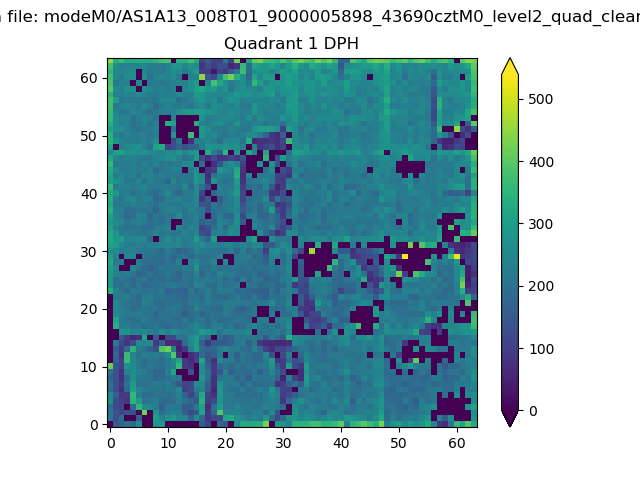 |
Quadrant B |
|---|---|---|---|
| Quadrant D | 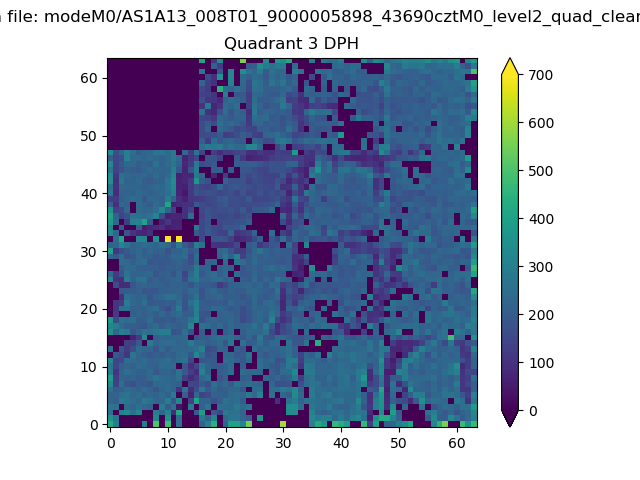 |
 |
Quadrant C |
| Plot type | Count rate plots | Images |
|---|---|---|
| Comparison with Poisson distribution Blue bars denote a histogram of data divided into 1 sec bins. Red curve is a Poisson curve with rate = median count rate of data. |
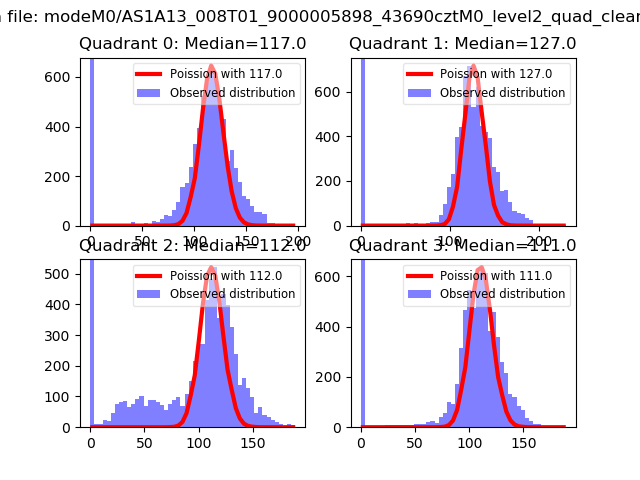 |
 |
| Quadrant-wise count rates Data is divided into 100 sec bins |
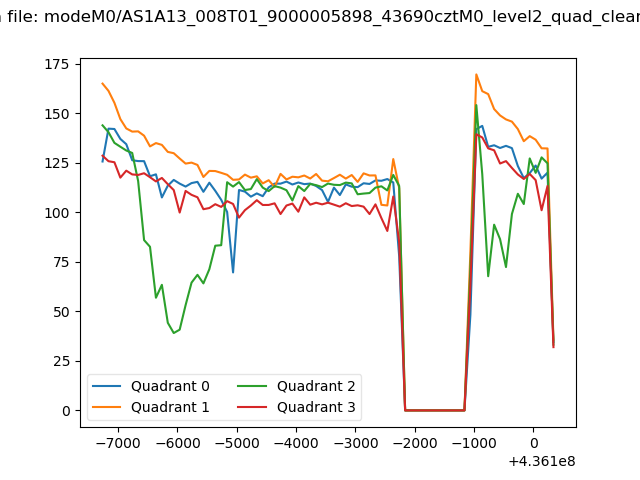 |
|
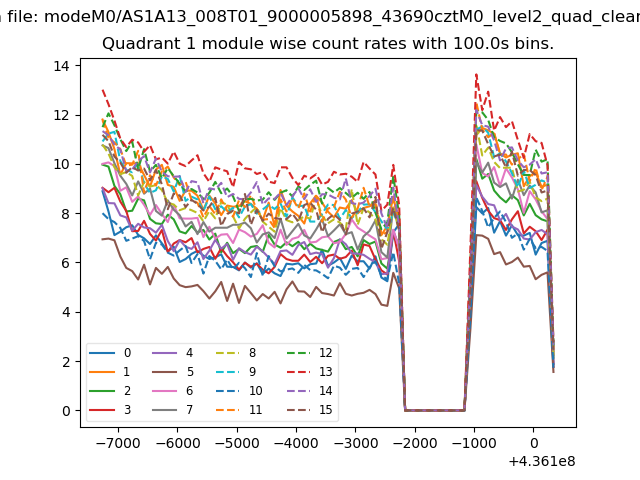
| Module-wise count rates for Quadrant A Data is divided into 100 sec bins |
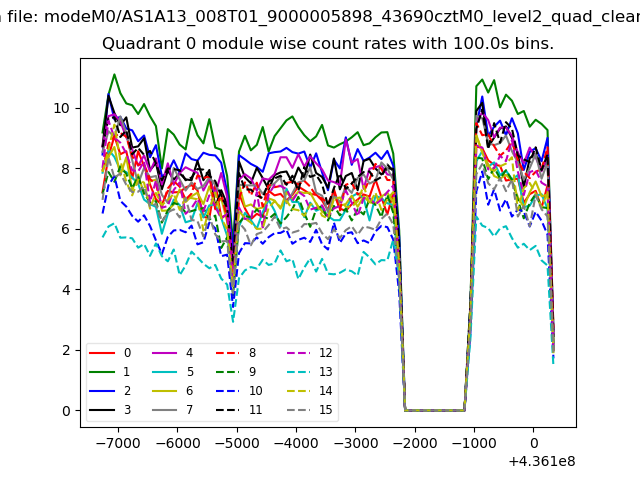 |
 |
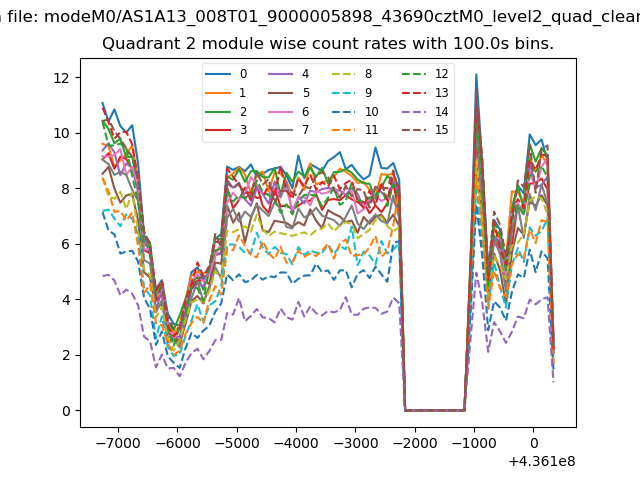
| Module-wise count rates for Quadrant B Data is divided into 100 sec bins |
 |
 |
| Module-wise count rates for Quadrant C Data is divided into 100 sec bins |
 |
 |
| Module-wise count rates for Quadrant D Data is divided into 100 sec bins |
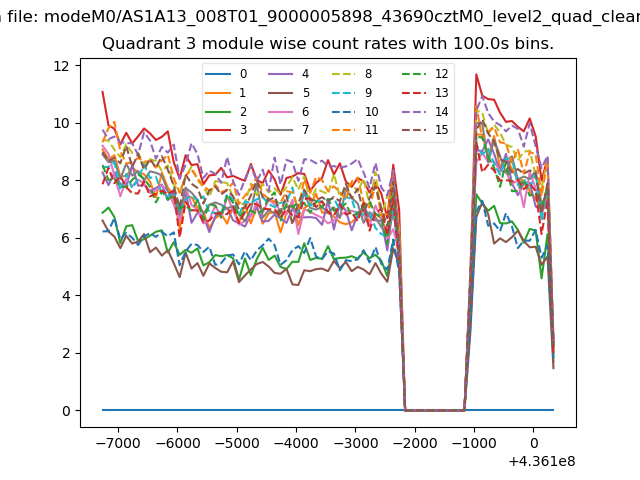 |
 |
| Parameter | Plot |
|---|---|
| CZT HV Monitor | 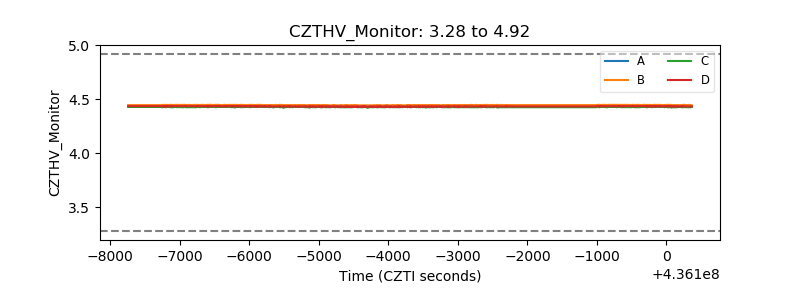 |
| D_VDD | 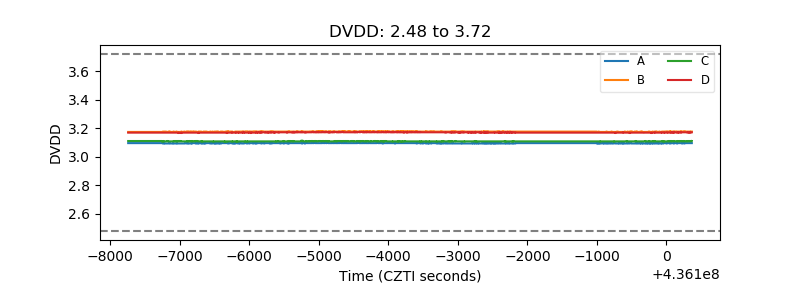 |
| Temperature 1 | 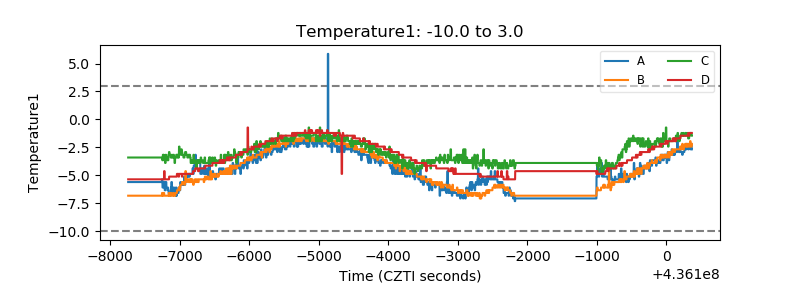 |
| Veto HV Monitor |  |
| Veto LLD | 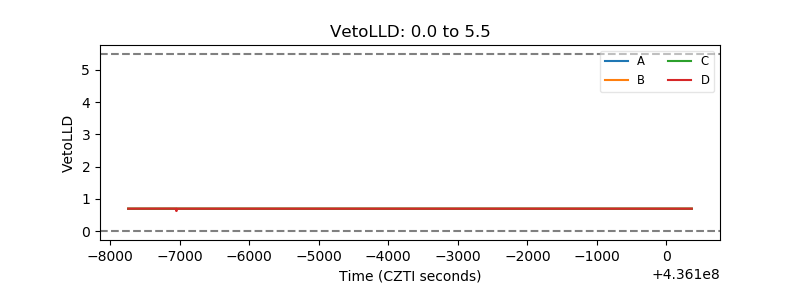 |
| Alpha Counter | 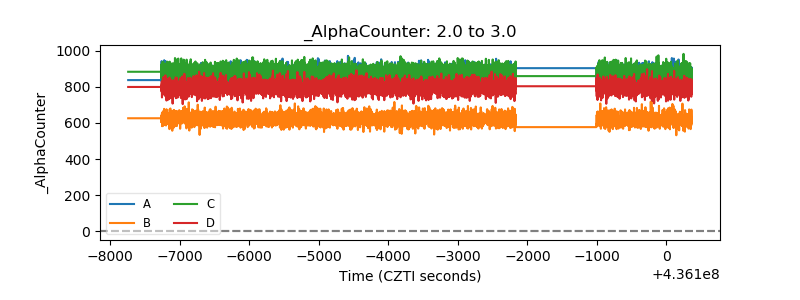 |
| _CPM_Rate | 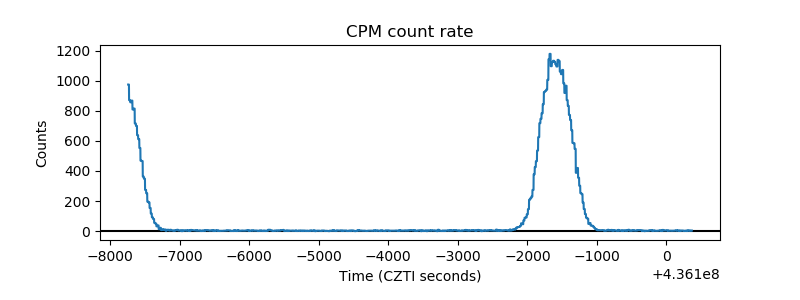 |
| CZT Counter | 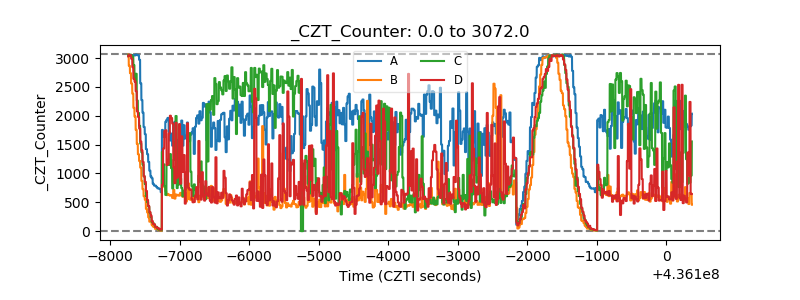 |
| +2.5 Volts monitor | 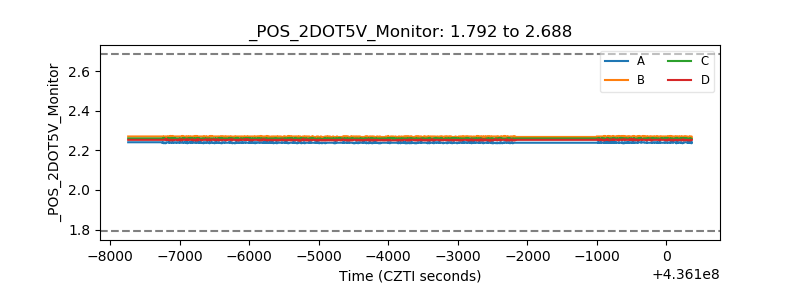 |
| +5 Volts monitor | 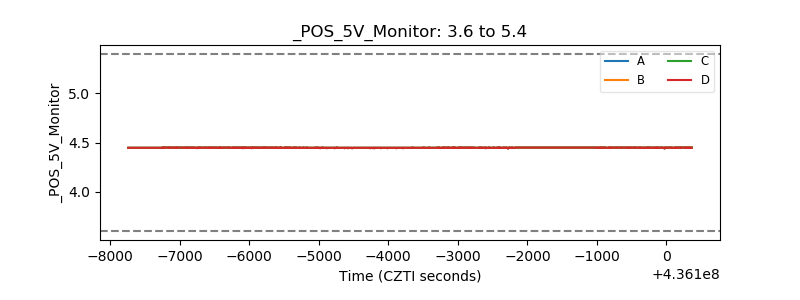 |
| _ROLL_ROT | 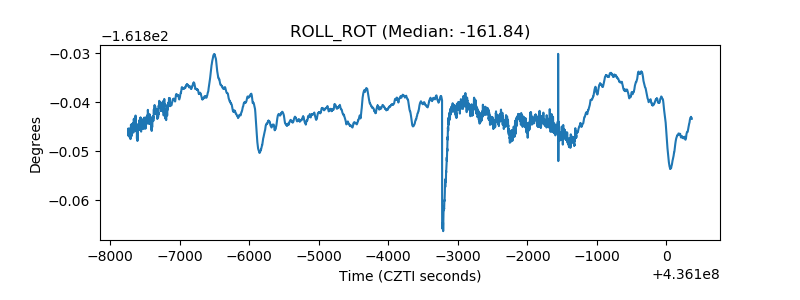 |
| _Roll_DEC | 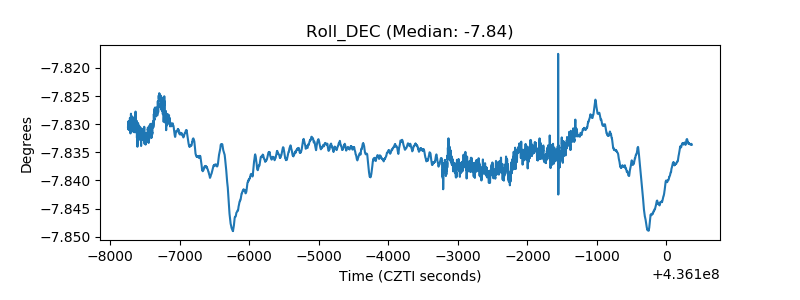 |
| _Roll_RA | 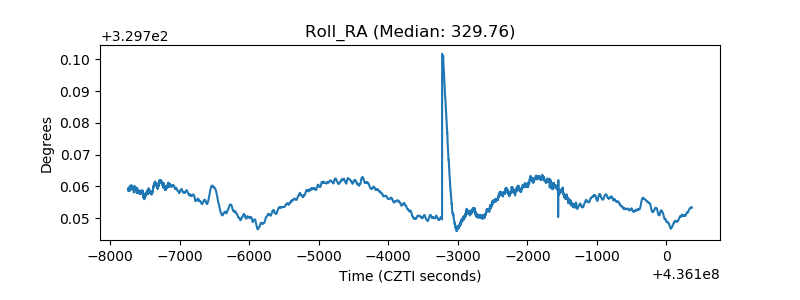 |
| Veto Counter | 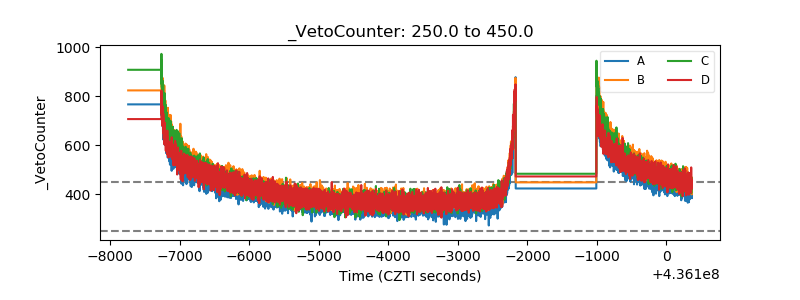 |