| Param | Original file | Final file |
|---|---|---|
| Filename | modeM0/AS1A13_008T01_9000005898_43691cztM0_level2.fits | modeM0/AS1A13_008T01_9000005898_43691cztM0_level2_quad_clean.evt |
| Size (bytes) | 766,667,520 | 115,407,360 |
| Size | 731.2 MB | 110.1 MB |
| Events in quadrant A | 11,897,552 | 723,903 |
| Events in quadrant B | 3,632,610 | 851,046 |
| Events in quadrant C | 6,820,868 | 748,056 |
| Events in quadrant D | 5,528,623 | 718,751 |
| Mode M9 | |||
|---|---|---|---|
| Quadrant | BADHDUFLAG | Total packets | Discarded packets |
| A | 0 | 14 | 0 |
| B | 0 | 15 | 0 |
| C | 0 | 15 | 0 |
| D | 0 | 15 | 0 |
| Mode SS | |||
|---|---|---|---|
| Quadrant | BADHDUFLAG | Total packets | Discarded packets |
| A | 0 | 132 | 0 |
| B | 0 | 132 | 0 |
| C | 0 | 132 | 0 |
| D | 0 | 132 | 0 |
| Mode M0 | |||
|---|---|---|---|
| Quadrant | BADHDUFLAG | Total packets | Discarded packets |
| A | 0 | 39801 | 7 |
| B | 0 | 14979 | 2 |
| C | 0 | 24640 | 2 |
| D | 0 | 20846 | 2 |
| Quadrant | Total seconds | Saturated seconds | Saturation percentage |
|---|---|---|---|
| A | 6465 | 2847 | 44.037123% |
| B | 6465 | 166 | 2.567672% |
| C | 6465 | 1213 | 18.762568% |
| D | 6465 | 544 | 8.414540% |
Noise dominated data is calculated using 1-second bins in cleaned event files. If a bin has >2000 counts, and if more than 50% of those come from <1% of pixels, then it is considered to be noise-dominated and hence unusable.
| Quadrant | # 1 sec bins | Bins with >0 counts | Bins with >2000 counts | High rate bins dominated by noise | Noise dominated (total time) | Noise dominated (detector-on time) | Marked lightcurve |
|---|---|---|---|---|---|---|---|
| A | 7615 | 6466 | 2224 | 2224 | 29.21% | 34.40% | 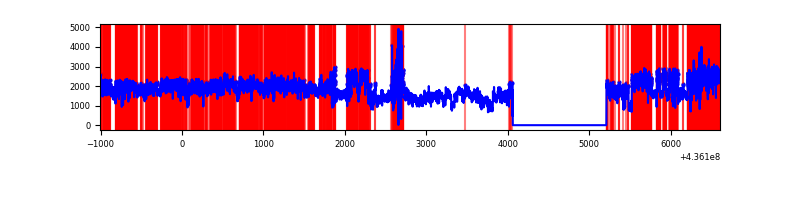 |
| B | 7615 | 6466 | 15 | 15 | 0.20% | 0.23% | 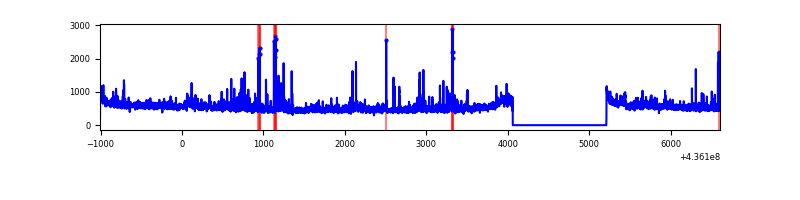 |
| C | 7615 | 6466 | 900 | 900 | 11.82% | 13.92% | 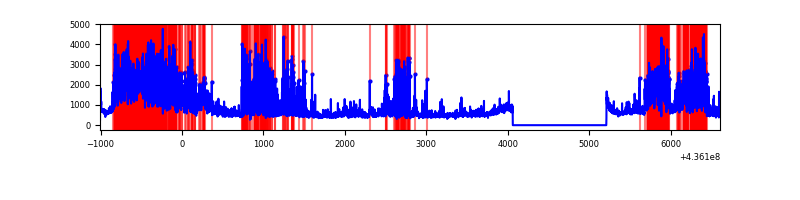 |
| D | 7615 | 6466 | 292 | 292 | 3.83% | 4.52% | 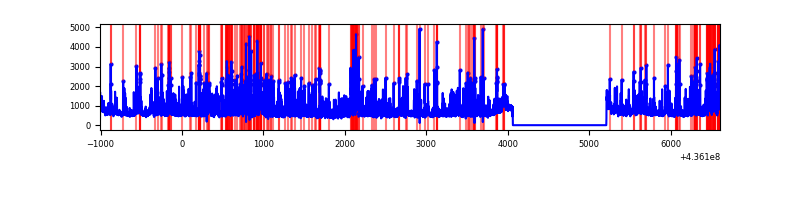 |
Top three noisy pixels from each quadrant. If the there are fewer than three noisy pixels in the level2.evt file, extra rows are filled as -1
| Pixel properties | Quadrant properties | ||||||
|---|---|---|---|---|---|---|---|
| Quadrant | DetID | PixID | Counts | Sigma | Mean | Median | Sigma |
| A | 15 | 222 | 4341150 | 29613.36 | 720 | 708 | 146.6 |
| A | 14 | 63 | 3577571 | 24403.72 | 720 | 708 | 146.6 |
| A | 10 | 83 | 824632 | 5621.35 | 720 | 708 | 146.6 |
| B | 4 | 206 | 166756 | 1039.29 | 819 | 794 | 159.7 |
| B | 5 | 235 | 126324 | 786.09 | 819 | 794 | 159.7 |
| B | 4 | 171 | 48472 | 298.57 | 819 | 794 | 159.7 |
| C | 15 | 157 | 2582552 | 14981.48 | 737 | 744 | 172.3 |
| C | 3 | 233 | 675402 | 3914.84 | 737 | 744 | 172.3 |
| C | 15 | 158 | 528486 | 3062.33 | 737 | 744 | 172.3 |
| D | 5 | 235 | 495438 | 2427.35 | 790 | 765 | 203.8 |
| D | 14 | 210 | 449634 | 2202.59 | 790 | 765 | 203.8 |
| D | 7 | 80 | 371357 | 1818.48 | 790 | 765 | 203.8 |
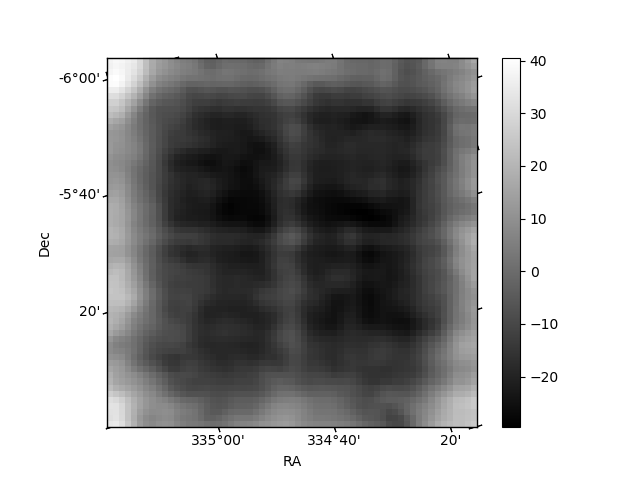
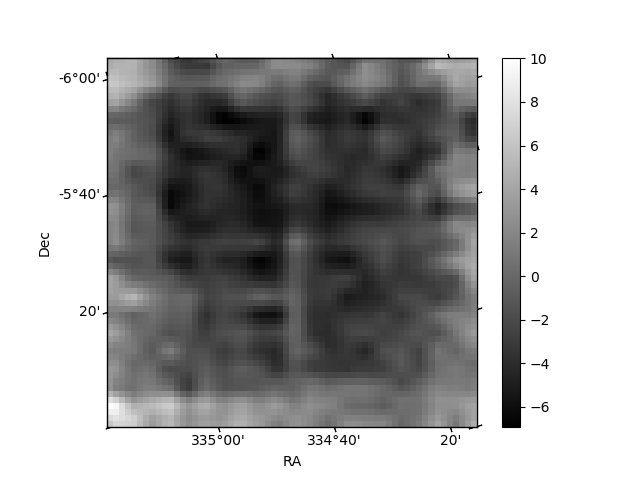
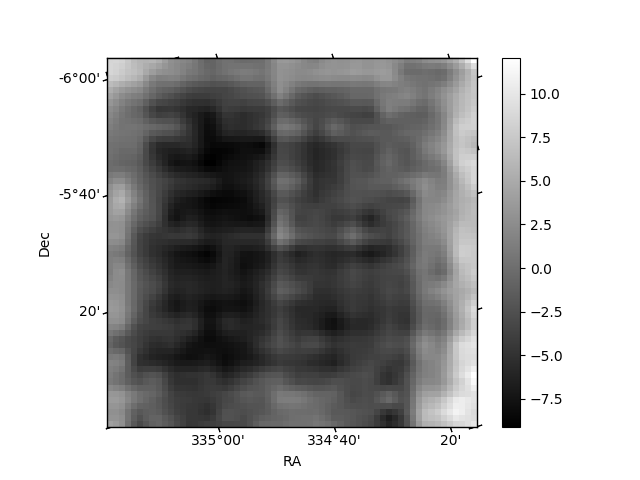
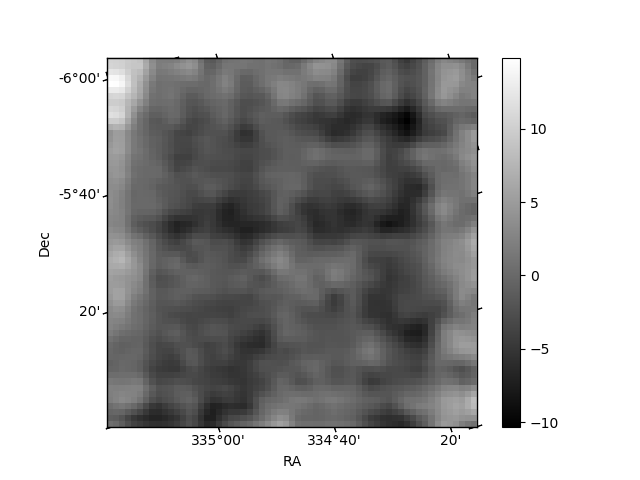
Histogram calculated using DETX and DETY for each event in the final _common_clean file
| Quadrant A | 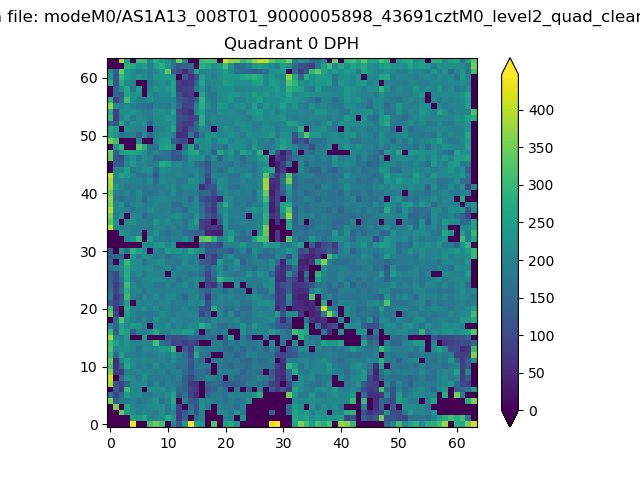 |
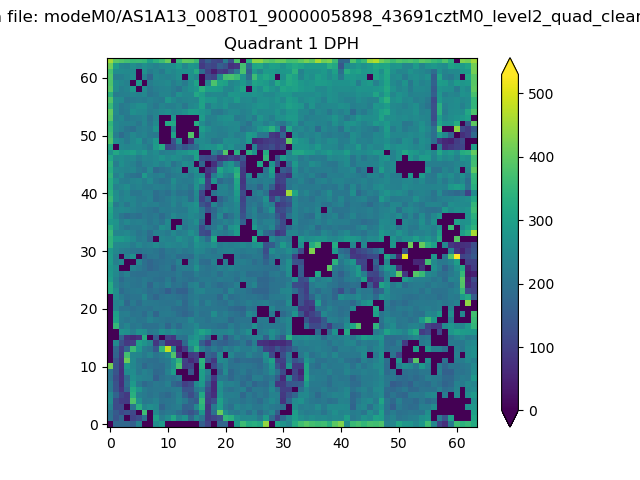 |
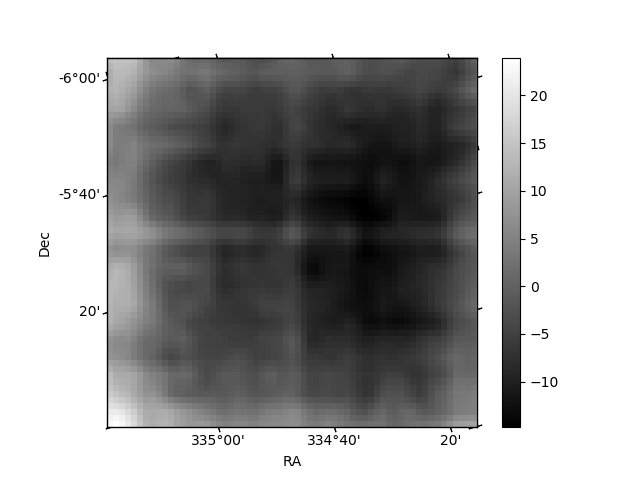
Quadrant B |
|---|---|---|---|
| Quadrant D | 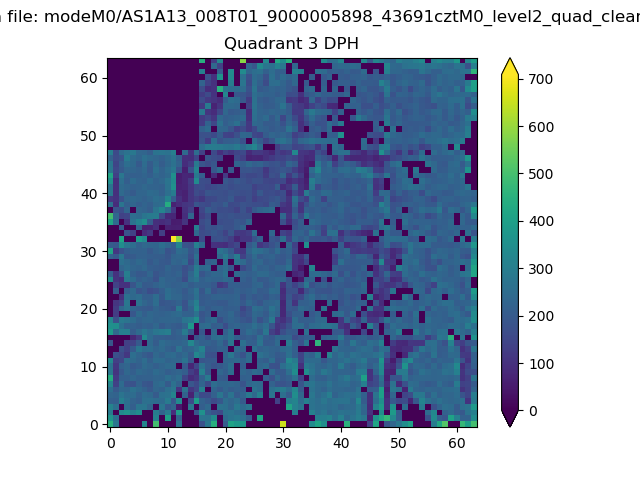 |
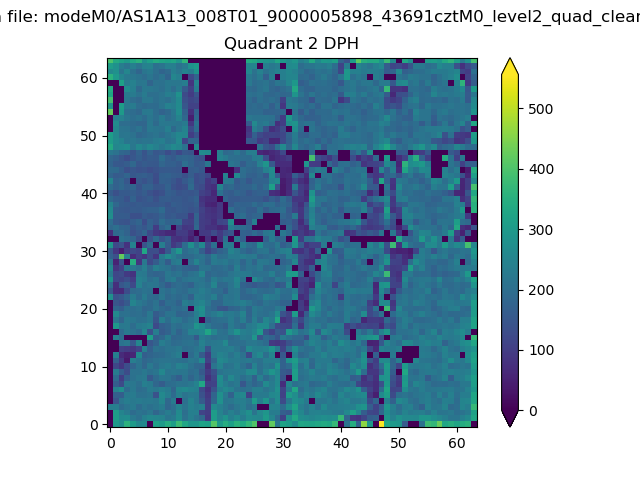 |
Quadrant C |
| Plot type | Count rate plots | Images |
|---|---|---|
| Comparison with Poisson distribution Blue bars denote a histogram of data divided into 1 sec bins. Red curve is a Poisson curve with rate = median count rate of data. |
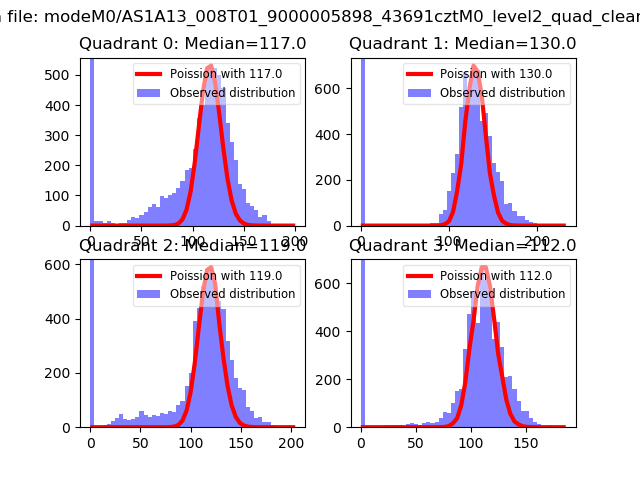 |
 |
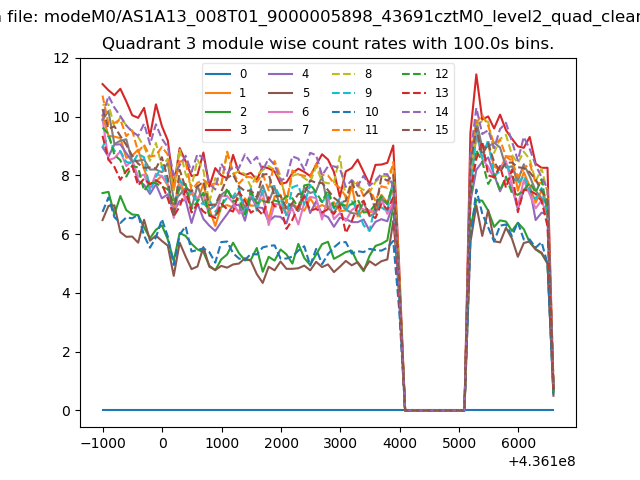
| Quadrant-wise count rates Data is divided into 100 sec bins |
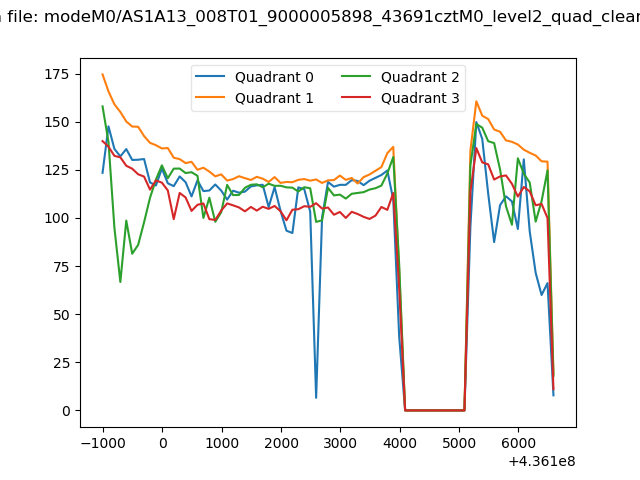 |
|
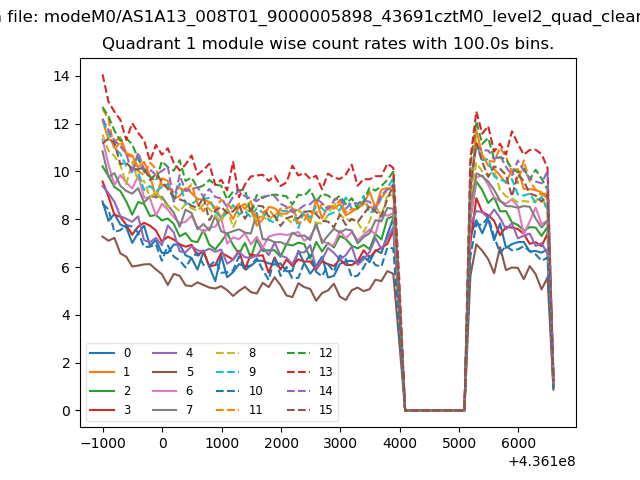
| Module-wise count rates for Quadrant A Data is divided into 100 sec bins |
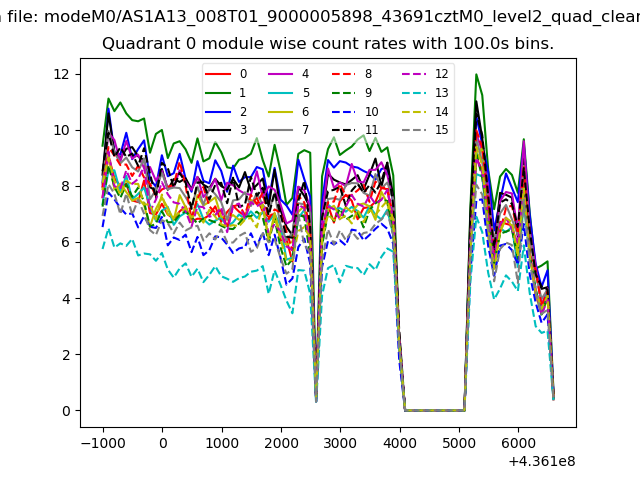 |
 |
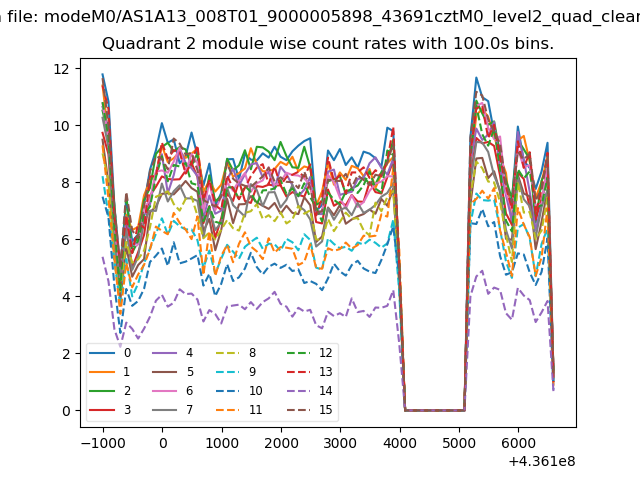
| Module-wise count rates for Quadrant B Data is divided into 100 sec bins |
 |
 |
| Module-wise count rates for Quadrant C Data is divided into 100 sec bins |
 |
 |
| Module-wise count rates for Quadrant D Data is divided into 100 sec bins |
 |
 |
| Parameter | Plot |
|---|---|
| CZT HV Monitor | 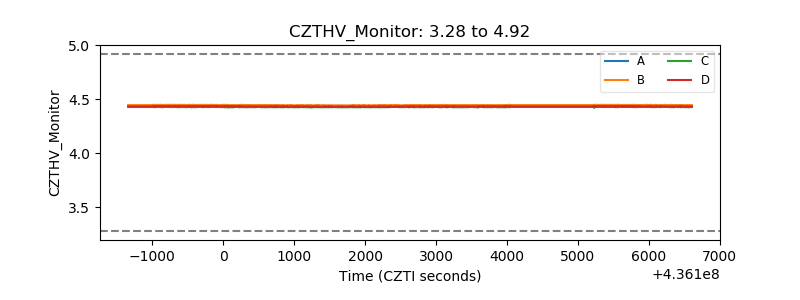 |
| D_VDD | 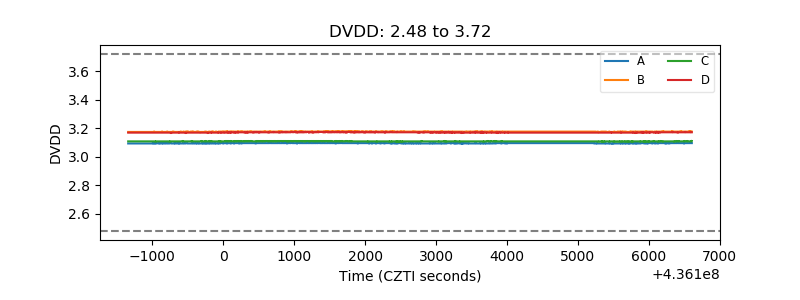 |
| Temperature 1 | 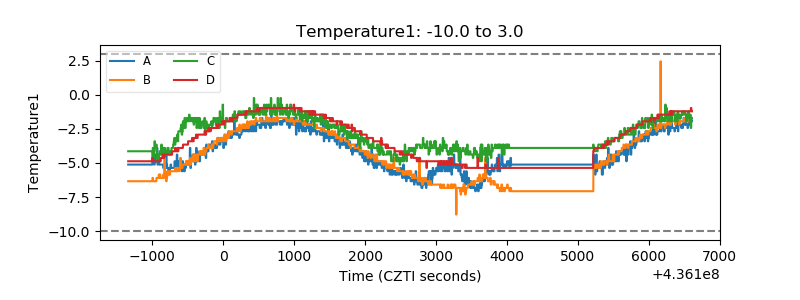 |
| Veto HV Monitor |  |
| Veto LLD | 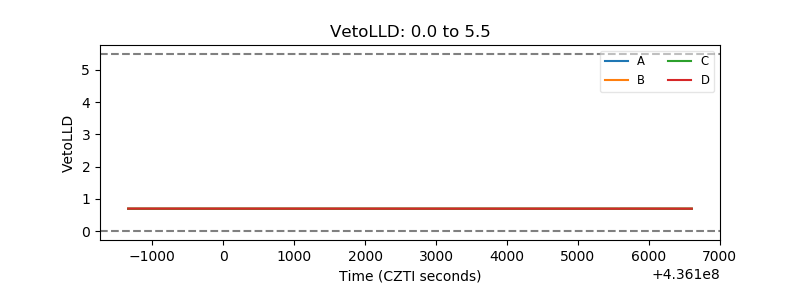 |
| Alpha Counter | 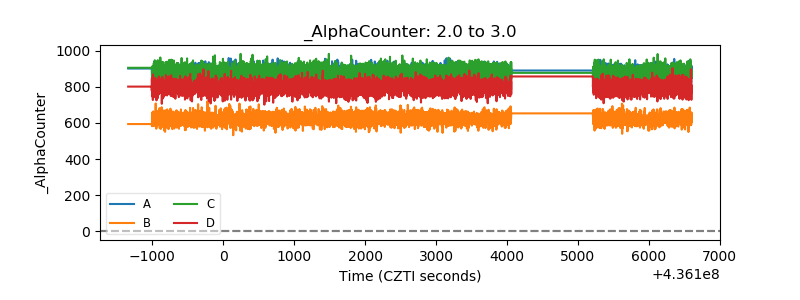 |
| _CPM_Rate | 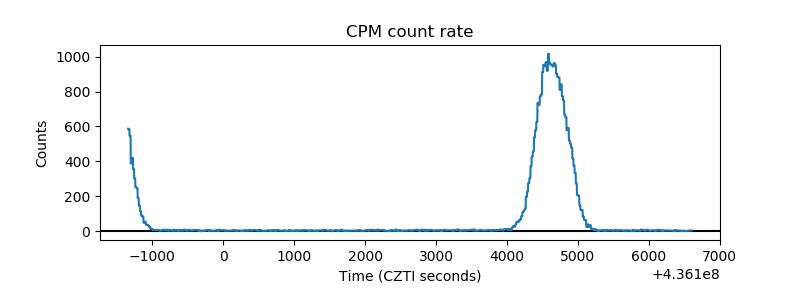 |
| CZT Counter | 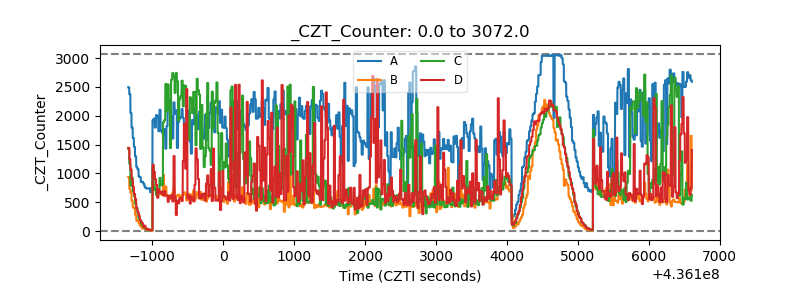 |
| +2.5 Volts monitor | 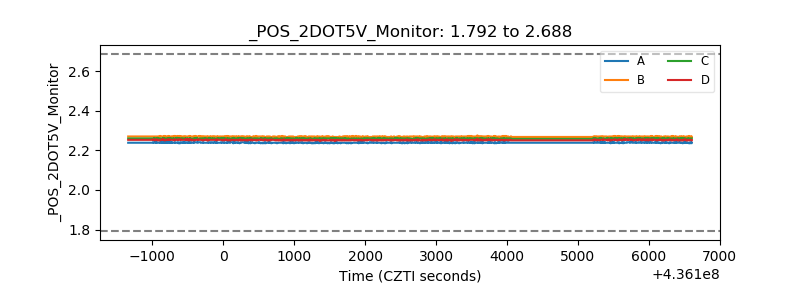 |
| +5 Volts monitor | 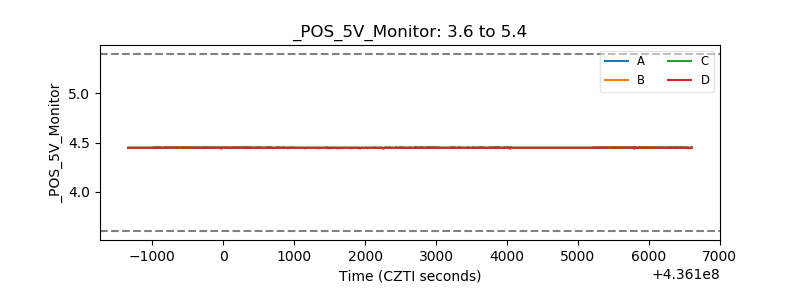 |
| _ROLL_ROT | 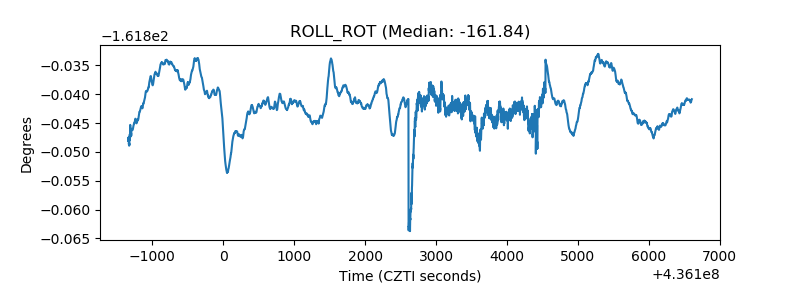 |
| _Roll_DEC | 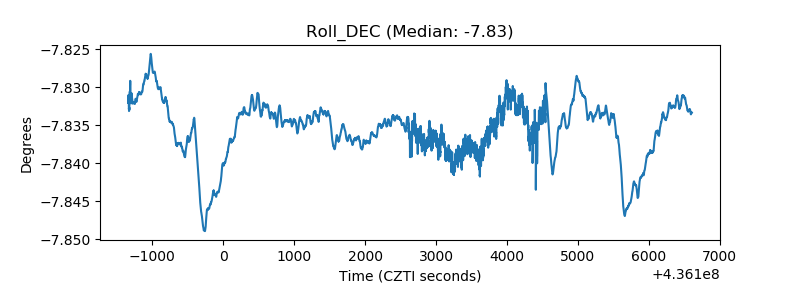 |
| _Roll_RA | 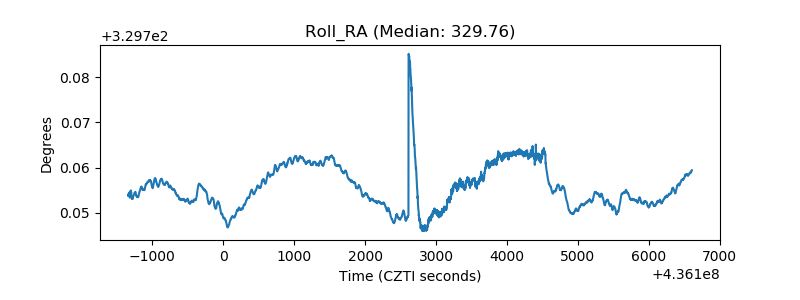 |
| Veto Counter | 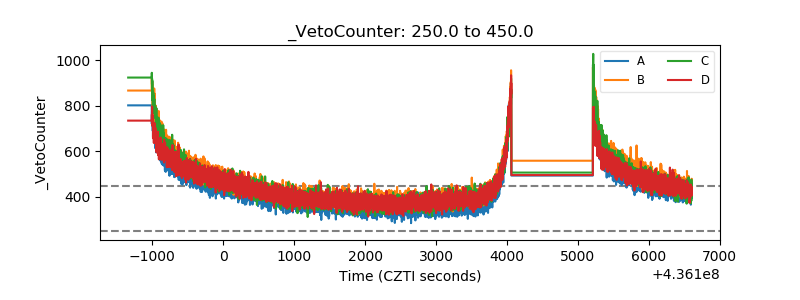 |