| Param | Original file | Final file |
|---|---|---|
| Filename | modeM0/AS1A13_008T01_9000005898_43692cztM0_level2.fits | modeM0/AS1A13_008T01_9000005898_43692cztM0_level2_quad_clean.evt |
| Size (bytes) | 782,225,280 | 99,351,360 |
| Size | 746.0 MB | 94.7 MB |
| Events in quadrant A | 14,496,133 | 470,235 |
| Events in quadrant B | 3,361,365 | 763,634 |
| Events in quadrant C | 5,424,250 | 702,387 |
| Events in quadrant D | 5,201,674 | 644,390 |
| Mode M9 | |||
|---|---|---|---|
| Quadrant | BADHDUFLAG | Total packets | Discarded packets |
| A | 0 | 11 | 0 |
| B | 0 | 11 | 0 |
| C | 0 | 11 | 0 |
| D | 0 | 11 | 0 |
| Mode SS | |||
|---|---|---|---|
| Quadrant | BADHDUFLAG | Total packets | Discarded packets |
| A | 0 | 124 | 0 |
| B | 0 | 124 | 0 |
| C | 0 | 124 | 0 |
| D | 0 | 124 | 0 |
| Mode M0 | |||
|---|---|---|---|
| Quadrant | BADHDUFLAG | Total packets | Discarded packets |
| A | 0 | 47220 | 1 |
| B | 0 | 13910 | 3 |
| C | 0 | 20273 | 1 |
| D | 0 | 19579 | 1 |
| Quadrant | Total seconds | Saturated seconds | Saturation percentage |
|---|---|---|---|
| A | 6080 | 5514 | 90.690789% |
| B | 6080 | 164 | 2.697368% |
| C | 6080 | 667 | 10.970395% |
| D | 6080 | 599 | 9.851974% |
Noise dominated data is calculated using 1-second bins in cleaned event files. If a bin has >2000 counts, and if more than 50% of those come from <1% of pixels, then it is considered to be noise-dominated and hence unusable.
| Quadrant | # 1 sec bins | Bins with >0 counts | Bins with >2000 counts | High rate bins dominated by noise | Noise dominated (total time) | Noise dominated (detector-on time) | Marked lightcurve |
|---|---|---|---|---|---|---|---|
| A | 7230 | 6081 | 5102 | 5102 | 70.57% | 83.90% | 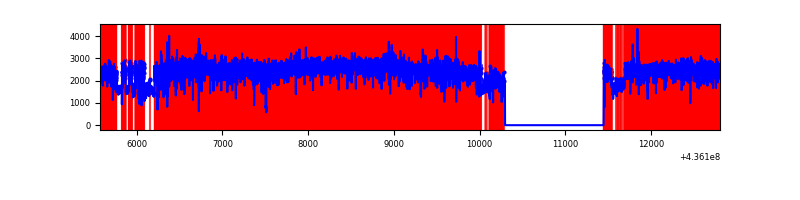 |
| B | 7230 | 6081 | 42 | 42 | 0.58% | 0.69% | 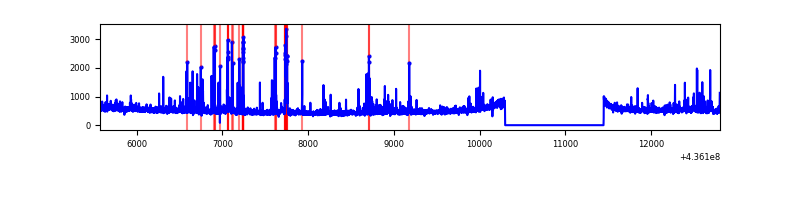 |
| C | 7230 | 6081 | 510 | 510 | 7.05% | 8.39% | 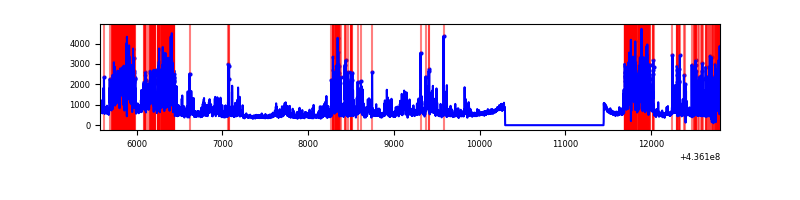 |
| D | 7230 | 6081 | 313 | 313 | 4.33% | 5.15% | 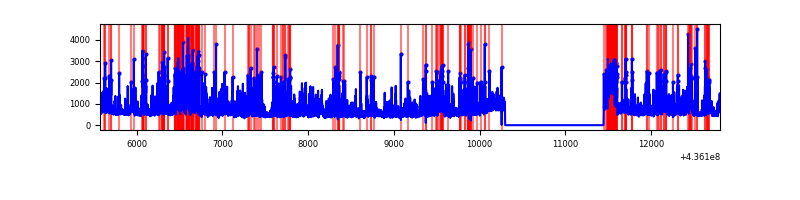 |
Top three noisy pixels from each quadrant. If the there are fewer than three noisy pixels in the level2.evt file, extra rows are filled as -1
| Pixel properties | Quadrant properties | ||||||
|---|---|---|---|---|---|---|---|
| Quadrant | DetID | PixID | Counts | Sigma | Mean | Median | Sigma |
| A | 14 | 63 | 8185655 | 84581.28 | 467 | 459 | 96.8 |
| A | 15 | 222 | 3560483 | 36787.31 | 467 | 459 | 96.8 |
| A | 10 | 83 | 516517 | 5332.65 | 467 | 459 | 96.8 |
| B | 5 | 235 | 287028 | 1959.11 | 739 | 718 | 146.1 |
| B | 4 | 206 | 66528 | 450.31 | 739 | 718 | 146.1 |
| B | 4 | 171 | 39869 | 267.9 | 739 | 718 | 146.1 |
| C | 15 | 157 | 1762735 | 10779.76 | 694 | 699 | 163.5 |
| C | 3 | 233 | 497597 | 3039.92 | 694 | 699 | 163.5 |
| C | 15 | 158 | 123763 | 752.88 | 694 | 699 | 163.5 |
| D | 5 | 235 | 420791 | 2357.99 | 701 | 679 | 178.2 |
| D | 14 | 210 | 395706 | 2217.2 | 701 | 679 | 178.2 |
| D | 7 | 80 | 380479 | 2131.73 | 701 | 679 | 178.2 |
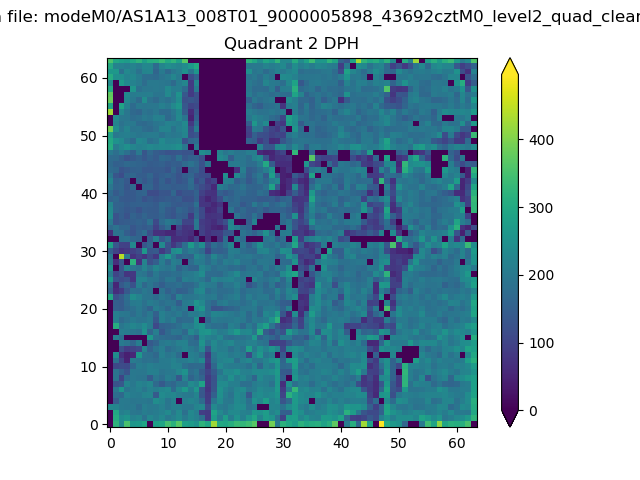
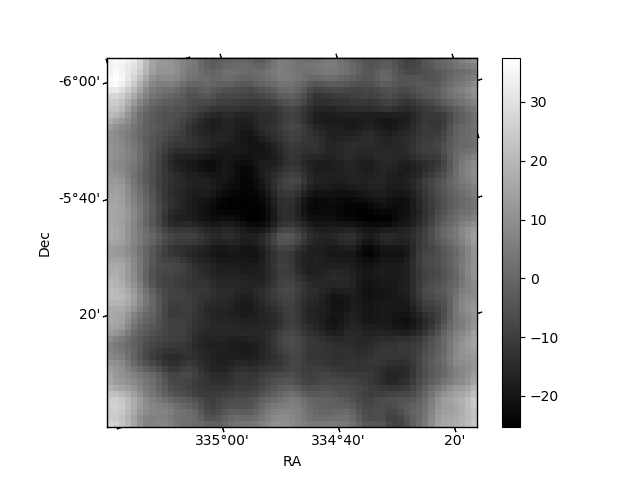
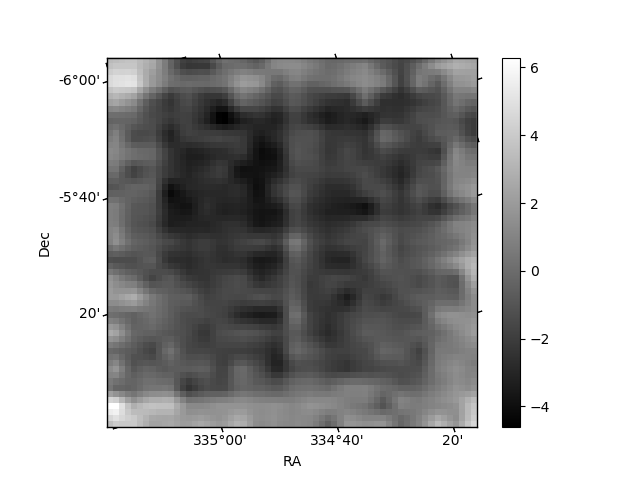
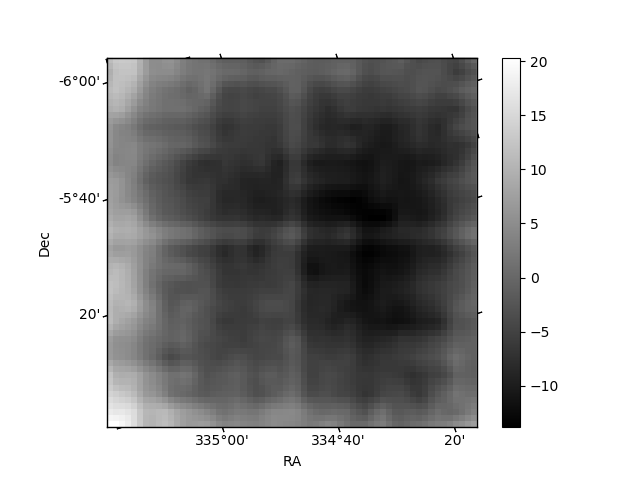
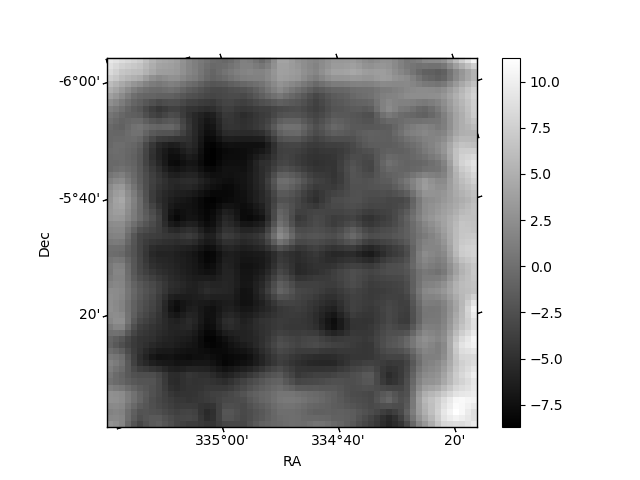
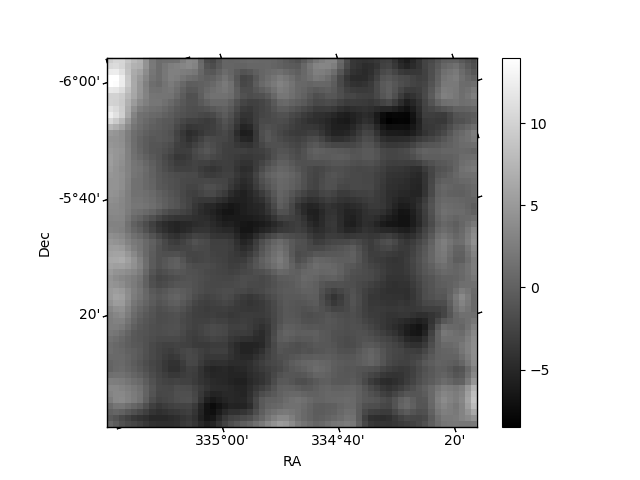
Histogram calculated using DETX and DETY for each event in the final _common_clean file
| Quadrant A | 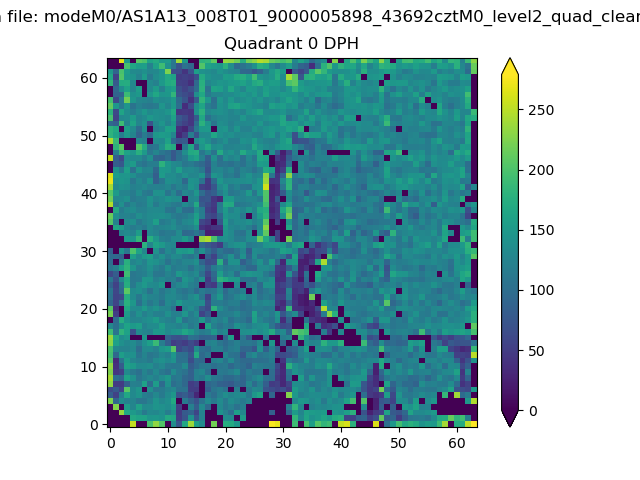 |
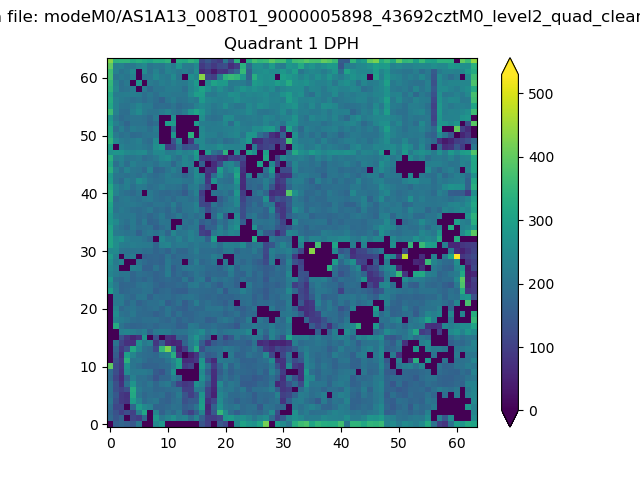 |
Quadrant B |
|---|---|---|---|
| Quadrant D | 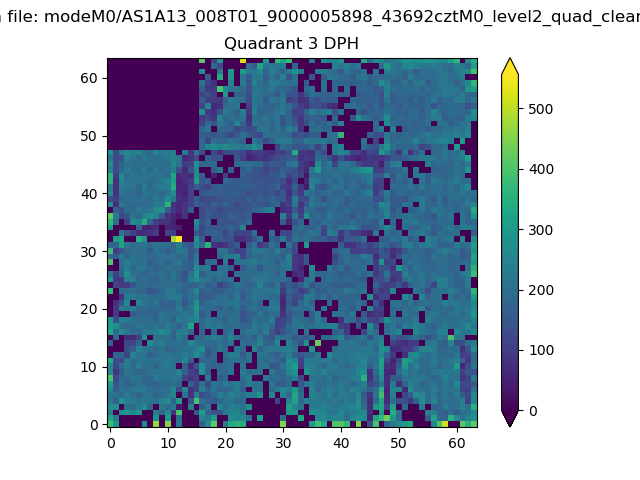 |
 |
Quadrant C |
| Plot type | Count rate plots | Images |
|---|---|---|
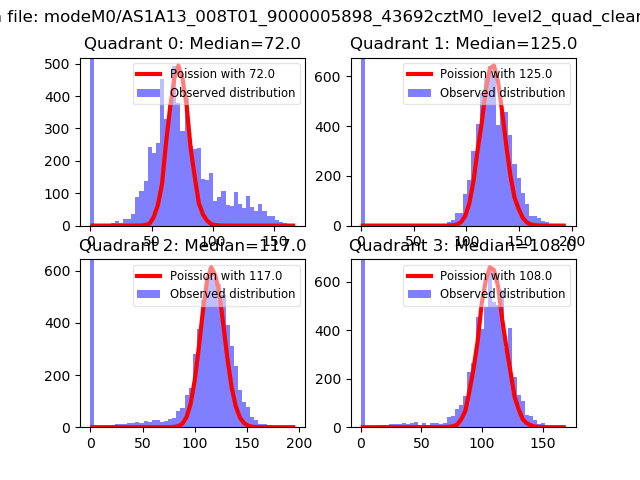
| Comparison with Poisson distribution Blue bars denote a histogram of data divided into 1 sec bins. Red curve is a Poisson curve with rate = median count rate of data. |
 |
 |
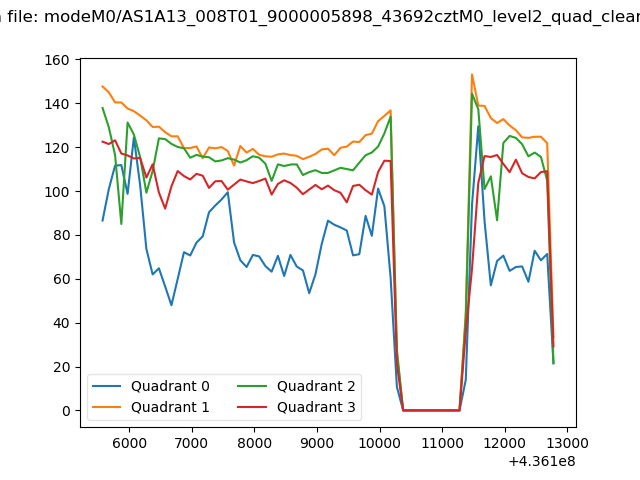
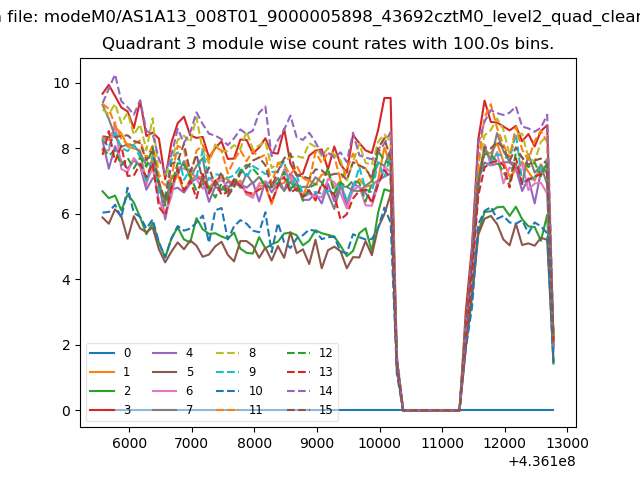
| Quadrant-wise count rates Data is divided into 100 sec bins |
 |
|
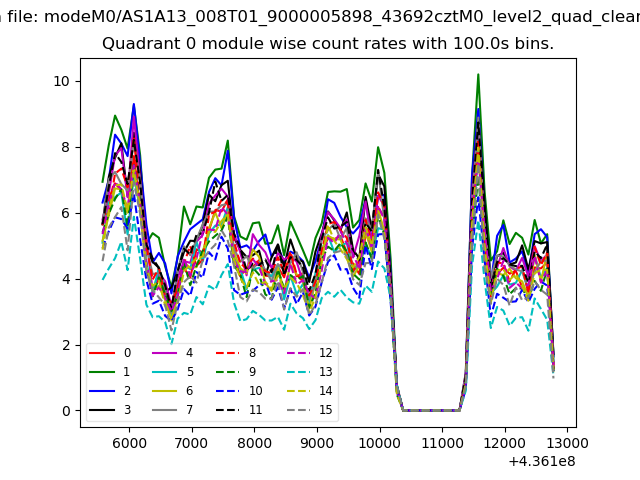
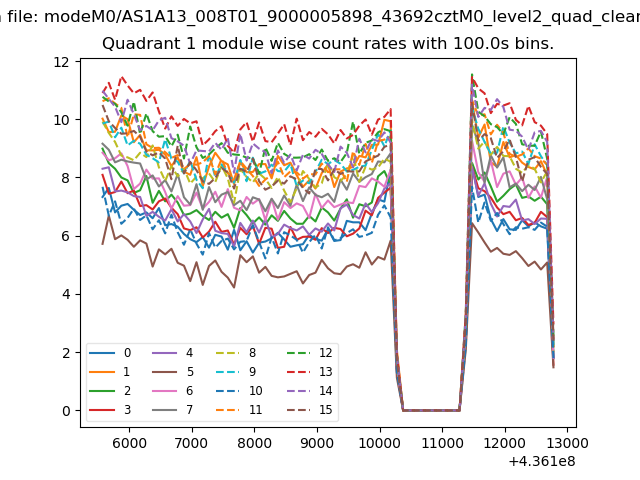
| Module-wise count rates for Quadrant A Data is divided into 100 sec bins |
 |
 |
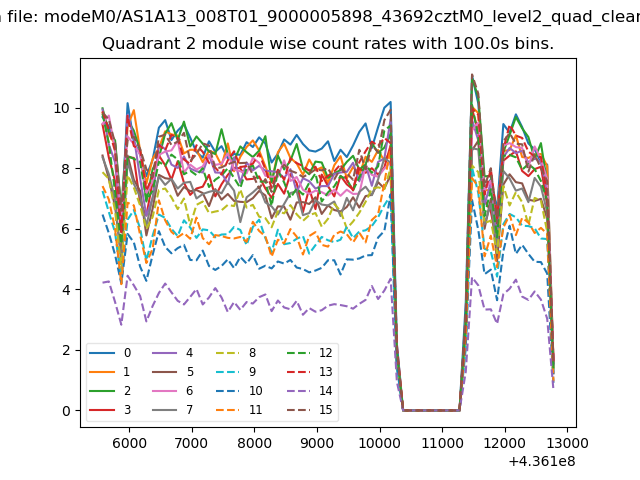
| Module-wise count rates for Quadrant B Data is divided into 100 sec bins |
 |
 |
| Module-wise count rates for Quadrant C Data is divided into 100 sec bins |
 |
 |
| Module-wise count rates for Quadrant D Data is divided into 100 sec bins |
 |
 |
| Parameter | Plot |
|---|---|
| CZT HV Monitor | 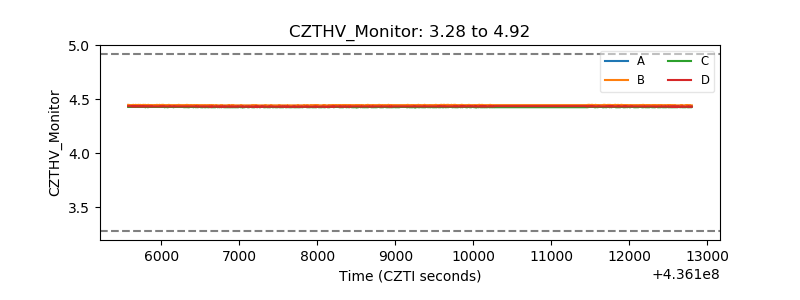 |
| D_VDD | 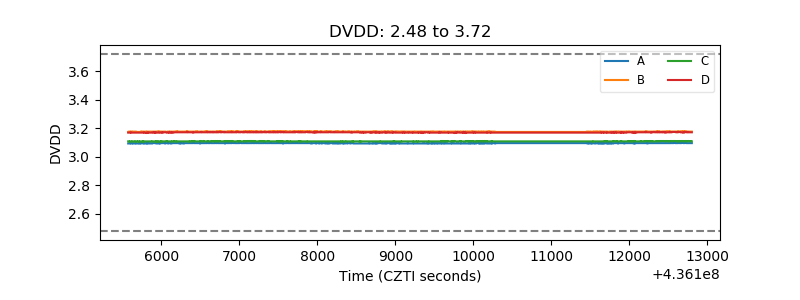 |
| Temperature 1 | 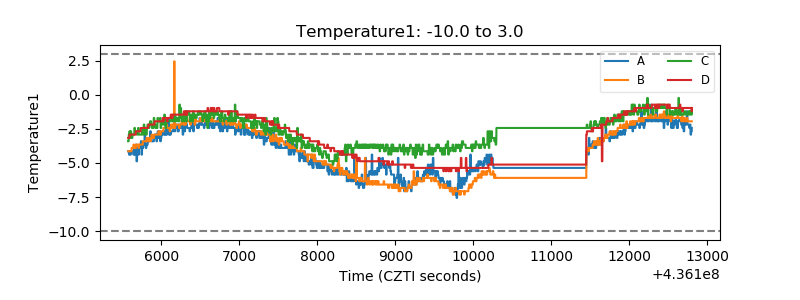 |
| Veto HV Monitor |  |
| Veto LLD | 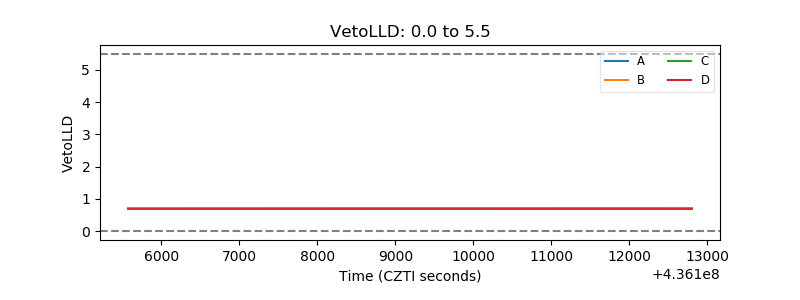 |
| Alpha Counter | 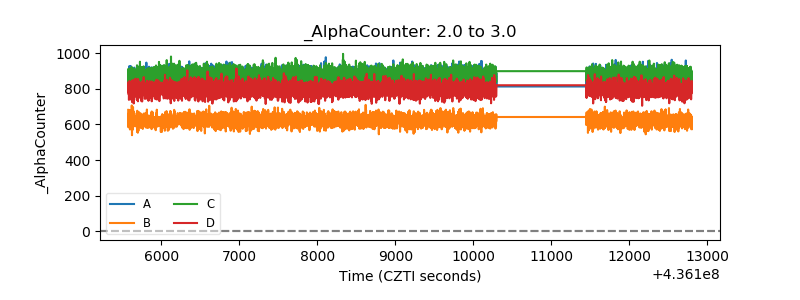 |
| _CPM_Rate | 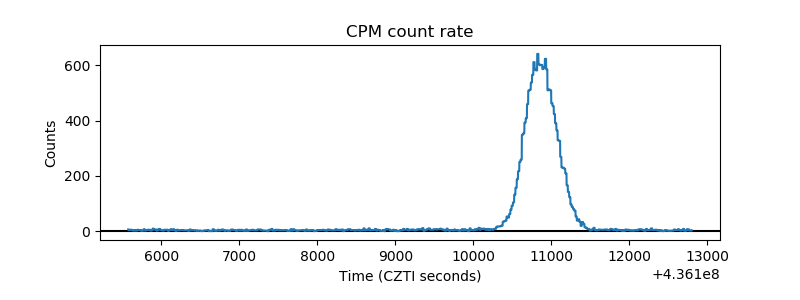 |
| CZT Counter | 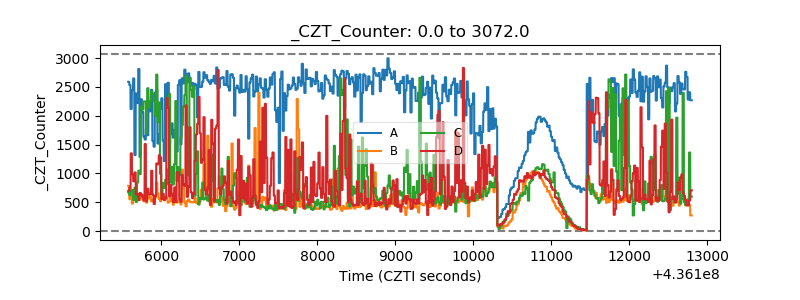 |
| +2.5 Volts monitor | 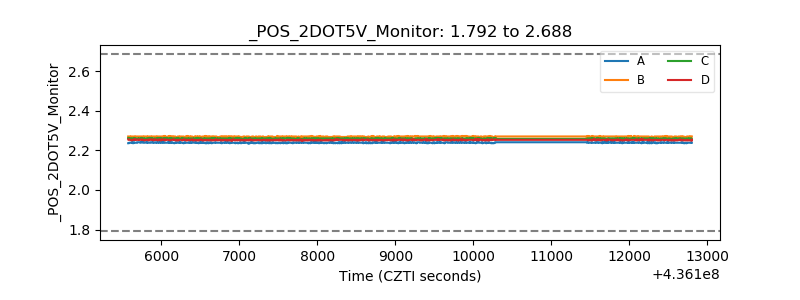 |
| +5 Volts monitor | 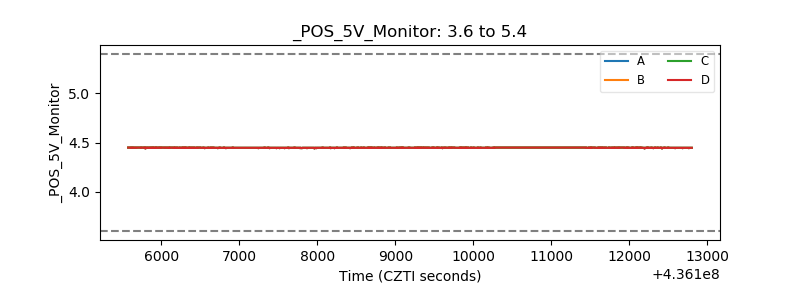 |
| _ROLL_ROT | 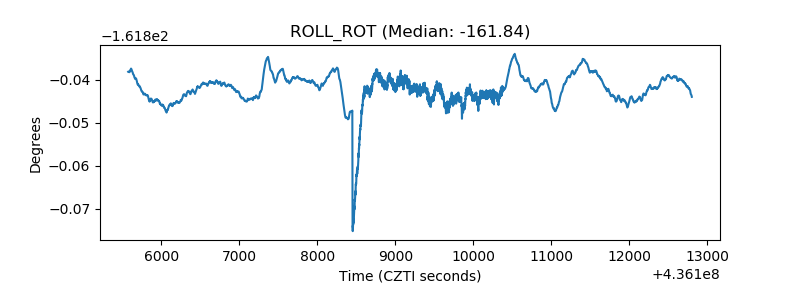 |
| _Roll_DEC | 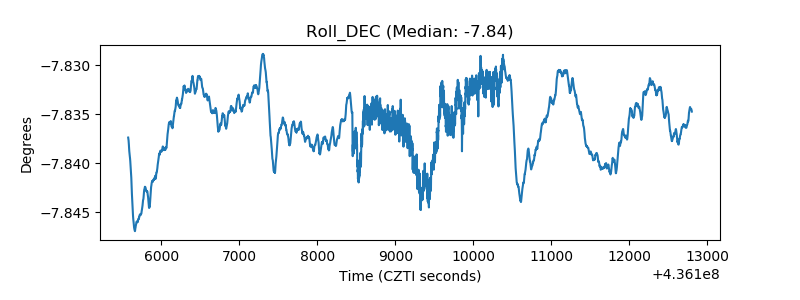 |
| _Roll_RA | 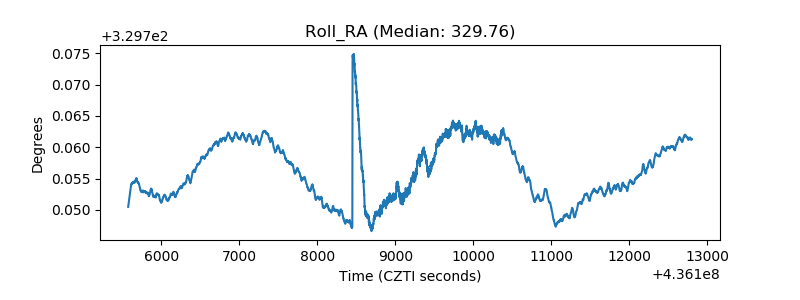 |
| Veto Counter | 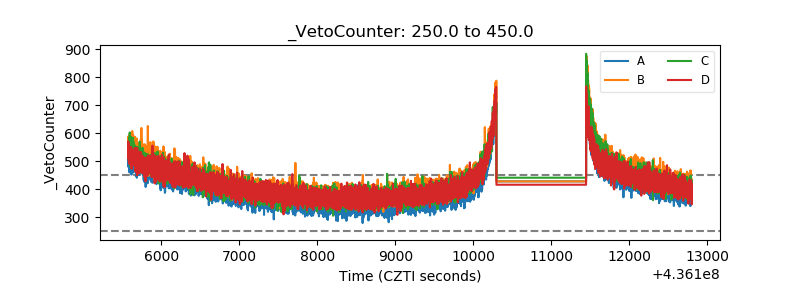 |