| Param | Original file | Final file |
|---|---|---|
| Filename | modeM0/AS1A13_008T01_9000005898_43693cztM0_level2.fits | modeM0/AS1A13_008T01_9000005898_43693cztM0_level2_quad_clean.evt |
| Size (bytes) | 831,620,160 | 109,923,840 |
| Size | 793.1 MB | 104.8 MB |
| Events in quadrant A | 12,691,913 | 675,244 |
| Events in quadrant B | 3,899,696 | 804,303 |
| Events in quadrant C | 7,876,294 | 691,675 |
| Events in quadrant D | 5,794,877 | 684,527 |
| Mode M9 | |||
|---|---|---|---|
| Quadrant | BADHDUFLAG | Total packets | Discarded packets |
| A | 0 | 9 | 0 |
| B | 0 | 9 | 0 |
| C | 0 | 9 | 0 |
| D | 0 | 9 | 0 |
| Mode SS | |||
|---|---|---|---|
| Quadrant | BADHDUFLAG | Total packets | Discarded packets |
| A | 0 | 138 | 0 |
| B | 0 | 138 | 0 |
| C | 0 | 138 | 0 |
| D | 0 | 138 | 0 |
| Mode M0 | |||
|---|---|---|---|
| Quadrant | BADHDUFLAG | Total packets | Discarded packets |
| A | 0 | 42359 | 1 |
| B | 0 | 15907 | 1 |
| C | 0 | 28103 | 2 |
| D | 0 | 21787 | 1 |
| Quadrant | Total seconds | Saturated seconds | Saturation percentage |
|---|---|---|---|
| A | 6744 | 3123 | 46.307829% |
| B | 6744 | 201 | 2.980427% |
| C | 6743 | 1539 | 22.823669% |
| D | 6743 | 652 | 9.669287% |
Noise dominated data is calculated using 1-second bins in cleaned event files. If a bin has >2000 counts, and if more than 50% of those come from <1% of pixels, then it is considered to be noise-dominated and hence unusable.
| Quadrant | # 1 sec bins | Bins with >0 counts | Bins with >2000 counts | High rate bins dominated by noise | Noise dominated (total time) | Noise dominated (detector-on time) | Marked lightcurve |
|---|---|---|---|---|---|---|---|
| A | 7714 | 6745 | 2814 | 2814 | 36.48% | 41.72% | 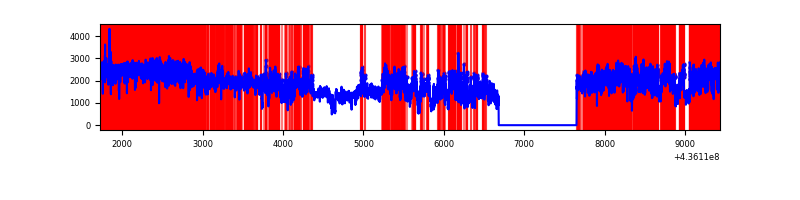 |
| B | 7714 | 6745 | 54 | 54 | 0.70% | 0.80% | 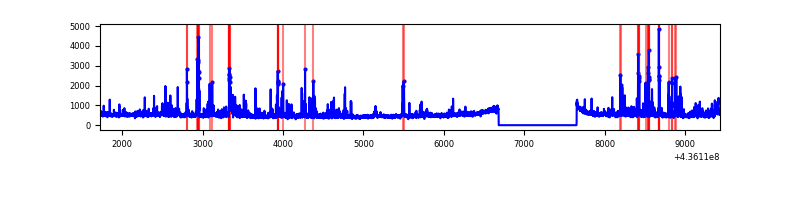 |
| C | 7713 | 6744 | 980 | 980 | 12.71% | 14.53% | 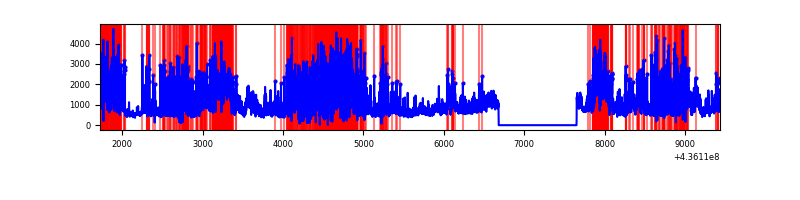 |
| D | 7713 | 6744 | 417 | 417 | 5.41% | 6.18% | 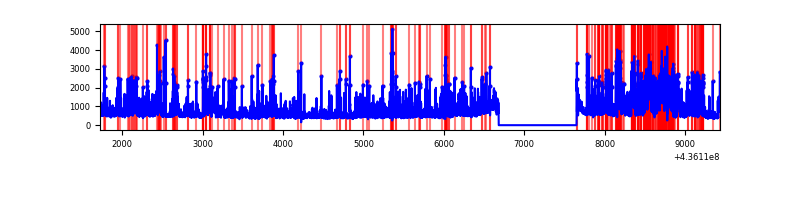 |
Top three noisy pixels from each quadrant. If the there are fewer than three noisy pixels in the level2.evt file, extra rows are filled as -1
| Pixel properties | Quadrant properties | ||||||
|---|---|---|---|---|---|---|---|
| Quadrant | DetID | PixID | Counts | Sigma | Mean | Median | Sigma |
| A | 15 | 222 | 4733602 | 33136.46 | 684 | 672 | 142.8 |
| A | 14 | 63 | 4409323 | 30866.1 | 684 | 672 | 142.8 |
| A | 10 | 83 | 767654 | 5369.84 | 684 | 672 | 142.8 |
| B | 5 | 235 | 386094 | 2469.5 | 795 | 772 | 156.0 |
| B | 4 | 206 | 153917 | 981.49 | 795 | 772 | 156.0 |
| B | 5 | 172 | 73856 | 468.39 | 795 | 772 | 156.0 |
| C | 15 | 157 | 2568435 | 15428.38 | 704 | 710 | 166.4 |
| C | 3 | 233 | 1801024 | 10817.33 | 704 | 710 | 166.4 |
| C | 15 | 158 | 409839 | 2458.28 | 704 | 710 | 166.4 |
| D | 5 | 235 | 528230 | 2760.41 | 759 | 738 | 191.1 |
| D | 2 | 249 | 445365 | 2326.77 | 759 | 738 | 191.1 |
| D | 13 | 171 | 391792 | 2046.42 | 759 | 738 | 191.1 |
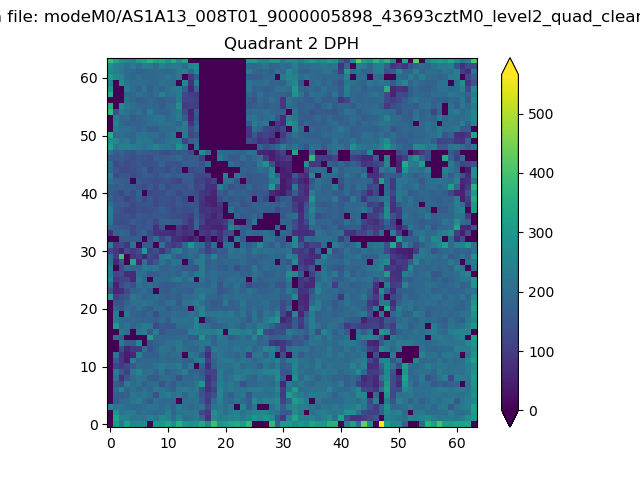
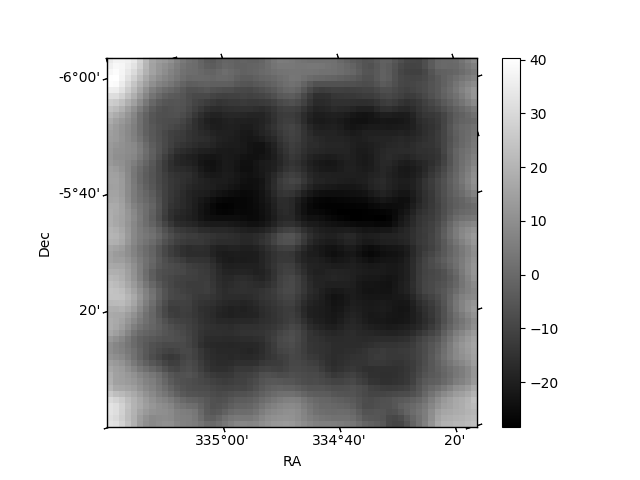
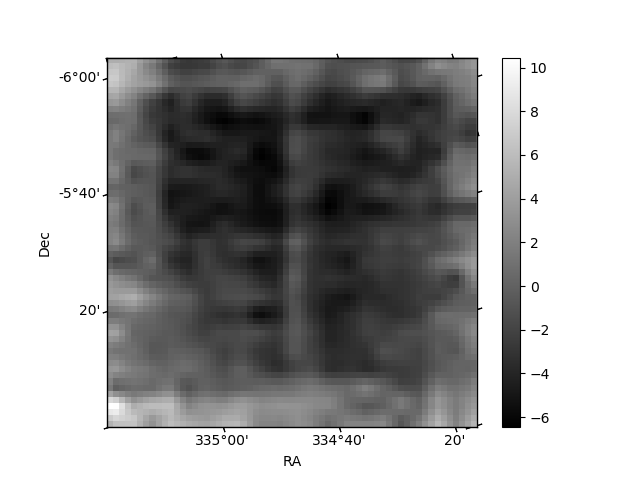
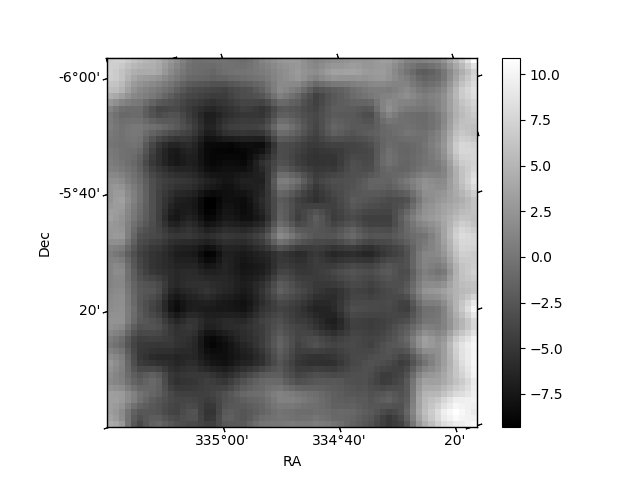
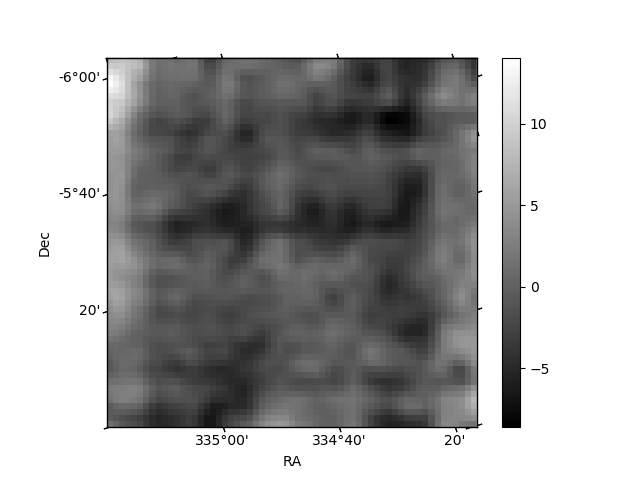
Histogram calculated using DETX and DETY for each event in the final _common_clean file
| Quadrant A | 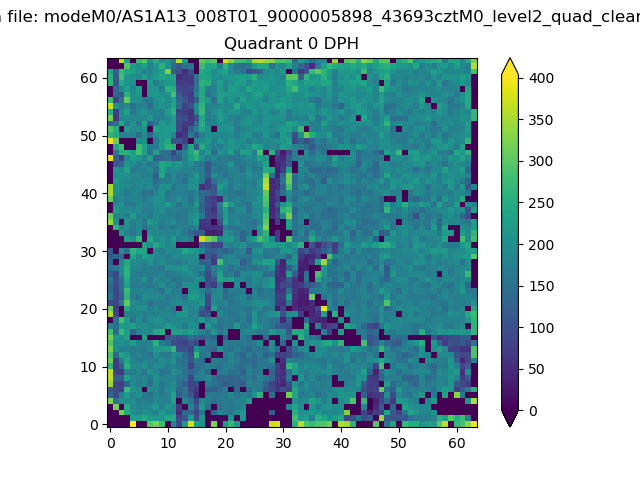 |
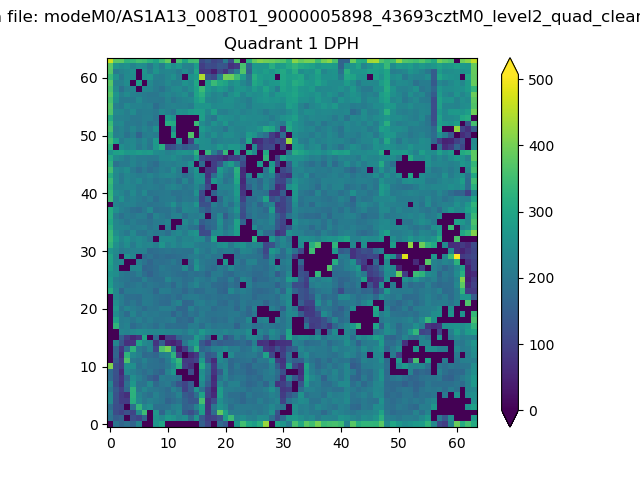 |
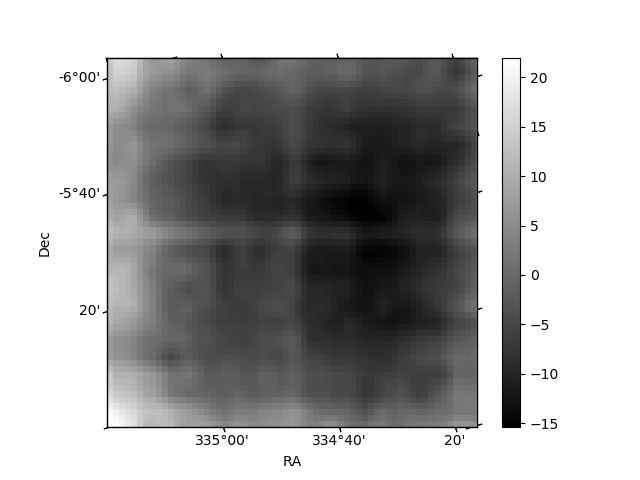
Quadrant B |
|---|---|---|---|
| Quadrant D | 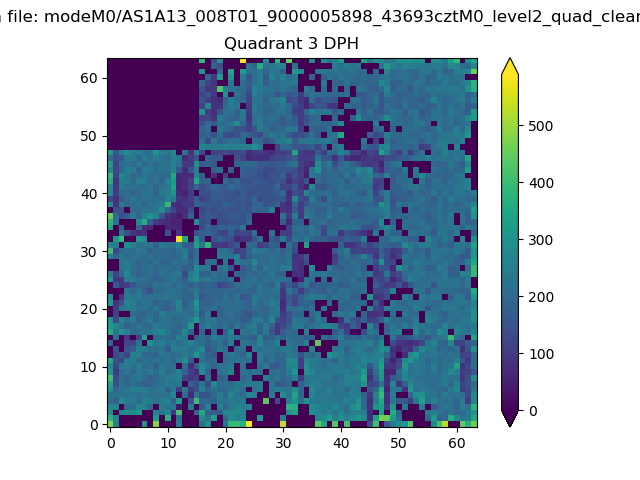 |
 |
Quadrant C |
| Plot type | Count rate plots | Images |
|---|---|---|
| Comparison with Poisson distribution Blue bars denote a histogram of data divided into 1 sec bins. Red curve is a Poisson curve with rate = median count rate of data. |
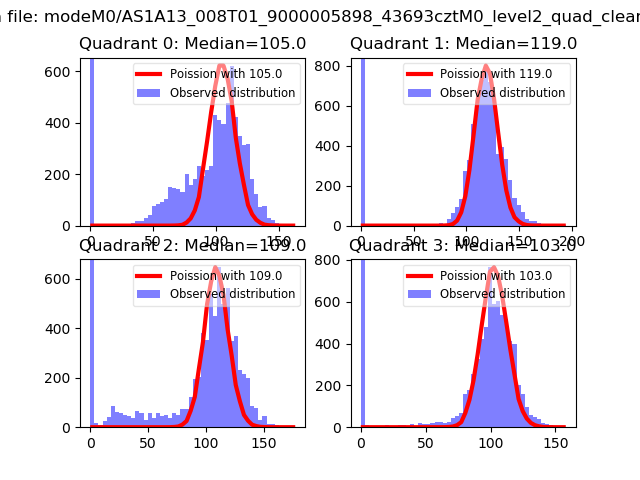 |
 |
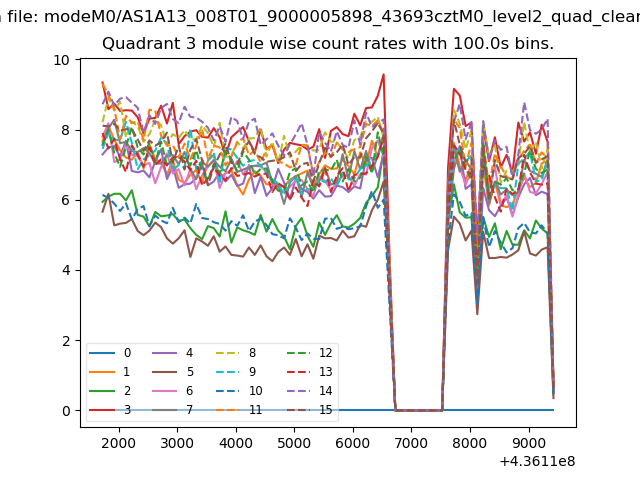
| Quadrant-wise count rates Data is divided into 100 sec bins |
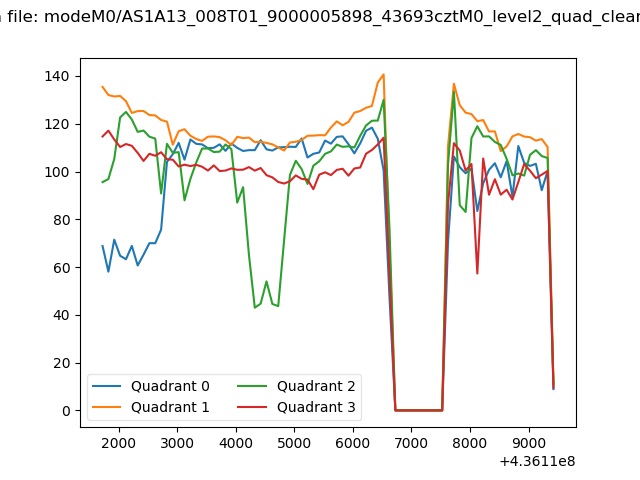 |
|
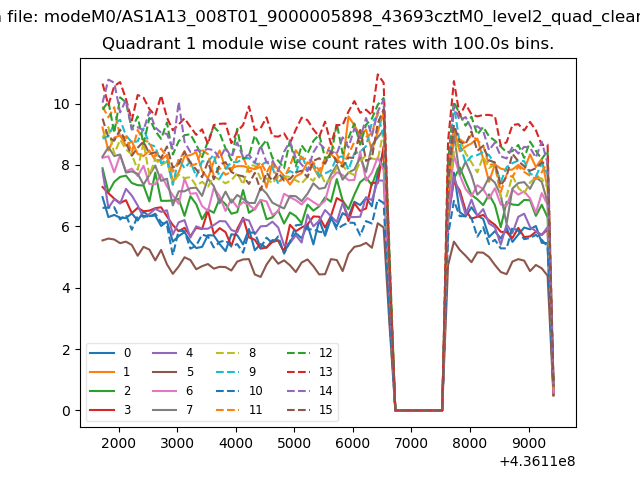
| Module-wise count rates for Quadrant A Data is divided into 100 sec bins |
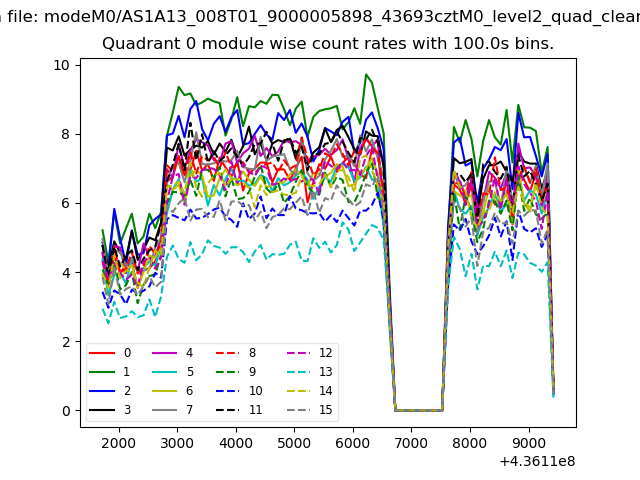 |
 |
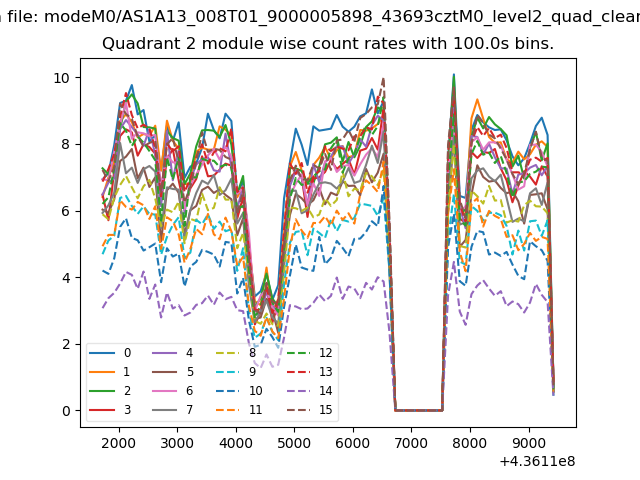
| Module-wise count rates for Quadrant B Data is divided into 100 sec bins |
 |
 |
| Module-wise count rates for Quadrant C Data is divided into 100 sec bins |
 |
 |
| Module-wise count rates for Quadrant D Data is divided into 100 sec bins |
 |
 |
| Parameter | Plot |
|---|---|
| CZT HV Monitor | 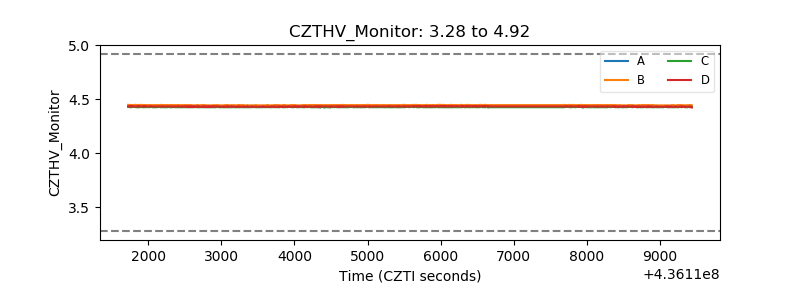 |
| D_VDD | 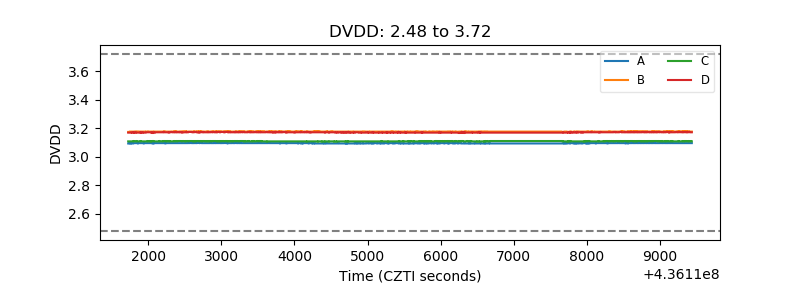 |
| Temperature 1 | 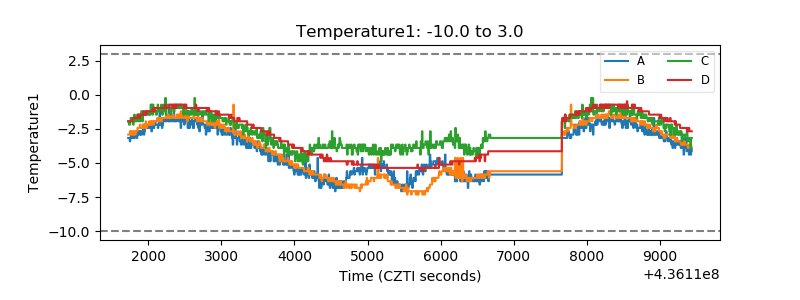 |
| Veto HV Monitor | 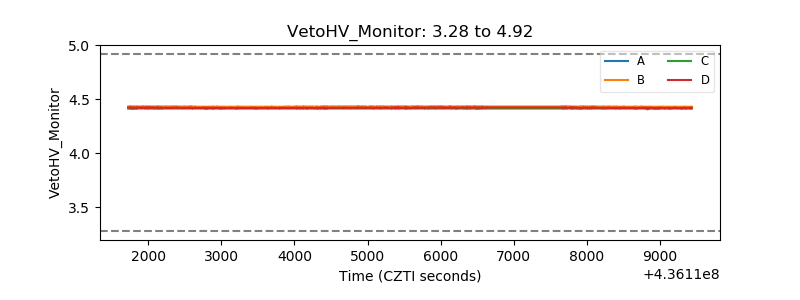 |
| Veto LLD | 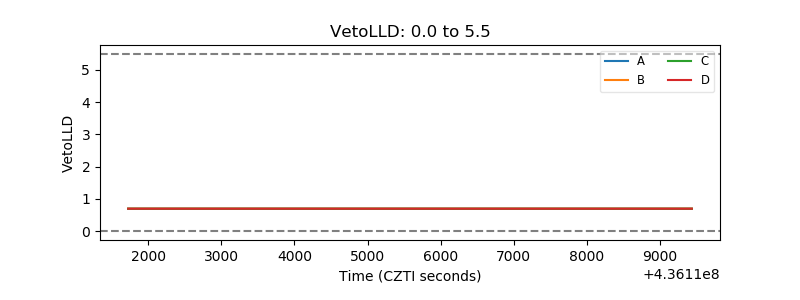 |
| Alpha Counter | 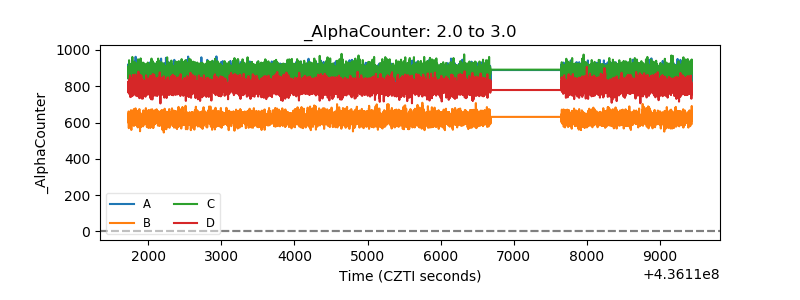 |
| _CPM_Rate | 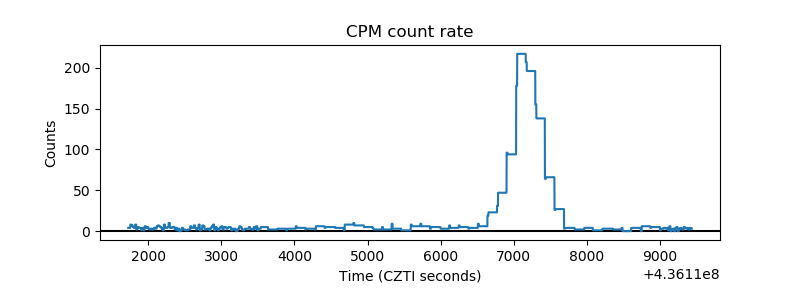 |
| CZT Counter | 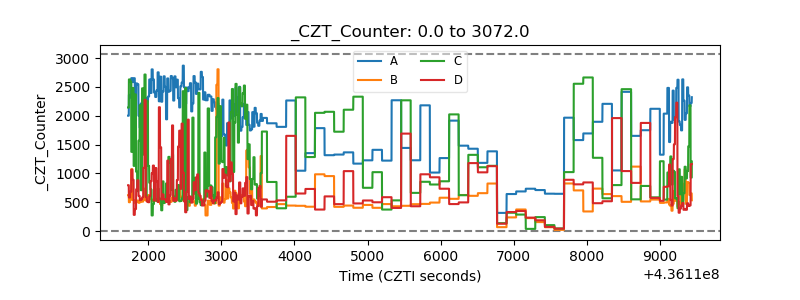 |
| +2.5 Volts monitor | 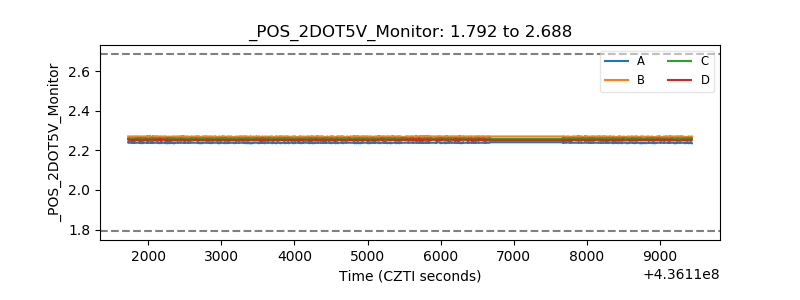 |
| +5 Volts monitor | 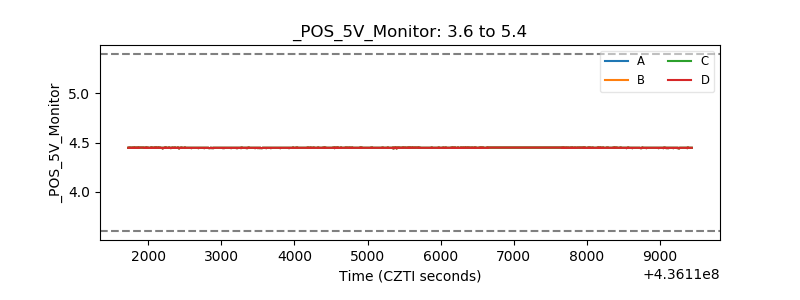 |
| _ROLL_ROT | 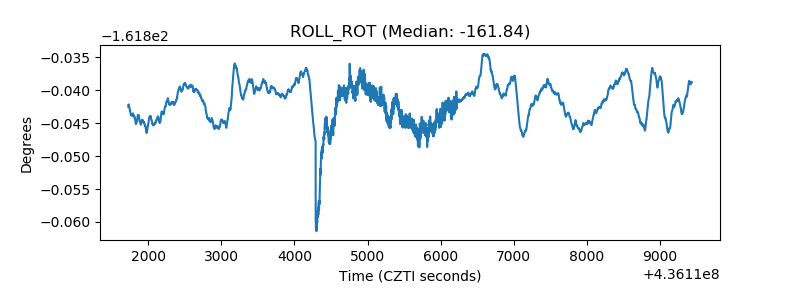 |
| _Roll_DEC | 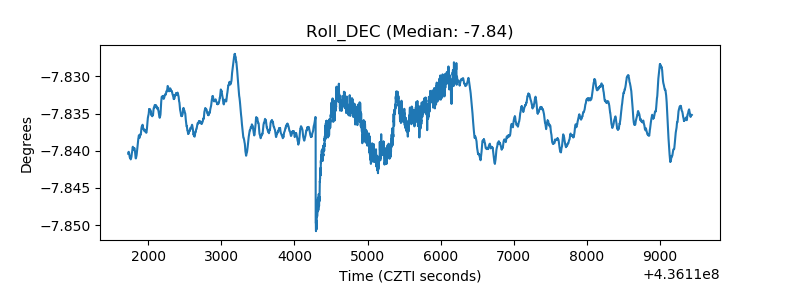 |
| _Roll_RA |  |
| Veto Counter | 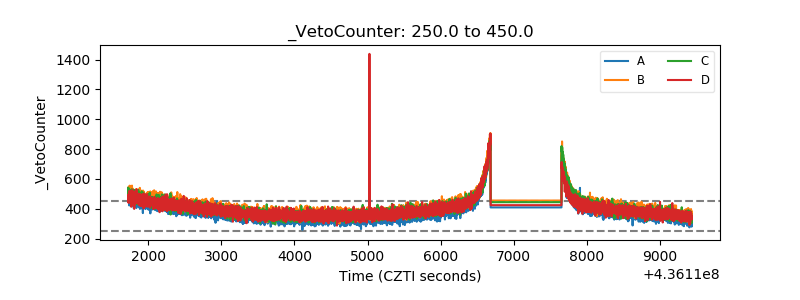 |