| Param | Original file | Final file |
|---|---|---|
| Filename | modeM0/AS1A13_008T01_9000005898_43694cztM0_level2.fits | modeM0/AS1A13_008T01_9000005898_43694cztM0_level2_quad_clean.evt |
| Size (bytes) | 859,780,800 | 114,082,560 |
| Size | 820.0 MB | 108.8 MB |
| Events in quadrant A | 12,611,798 | 736,859 |
| Events in quadrant B | 4,215,962 | 815,998 |
| Events in quadrant C | 7,354,986 | 733,327 |
| Events in quadrant D | 7,092,530 | 668,747 |
| Mode M9 | |||
|---|---|---|---|
| Quadrant | BADHDUFLAG | Total packets | Discarded packets |
| A | 0 | 6 | 0 |
| B | 0 | 6 | 0 |
| C | 0 | 6 | 0 |
| D | 0 | 6 | 0 |
| Mode SS | |||
|---|---|---|---|
| Quadrant | BADHDUFLAG | Total packets | Discarded packets |
| A | 0 | 146 | 0 |
| B | 0 | 146 | 0 |
| C | 0 | 146 | 0 |
| D | 0 | 146 | 0 |
| Mode M0 | |||
|---|---|---|---|
| Quadrant | BADHDUFLAG | Total packets | Discarded packets |
| A | 0 | 42382 | 5 |
| B | 0 | 17264 | 1 |
| C | 0 | 26690 | 1 |
| D | 0 | 25934 | 1 |
| Quadrant | Total seconds | Saturated seconds | Saturation percentage |
|---|---|---|---|
| A | 7133 | 2859 | 40.081312% |
| B | 7134 | 279 | 3.910849% |
| C | 7134 | 1170 | 16.400336% |
| D | 7134 | 1053 | 14.760303% |
Noise dominated data is calculated using 1-second bins in cleaned event files. If a bin has >2000 counts, and if more than 50% of those come from <1% of pixels, then it is considered to be noise-dominated and hence unusable.
| Quadrant | # 1 sec bins | Bins with >0 counts | Bins with >2000 counts | High rate bins dominated by noise | Noise dominated (total time) | Noise dominated (detector-on time) | Marked lightcurve |
|---|---|---|---|---|---|---|---|
| A | 7783 | 7134 | 2308 | 2308 | 29.65% | 32.35% | 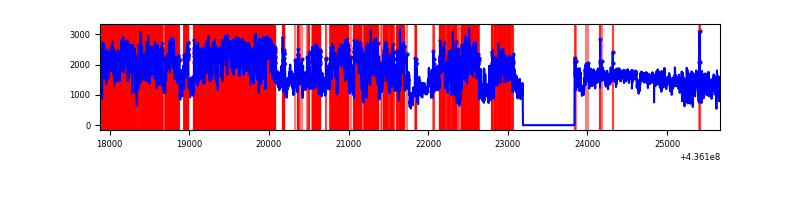 |
| B | 7784 | 7135 | 98 | 98 | 1.26% | 1.37% | 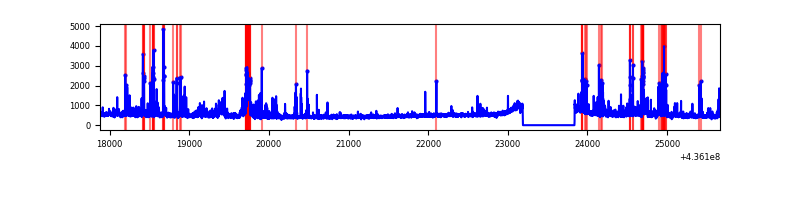 |
| C | 7784 | 7135 | 793 | 793 | 10.19% | 11.11% | 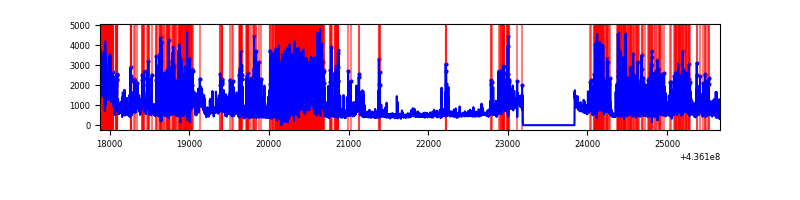 |
| D | 7784 | 7135 | 889 | 889 | 11.42% | 12.46% | 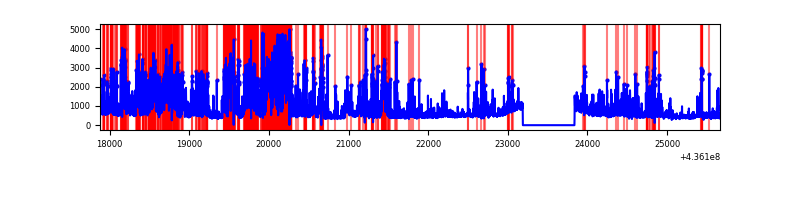 |
Top three noisy pixels from each quadrant. If the there are fewer than three noisy pixels in the level2.evt file, extra rows are filled as -1
| Pixel properties | Quadrant properties | ||||||
|---|---|---|---|---|---|---|---|
| Quadrant | DetID | PixID | Counts | Sigma | Mean | Median | Sigma |
| A | 15 | 222 | 4492387 | 28240.98 | 761 | 745 | 159.0 |
| A | 14 | 63 | 3939809 | 24766.67 | 761 | 745 | 159.0 |
| A | 10 | 83 | 851162 | 5346.95 | 761 | 745 | 159.0 |
| B | 5 | 235 | 500611 | 3008.47 | 828 | 801 | 166.1 |
| B | 4 | 206 | 144482 | 864.85 | 828 | 801 | 166.1 |
| B | 5 | 172 | 100282 | 598.8 | 828 | 801 | 166.1 |
| C | 15 | 157 | 2714818 | 15131.58 | 756 | 762 | 179.4 |
| C | 3 | 233 | 983149 | 5477.07 | 756 | 762 | 179.4 |
| C | 15 | 173 | 280080 | 1557.27 | 756 | 762 | 179.4 |
| D | 7 | 80 | 1789798 | 8990.55 | 770 | 747 | 199.0 |
| D | 2 | 249 | 443104 | 2222.98 | 770 | 747 | 199.0 |
| D | 13 | 171 | 340518 | 1707.46 | 770 | 747 | 199.0 |
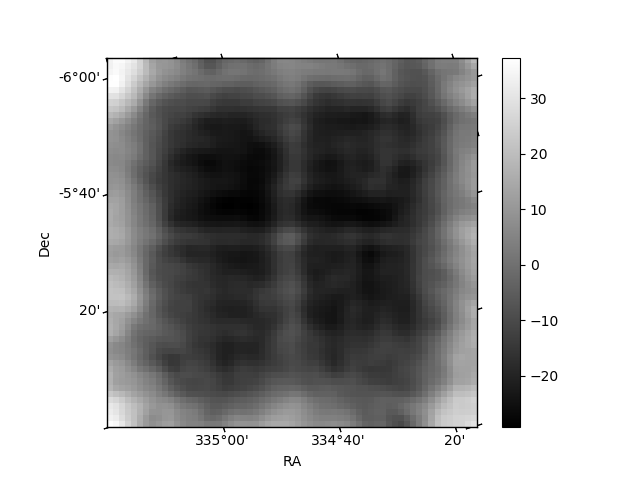
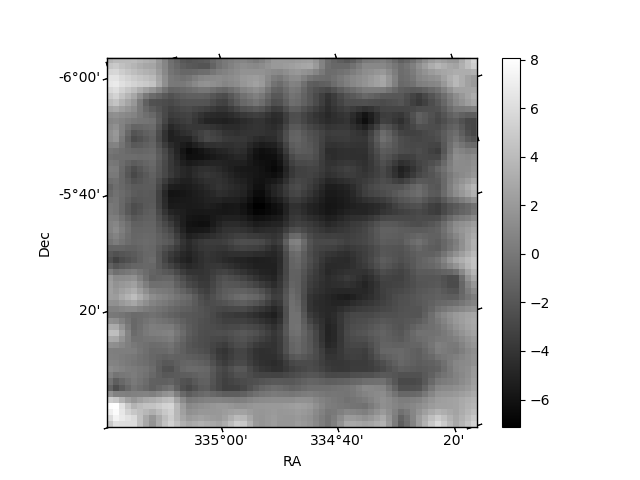
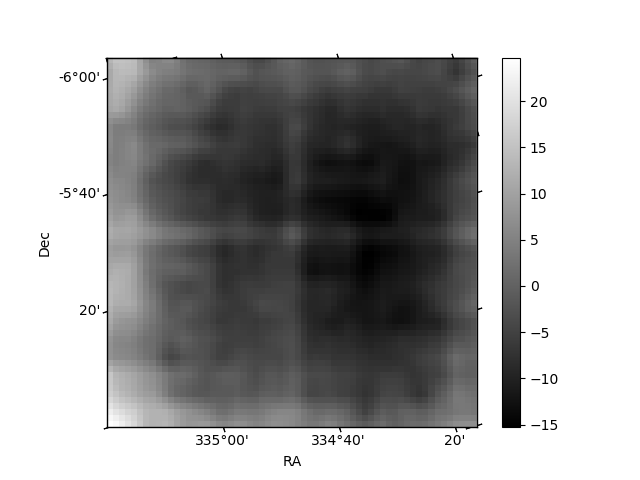
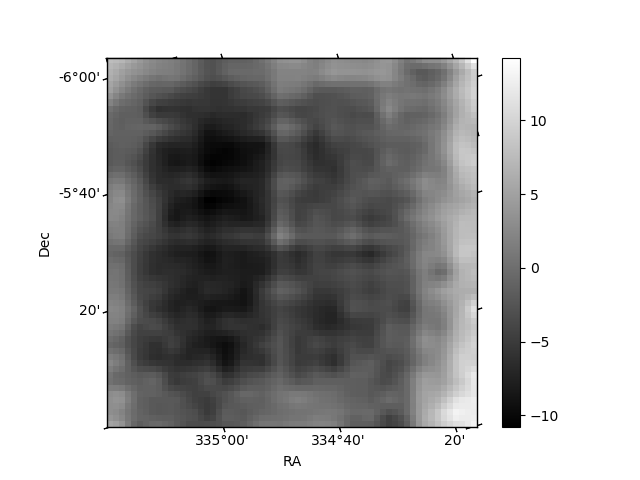
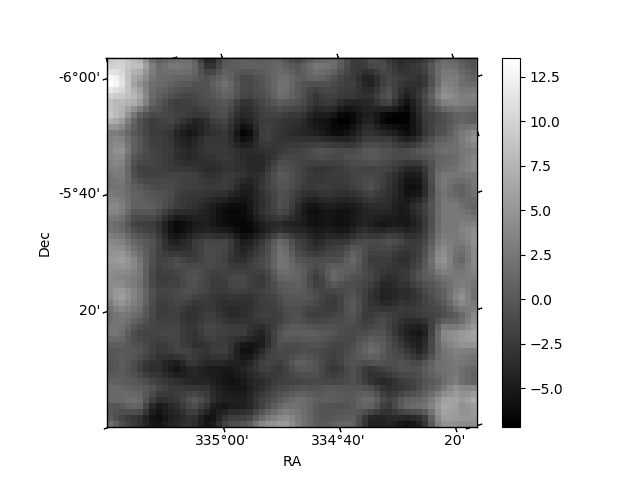
Histogram calculated using DETX and DETY for each event in the final _common_clean file
| Quadrant A | 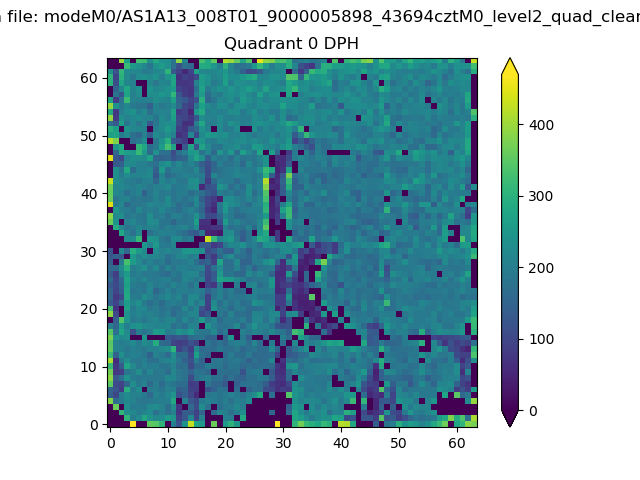 |
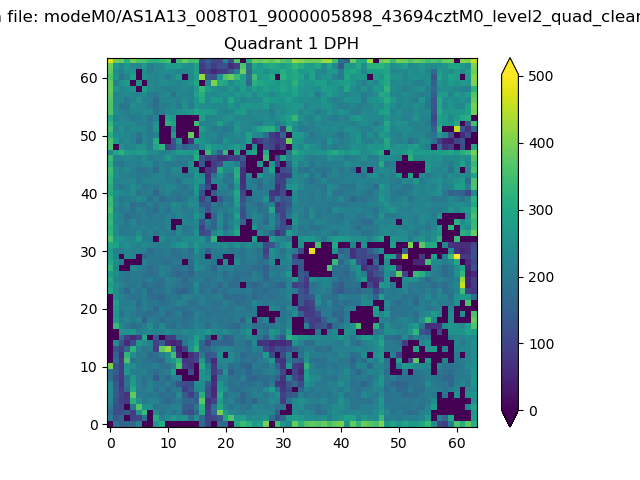 |
Quadrant B |
|---|---|---|---|
| Quadrant D | 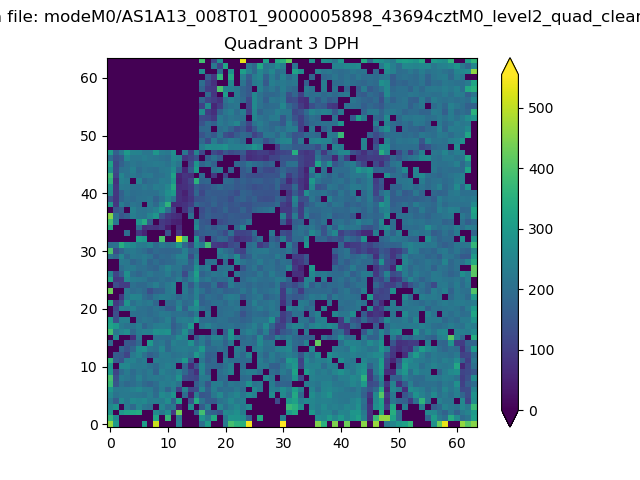 |
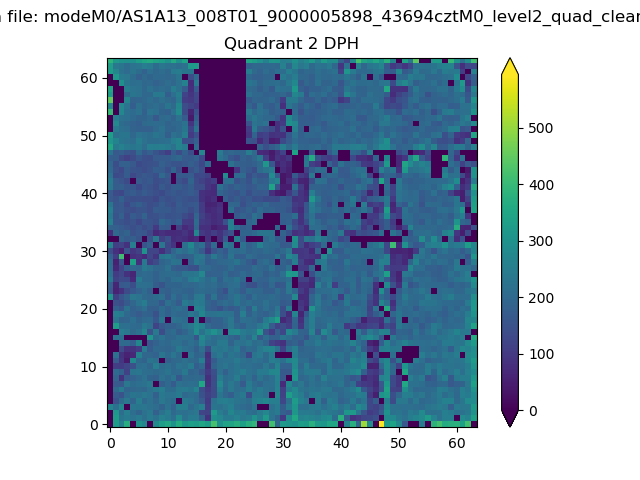 |
Quadrant C |
| Plot type | Count rate plots | Images |
|---|---|---|
| Comparison with Poisson distribution Blue bars denote a histogram of data divided into 1 sec bins. Red curve is a Poisson curve with rate = median count rate of data. |
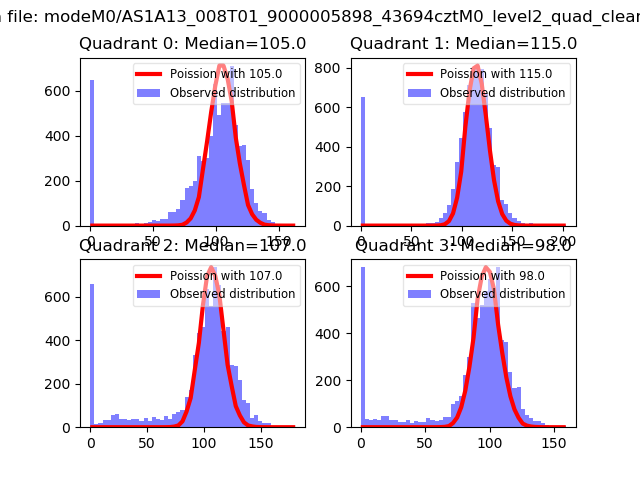 |
 |
| Quadrant-wise count rates Data is divided into 100 sec bins |
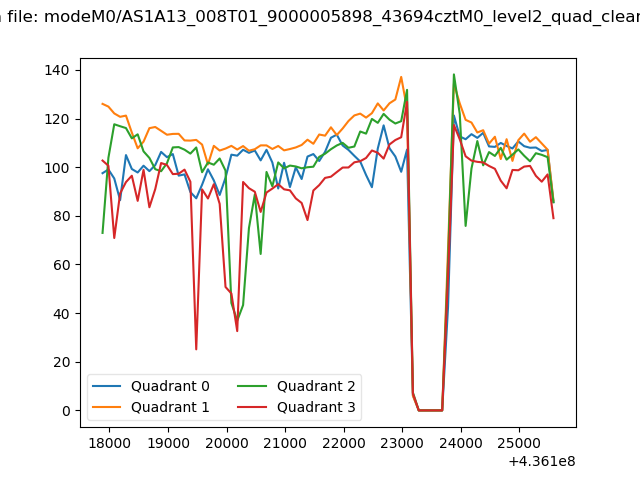 |
|
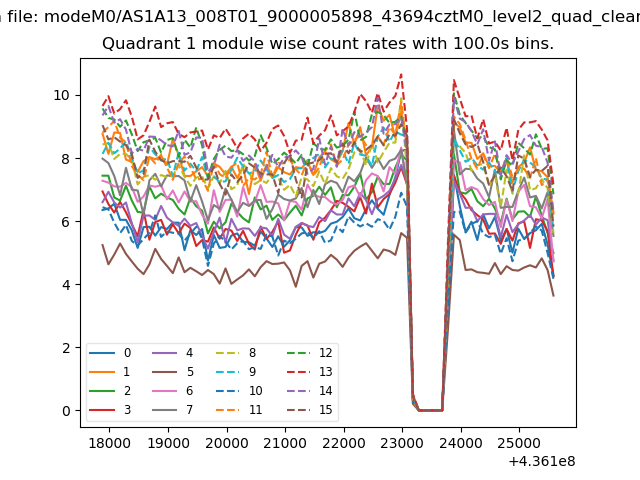
| Module-wise count rates for Quadrant A Data is divided into 100 sec bins |
 |
 |
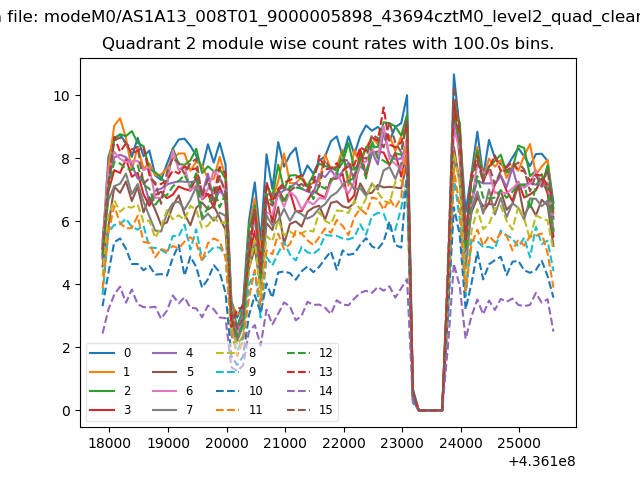
| Module-wise count rates for Quadrant B Data is divided into 100 sec bins |
 |
 |
| Module-wise count rates for Quadrant C Data is divided into 100 sec bins |
 |
 |
| Module-wise count rates for Quadrant D Data is divided into 100 sec bins |
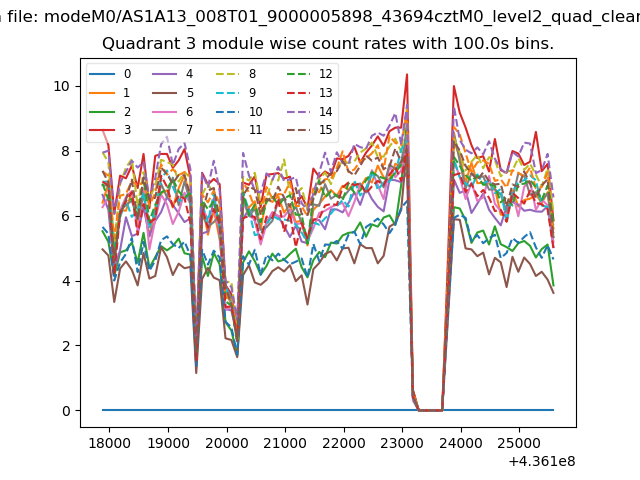 |
 |
| Parameter | Plot |
|---|---|
| CZT HV Monitor | 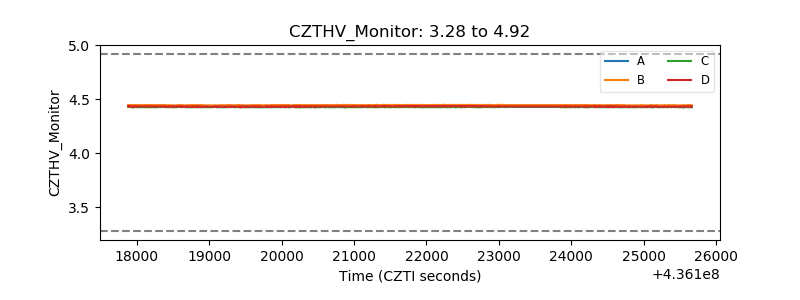 |
| D_VDD | 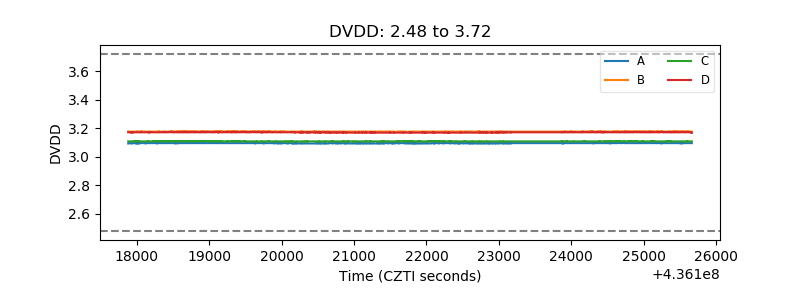 |
| Temperature 1 | 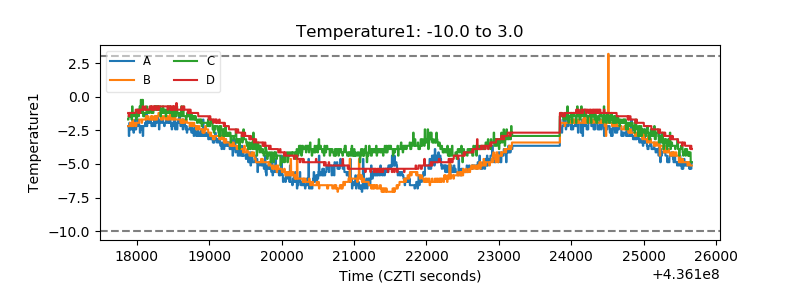 |
| Veto HV Monitor | 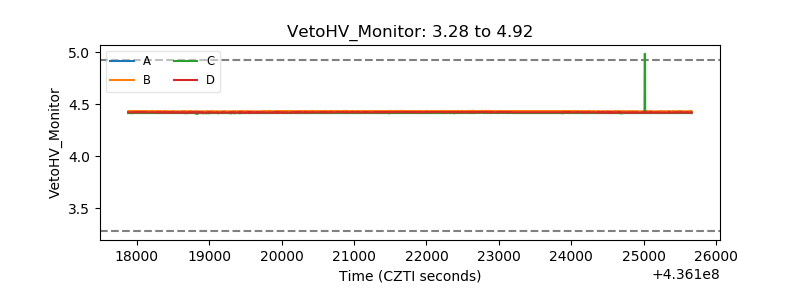 |
| Veto LLD | 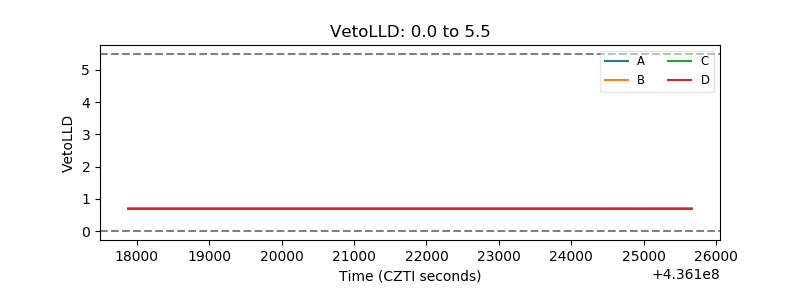 |
| Alpha Counter | 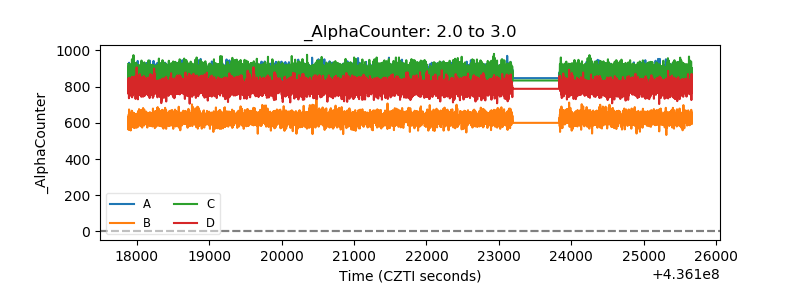 |
| _CPM_Rate | 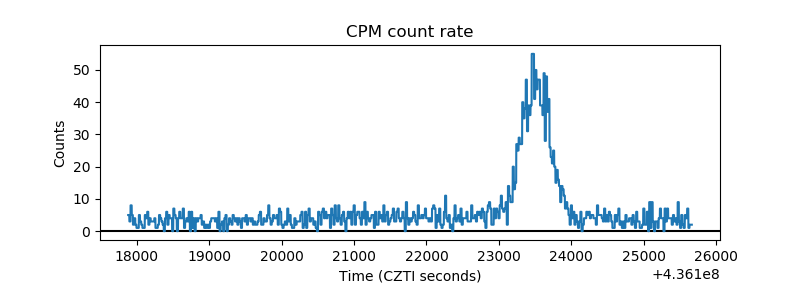 |
| CZT Counter | 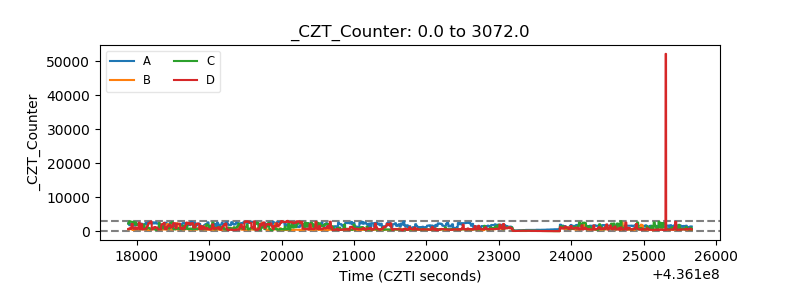 |
| +2.5 Volts monitor | 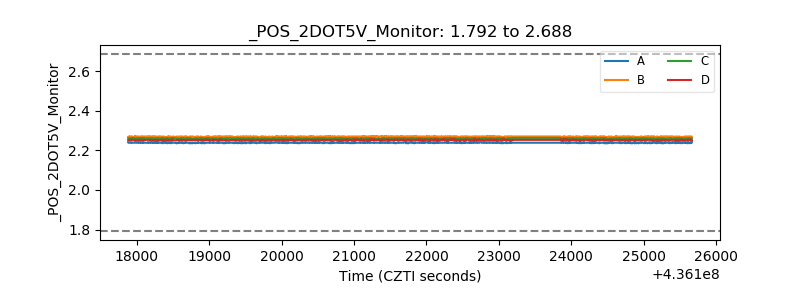 |
| +5 Volts monitor | 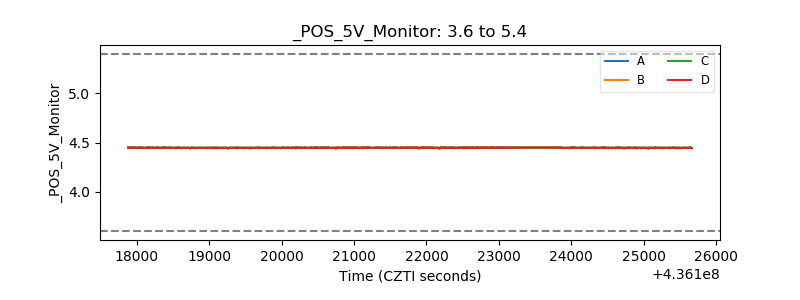 |
| _ROLL_ROT | 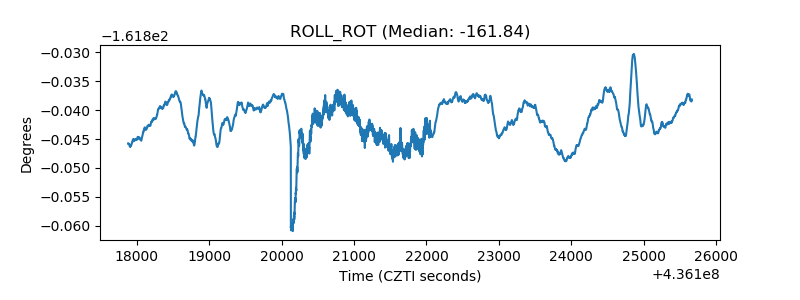 |
| _Roll_DEC | 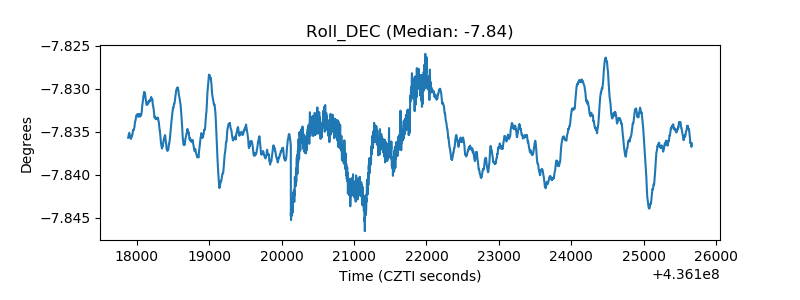 |
| _Roll_RA | 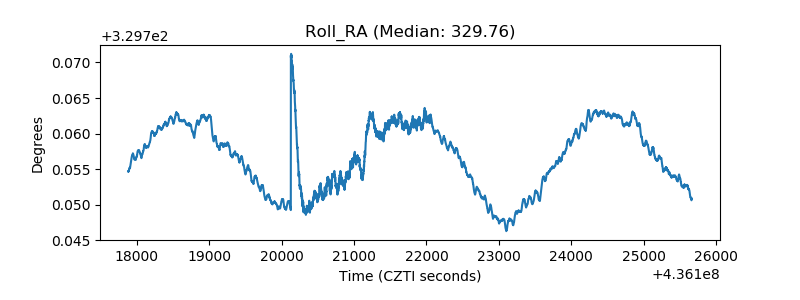 |
| Veto Counter |  |