| Param | Original file | Final file |
|---|---|---|
| Filename | modeM0/AS1A13_008T01_9000005898_43695cztM0_level2.fits | modeM0/AS1A13_008T01_9000005898_43695cztM0_level2_quad_clean.evt |
| Size (bytes) | 250,151,040 | 37,514,880 |
| Size | 238.6 MB | 35.8 MB |
| Events in quadrant A | 3,369,818 | 242,856 |
| Events in quadrant B | 1,493,707 | 261,312 |
| Events in quadrant C | 2,580,686 | 224,822 |
| Events in quadrant D | 1,630,653 | 236,559 |
| Mode SS | |||
|---|---|---|---|
| Quadrant | BADHDUFLAG | Total packets | Discarded packets |
| A | 0 | 48 | 0 |
| B | 0 | 48 | 0 |
| C | 0 | 48 | 0 |
| D | 0 | 48 | 0 |
| Mode M0 | |||
|---|---|---|---|
| Quadrant | BADHDUFLAG | Total packets | Discarded packets |
| A | 0 | 11663 | 1 |
| B | 0 | 6073 | 1 |
| C | 0 | 9341 | 1 |
| D | 0 | 6477 | 1 |
| Quadrant | Total seconds | Saturated seconds | Saturation percentage |
|---|---|---|---|
| A | 2363 | 264 | 11.172239% |
| B | 2364 | 106 | 4.483926% |
| C | 2364 | 447 | 18.908629% |
| D | 2364 | 90 | 3.807107% |
Noise dominated data is calculated using 1-second bins in cleaned event files. If a bin has >2000 counts, and if more than 50% of those come from <1% of pixels, then it is considered to be noise-dominated and hence unusable.
| Quadrant | # 1 sec bins | Bins with >0 counts | Bins with >2000 counts | High rate bins dominated by noise | Noise dominated (total time) | Noise dominated (detector-on time) | Marked lightcurve |
|---|---|---|---|---|---|---|---|
| A | 2363 | 2363 | 14 | 14 | 0.59% | 0.59% |  |
| B | 2364 | 2364 | 45 | 45 | 1.90% | 1.90% |  |
| C | 2364 | 2364 | 303 | 303 | 12.82% | 12.82% |  |
| D | 2364 | 2364 | 56 | 56 | 2.37% | 2.37% |  |
Top three noisy pixels from each quadrant. If the there are fewer than three noisy pixels in the level2.evt file, extra rows are filled as -1
| Pixel properties | Quadrant properties | ||||||
|---|---|---|---|---|---|---|---|
| Quadrant | DetID | PixID | Counts | Sigma | Mean | Median | Sigma |
| A | 15 | 222 | 1814328 | 32374.68 | 263 | 258 | 56.0 |
| A | 10 | 83 | 356930 | 6365.32 | 263 | 258 | 56.0 |
| A | 14 | 63 | 130445 | 2323.37 | 263 | 258 | 56.0 |
| B | 5 | 235 | 207699 | 3814.21 | 266 | 258 | 54.4 |
| B | 4 | 206 | 75852 | 1389.94 | 266 | 258 | 54.4 |
| B | 5 | 255 | 58409 | 1069.22 | 266 | 258 | 54.4 |
| C | 15 | 157 | 1289324 | 22123.02 | 240 | 242 | 58.3 |
| C | 3 | 233 | 294347 | 5047.38 | 240 | 242 | 58.3 |
| C | 15 | 174 | 14311 | 241.45 | 240 | 242 | 58.3 |
| D | 13 | 171 | 138561 | 2002.76 | 263 | 255 | 69.1 |
| D | 5 | 235 | 82543 | 1191.58 | 263 | 255 | 69.1 |
| D | 2 | 136 | 63174 | 911.11 | 263 | 255 | 69.1 |
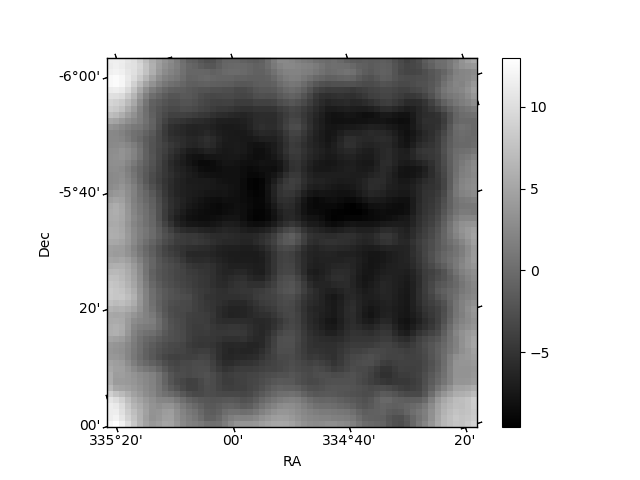
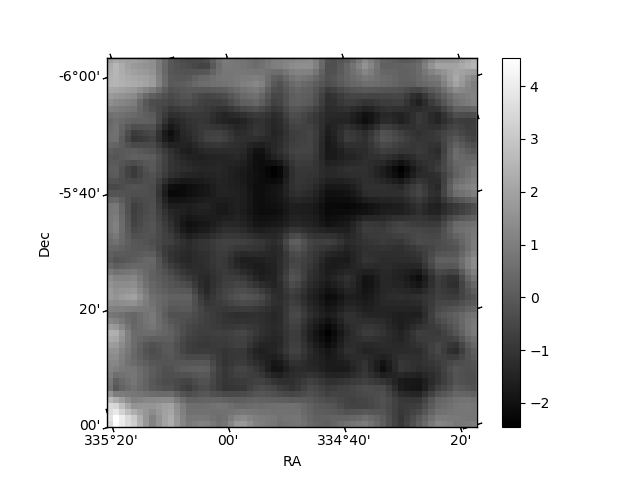
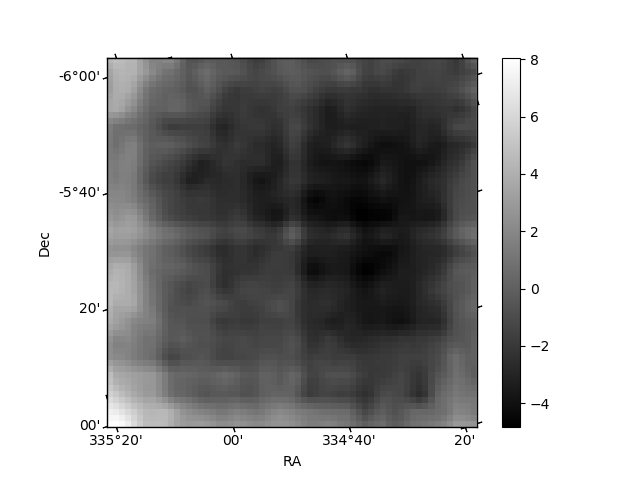
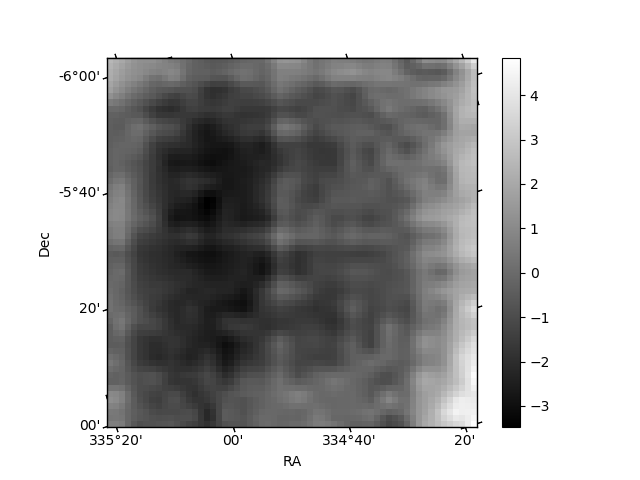
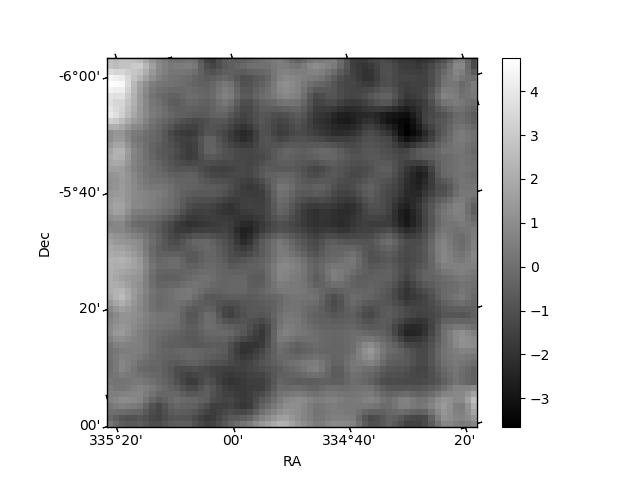
Histogram calculated using DETX and DETY for each event in the final _common_clean file
| Quadrant A | 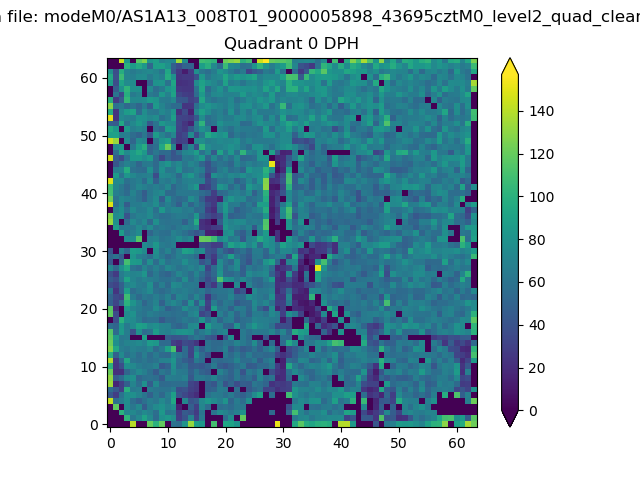 |
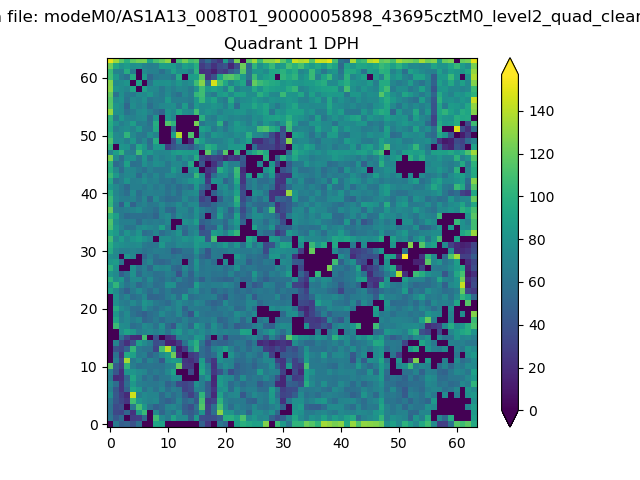 |
Quadrant B |
|---|---|---|---|
| Quadrant D | 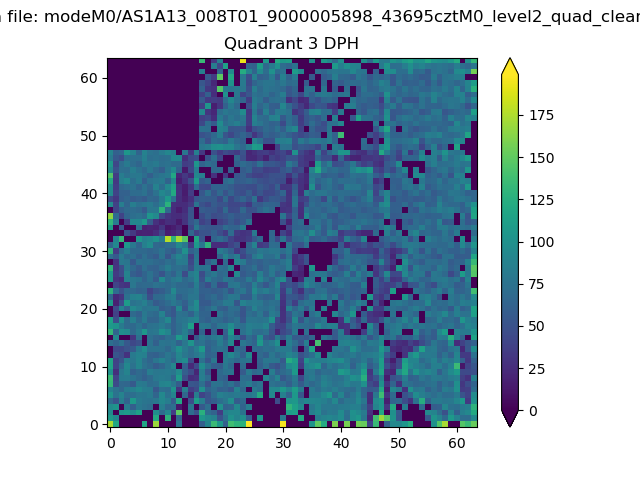 |
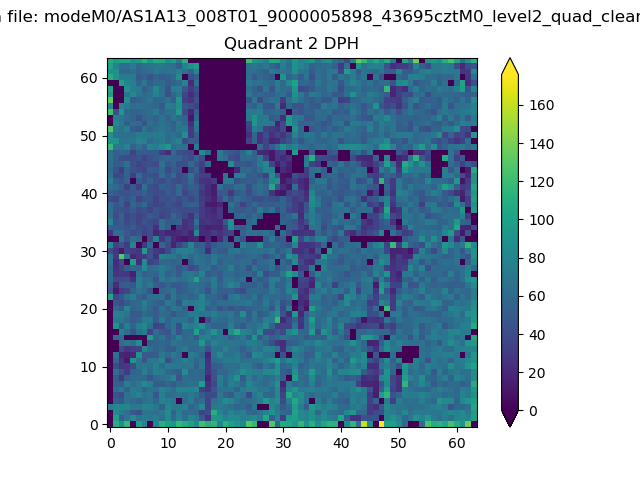 |
Quadrant C |
| Plot type | Count rate plots | Images |
|---|---|---|
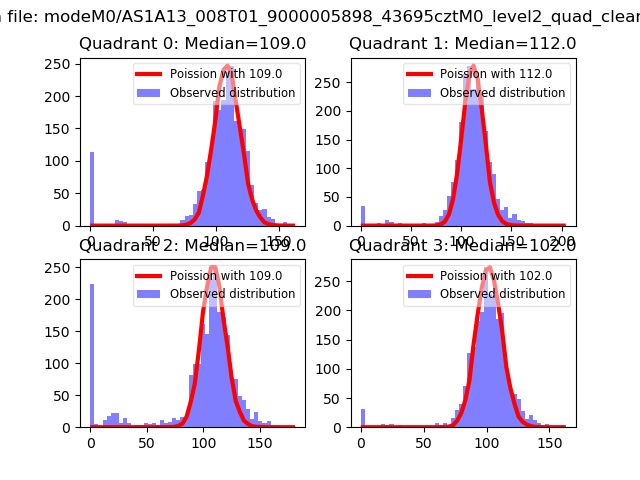
| Comparison with Poisson distribution Blue bars denote a histogram of data divided into 1 sec bins. Red curve is a Poisson curve with rate = median count rate of data. |
 |
 |
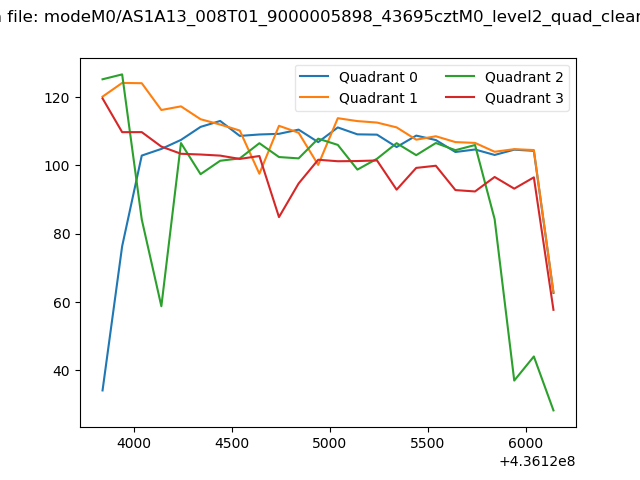
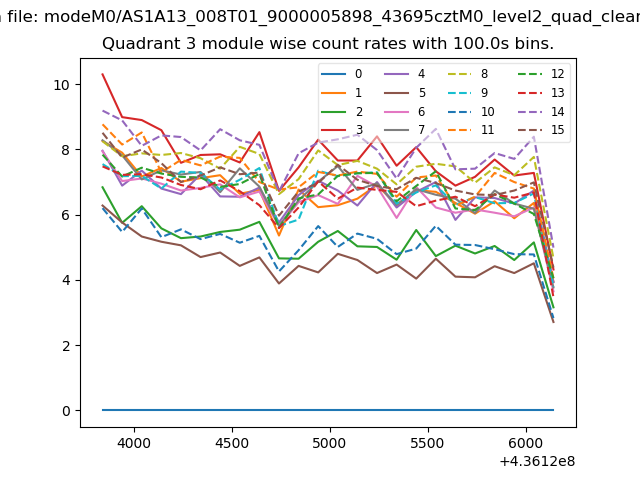
| Quadrant-wise count rates Data is divided into 100 sec bins |
 |
|
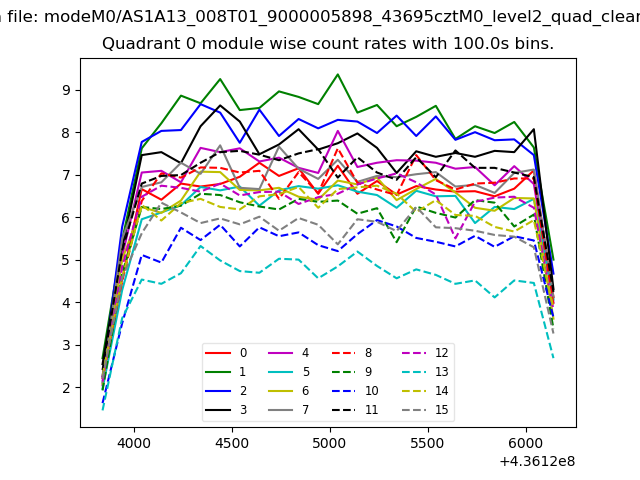
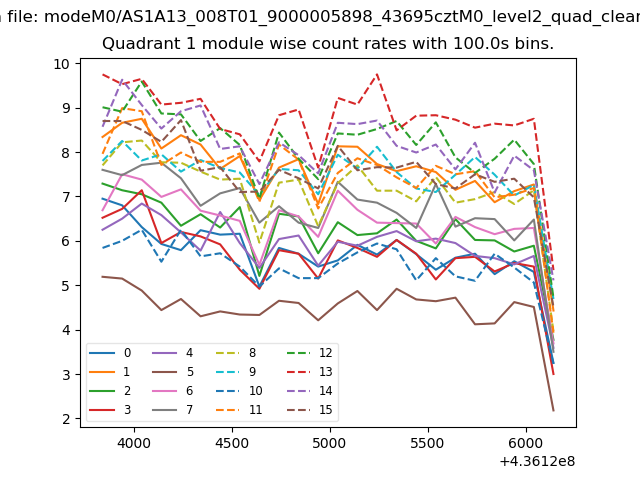
| Module-wise count rates for Quadrant A Data is divided into 100 sec bins |
 |
 |
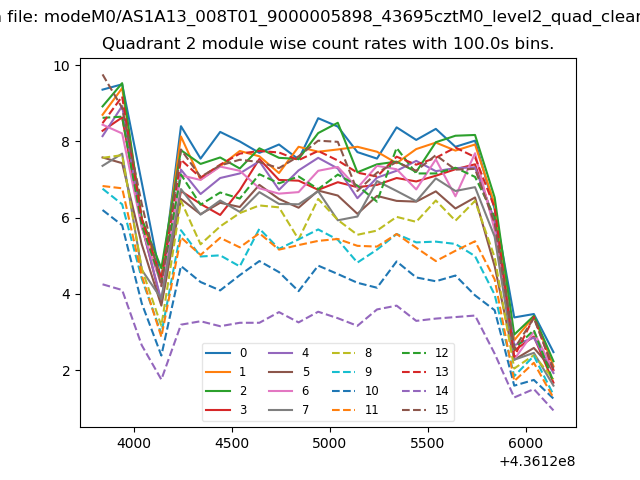
| Module-wise count rates for Quadrant B Data is divided into 100 sec bins |
 |
 |
| Module-wise count rates for Quadrant C Data is divided into 100 sec bins |
 |
 |
| Module-wise count rates for Quadrant D Data is divided into 100 sec bins |
 |
 |
| Parameter | Plot |
|---|---|
| CZT HV Monitor | 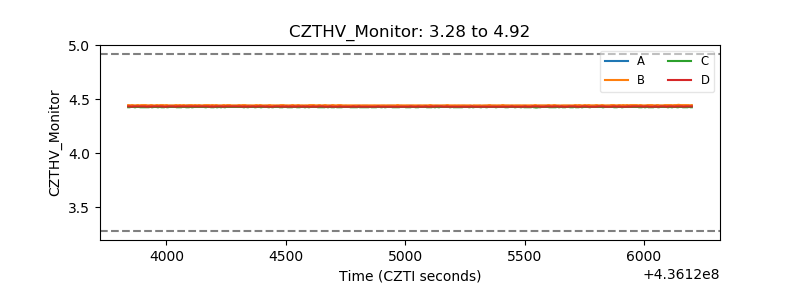 |
| D_VDD | 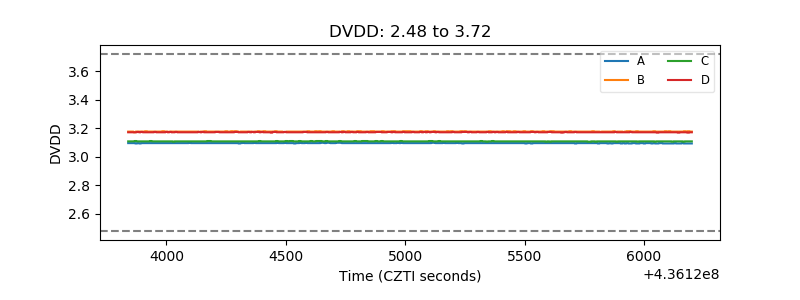 |
| Temperature 1 | 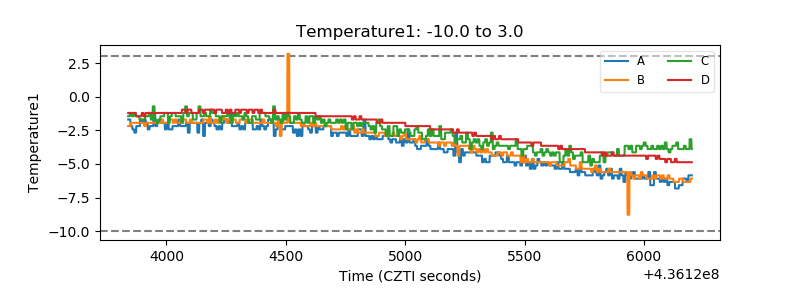 |
| Veto HV Monitor | 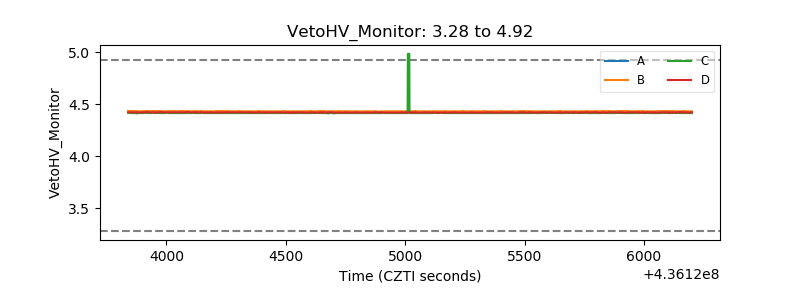 |
| Veto LLD | 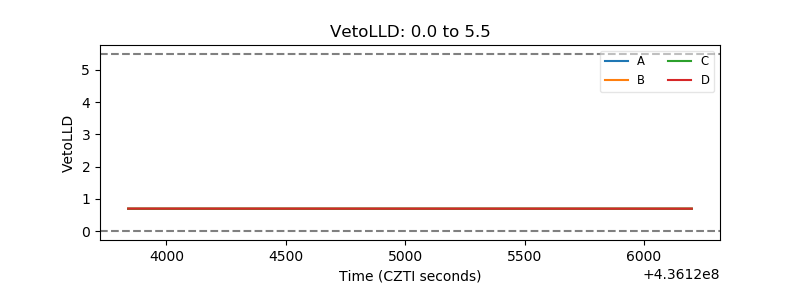 |
| Alpha Counter | 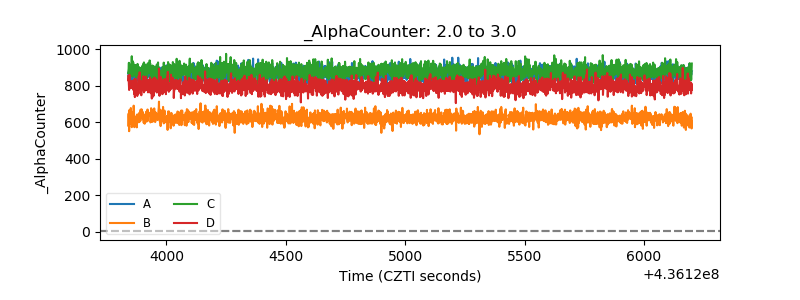 |
| _CPM_Rate | 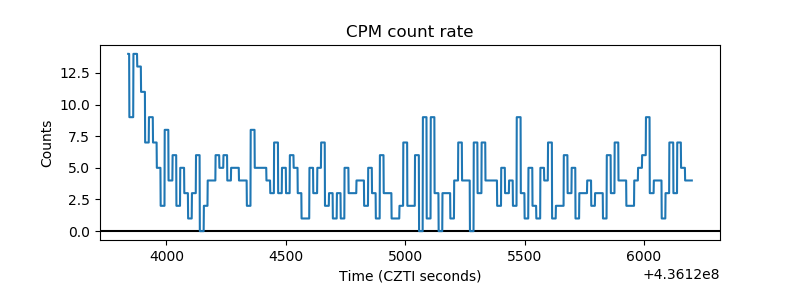 |
| CZT Counter | 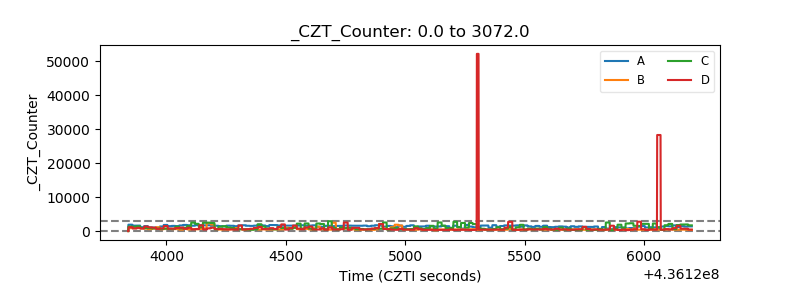 |
| +2.5 Volts monitor |  |
| +5 Volts monitor | 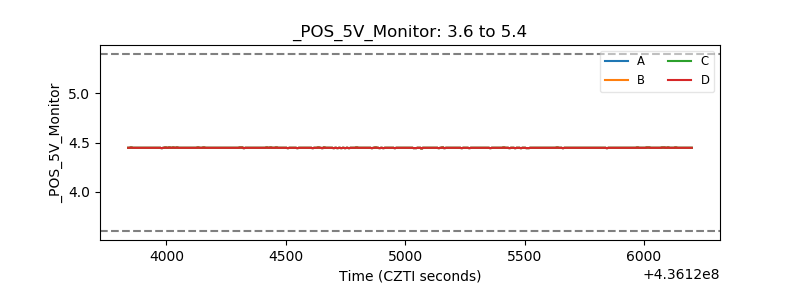 |
| _ROLL_ROT | 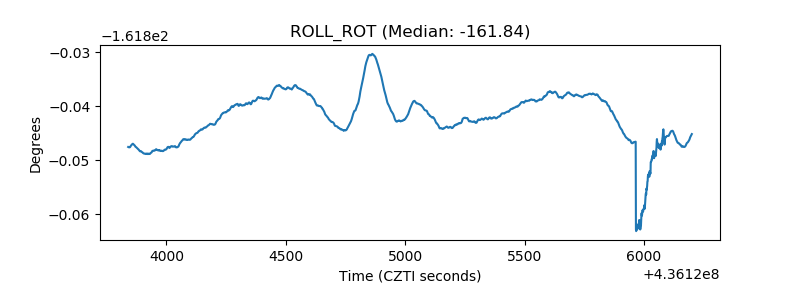 |
| _Roll_DEC | 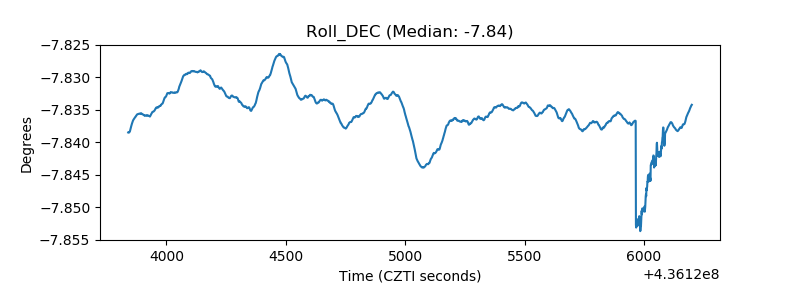 |
| _Roll_RA | 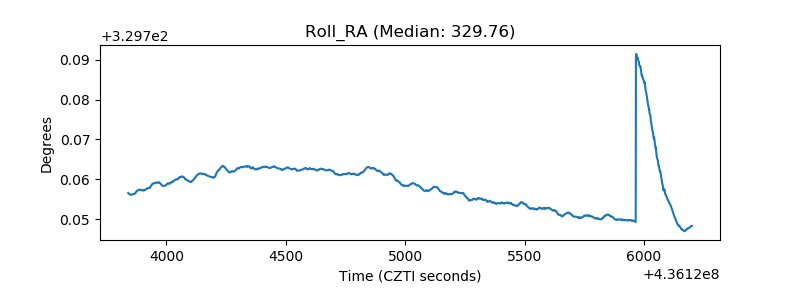 |
| Veto Counter | 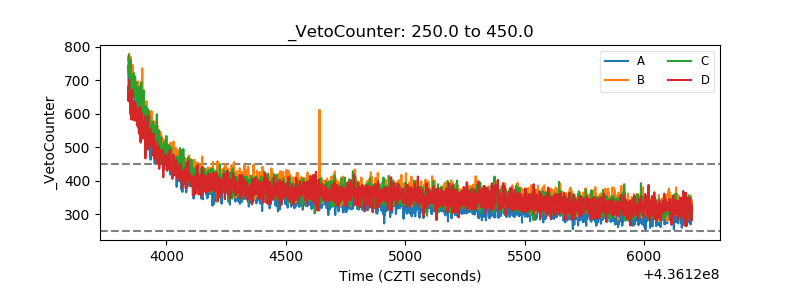 |