| Param | Original file | Final file |
|---|---|---|
| Filename | modeM0/AS1A13_008T02_9000005900_43695cztM0_level2.fits | modeM0/AS1A13_008T02_9000005900_43695cztM0_level2_quad_clean.evt |
| Size (bytes) | 496,532,160 | 83,093,760 |
| Size | 473.5 MB | 79.2 MB |
| Events in quadrant A | 6,856,962 | 548,372 |
| Events in quadrant B | 3,130,939 | 574,681 |
| Events in quadrant C | 3,103,440 | 556,018 |
| Events in quadrant D | 4,897,217 | 481,676 |
| Mode M0 | |||
|---|---|---|---|
| Quadrant | BADHDUFLAG | Total packets | Discarded packets |
| A | 0 | 23959 | 3 |
| B | 0 | 12627 | 2 |
| C | 0 | 12574 | 2 |
| D | 0 | 18015 | 2 |
| Mode SS | |||
|---|---|---|---|
| Quadrant | BADHDUFLAG | Total packets | Discarded packets |
| A | 0 | 104 | 0 |
| B | 0 | 104 | 0 |
| C | 0 | 104 | 0 |
| D | 0 | 104 | 0 |
| Quadrant | Total seconds | Saturated seconds | Saturation percentage |
|---|---|---|---|
| A | 5045 | 844 | 16.729435% |
| B | 5045 | 254 | 5.034688% |
| C | 5045 | 177 | 3.508424% |
| D | 5045 | 889 | 17.621407% |
Noise dominated data is calculated using 1-second bins in cleaned event files. If a bin has >2000 counts, and if more than 50% of those come from <1% of pixels, then it is considered to be noise-dominated and hence unusable.
| Quadrant | # 1 sec bins | Bins with >0 counts | Bins with >2000 counts | High rate bins dominated by noise | Noise dominated (total time) | Noise dominated (detector-on time) | Marked lightcurve |
|---|---|---|---|---|---|---|---|
| A | 5140 | 5047 | 129 | 129 | 2.51% | 2.56% | 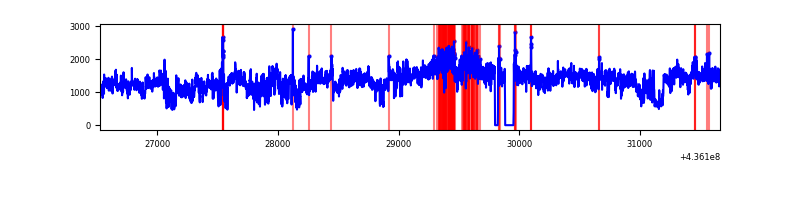 |
| B | 5140 | 5047 | 85 | 85 | 1.65% | 1.68% | 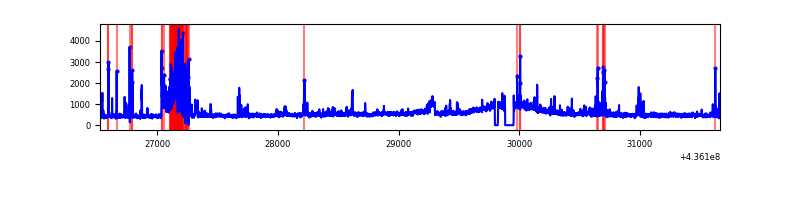 |
| C | 5140 | 5047 | 78 | 78 | 1.52% | 1.55% | 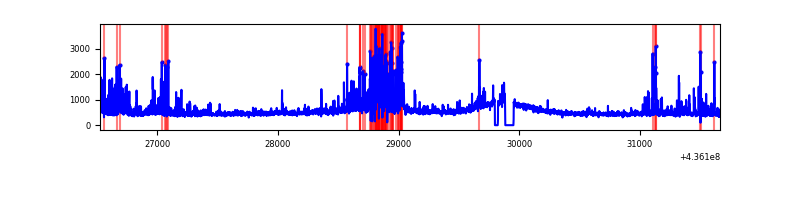 |
| D | 5140 | 5047 | 319 | 319 | 6.21% | 6.32% | 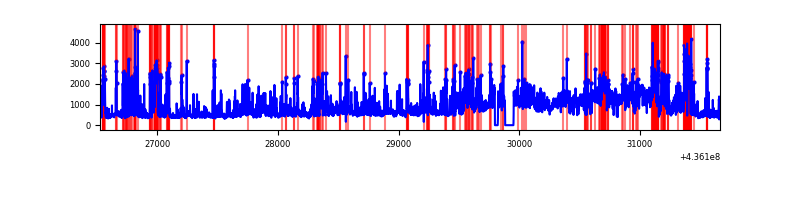 |
Top three noisy pixels from each quadrant. If the there are fewer than three noisy pixels in the level2.evt file, extra rows are filled as -1
| Pixel properties | Quadrant properties | ||||||
|---|---|---|---|---|---|---|---|
| Quadrant | DetID | PixID | Counts | Sigma | Mean | Median | Sigma |
| A | 15 | 222 | 3258726 | 26240.61 | 591 | 579 | 124.2 |
| A | 10 | 83 | 556369 | 4476.25 | 591 | 579 | 124.2 |
| A | 15 | 223 | 511448 | 4114.46 | 591 | 579 | 124.2 |
| B | 4 | 171 | 426244 | 3500.27 | 607 | 588 | 121.6 |
| B | 5 | 235 | 143168 | 1172.47 | 607 | 588 | 121.6 |
| B | 4 | 206 | 85384 | 697.3 | 607 | 588 | 121.6 |
| C | 15 | 157 | 464629 | 3271.81 | 596 | 599 | 141.8 |
| C | 3 | 233 | 130512 | 916.0 | 596 | 599 | 141.8 |
| C | 15 | 174 | 107596 | 754.42 | 596 | 599 | 141.8 |
| D | 1 | 20 | 710690 | 4449.1 | 564 | 550 | 159.6 |
| D | 13 | 249 | 303684 | 1899.17 | 564 | 550 | 159.6 |
| D | 5 | 235 | 259434 | 1621.94 | 564 | 550 | 159.6 |
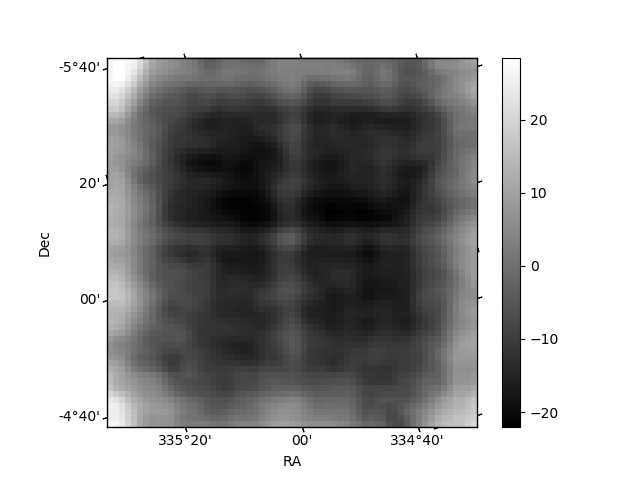
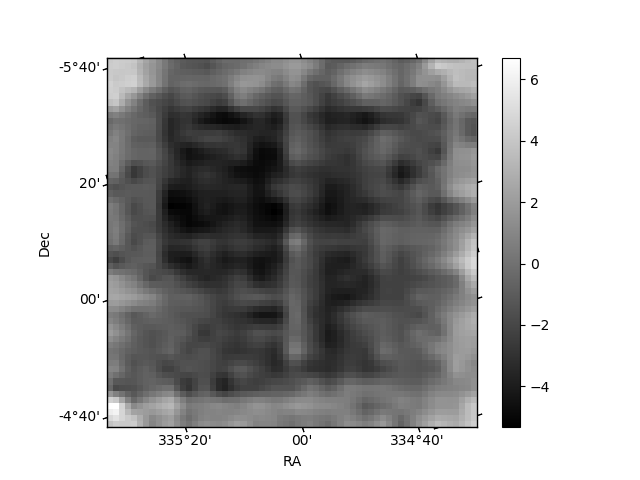
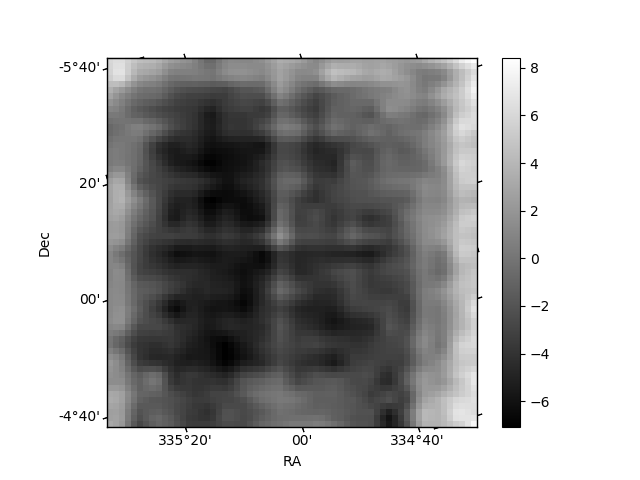
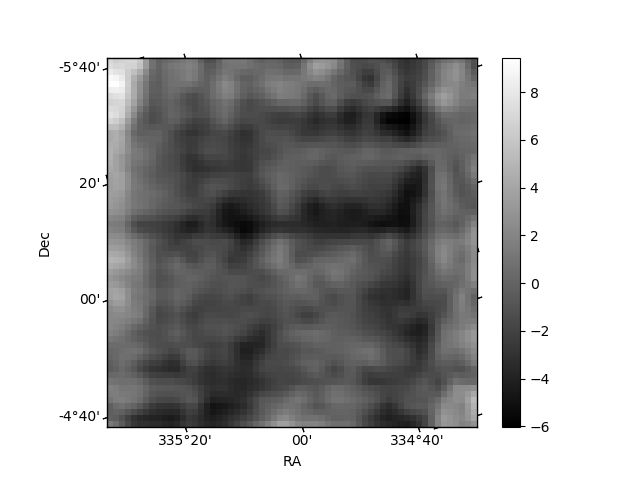
Histogram calculated using DETX and DETY for each event in the final _common_clean file
| Quadrant A | 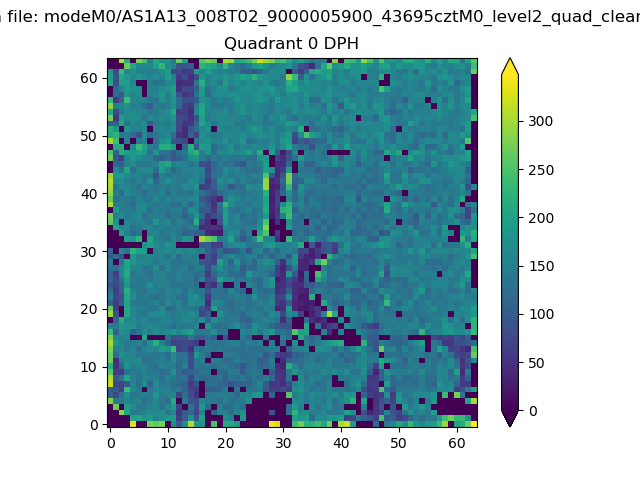 |
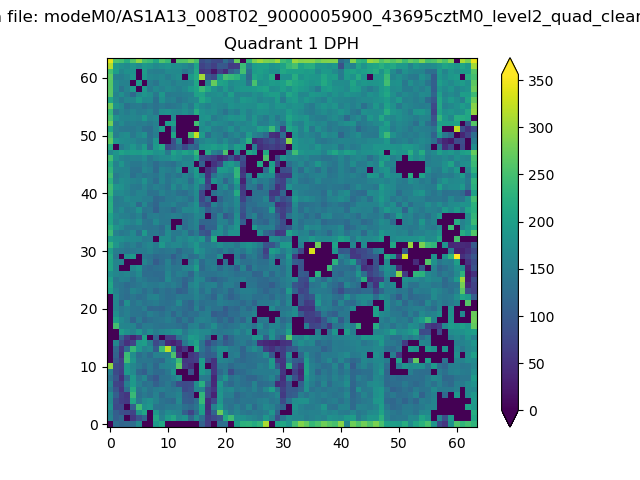 |
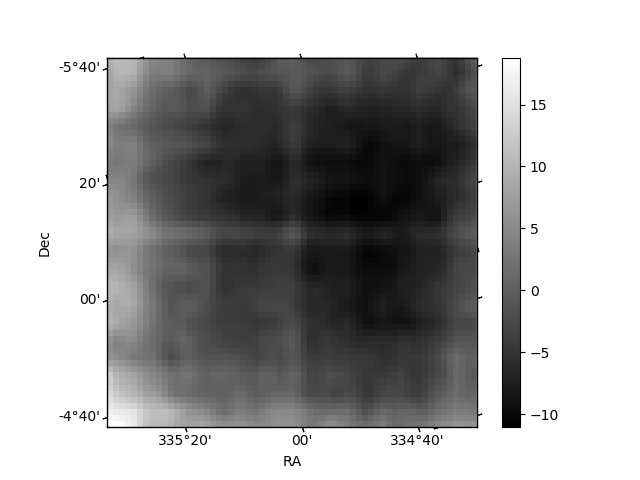
Quadrant B |
|---|---|---|---|
| Quadrant D | 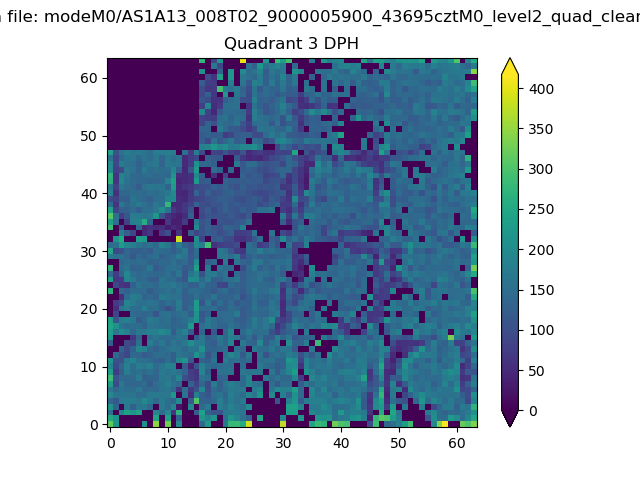 |
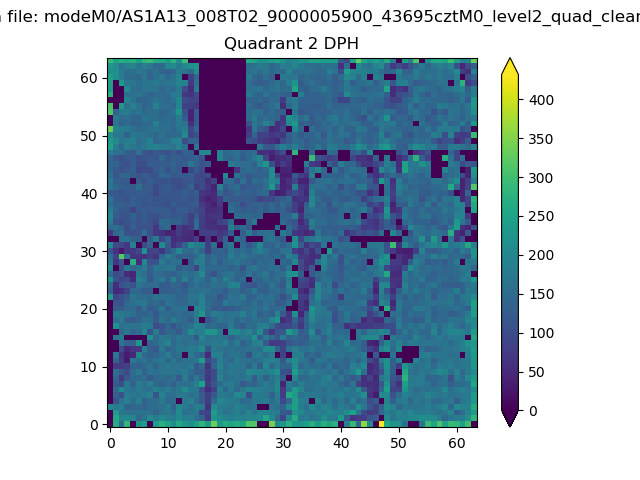 |
Quadrant C |
| Plot type | Count rate plots | Images |
|---|---|---|
| Comparison with Poisson distribution Blue bars denote a histogram of data divided into 1 sec bins. Red curve is a Poisson curve with rate = median count rate of data. |
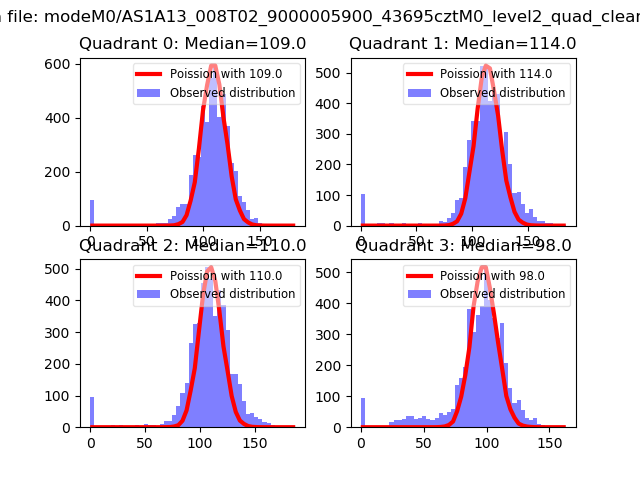 |
 |
| Quadrant-wise count rates Data is divided into 100 sec bins |
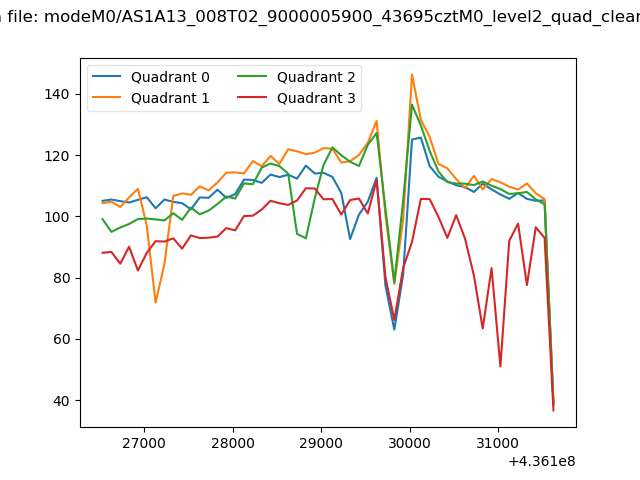 |
|
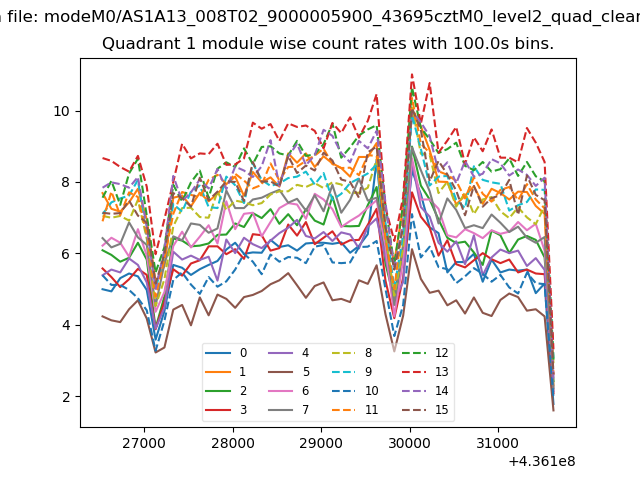
| Module-wise count rates for Quadrant A Data is divided into 100 sec bins |
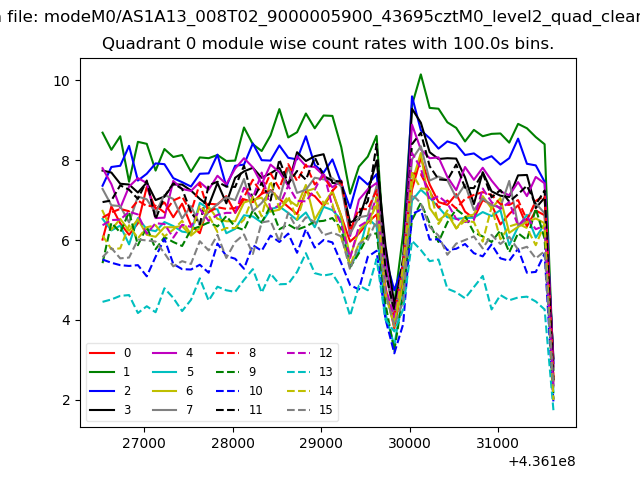 |
 |
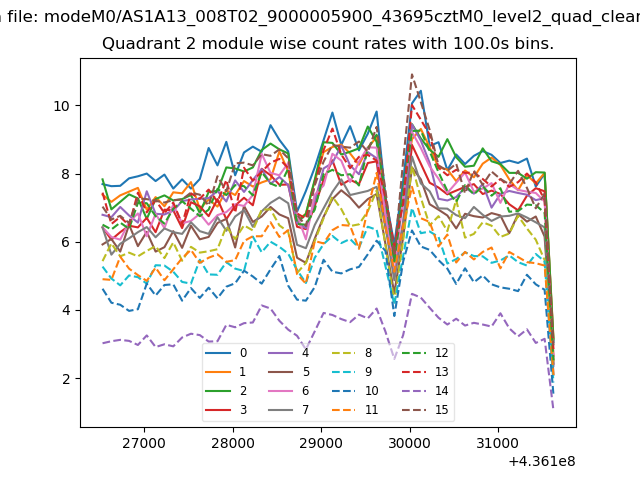
| Module-wise count rates for Quadrant B Data is divided into 100 sec bins |
 |
 |
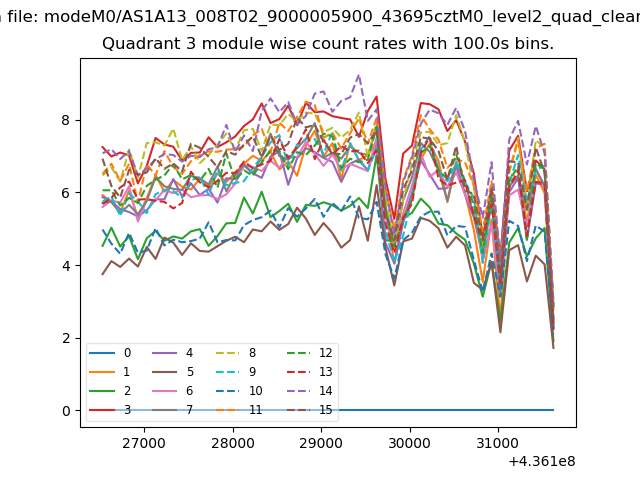
| Module-wise count rates for Quadrant C Data is divided into 100 sec bins |
 |
 |
| Module-wise count rates for Quadrant D Data is divided into 100 sec bins |
 |
 |
| Parameter | Plot |
|---|---|
| CZT HV Monitor | 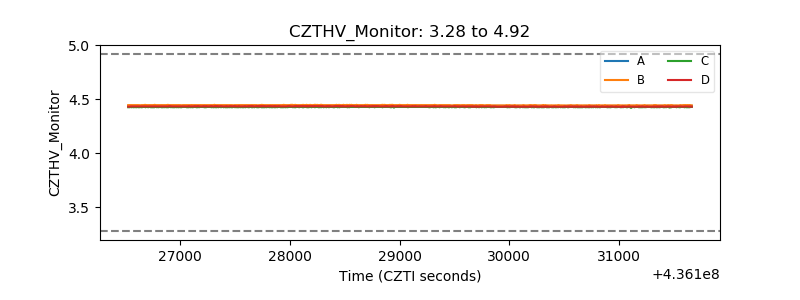 |
| D_VDD | 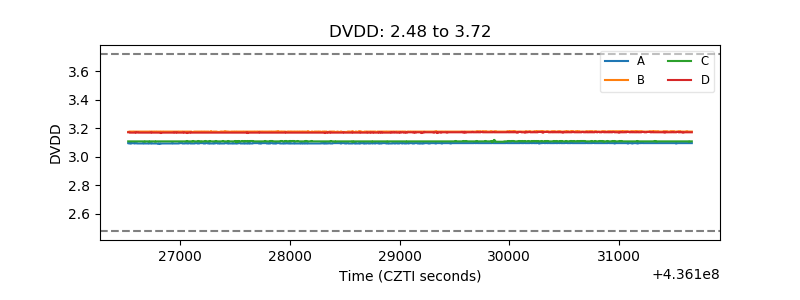 |
| Temperature 1 | 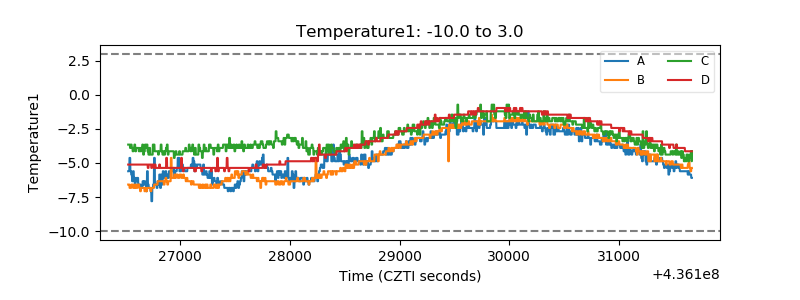 |
| Veto HV Monitor | 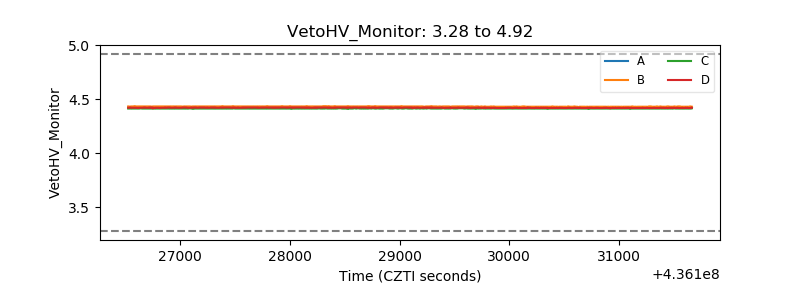 |
| Veto LLD | 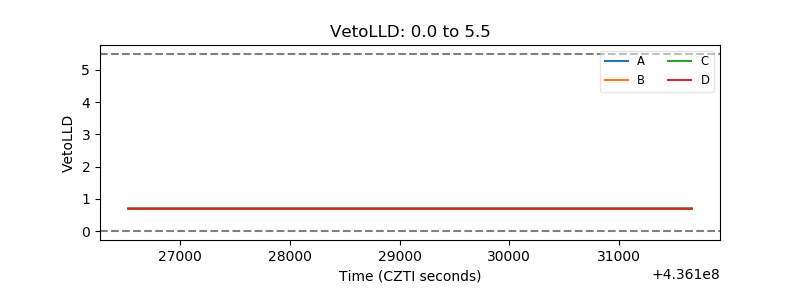 |
| Alpha Counter | 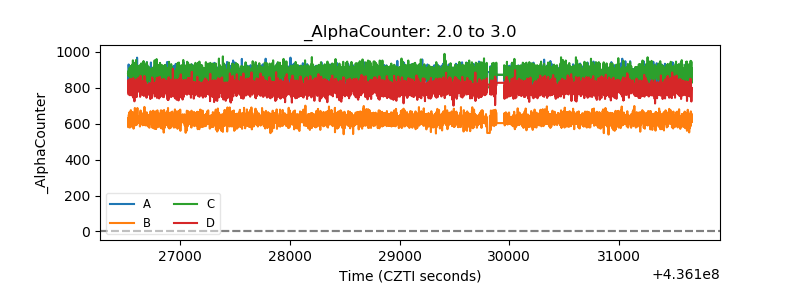 |
| _CPM_Rate | 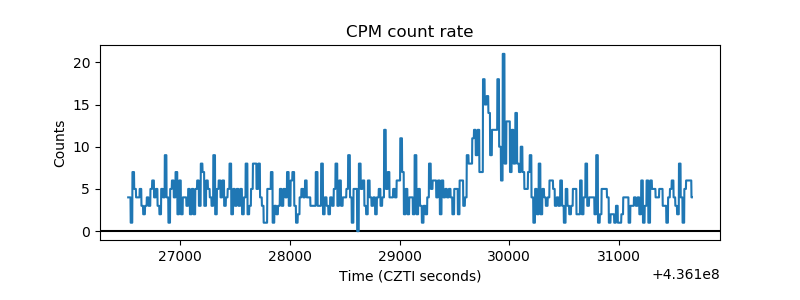 |
| CZT Counter | 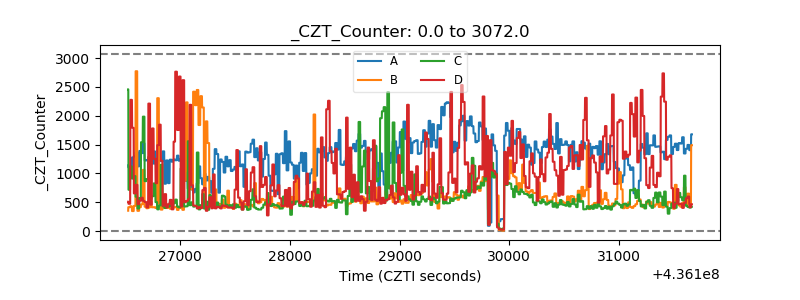 |
| +2.5 Volts monitor | 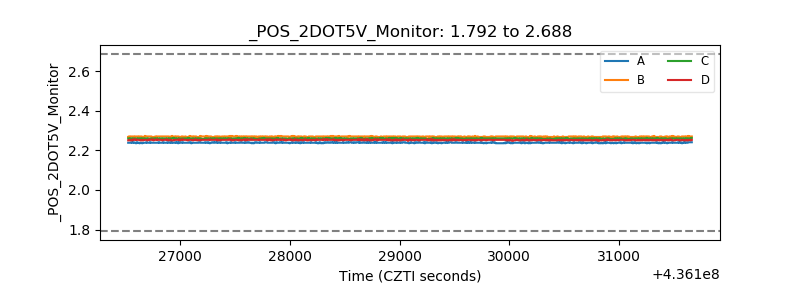 |
| +5 Volts monitor | 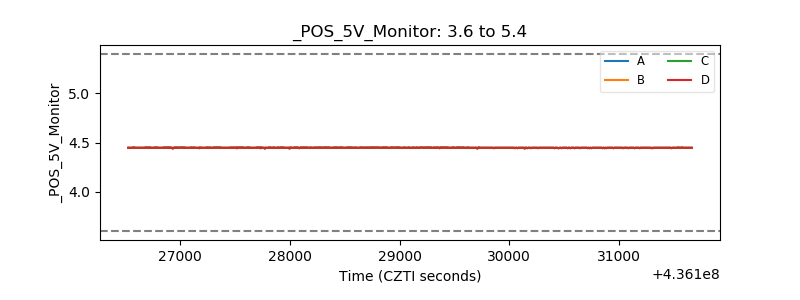 |
| _ROLL_ROT | 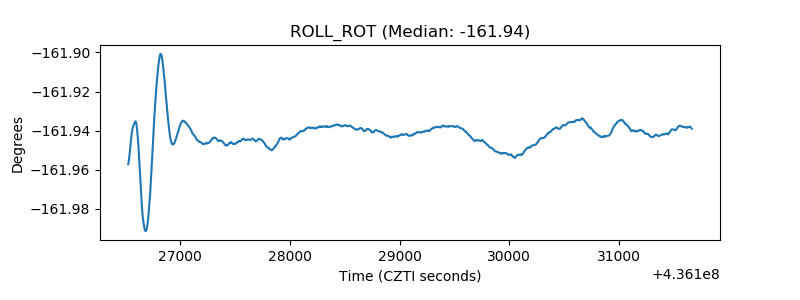 |
| _Roll_DEC | 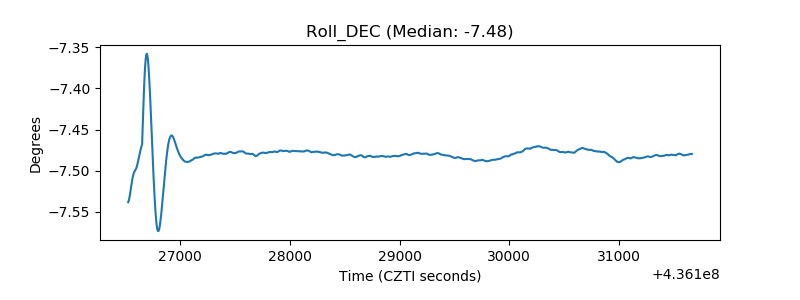 |
| _Roll_RA | 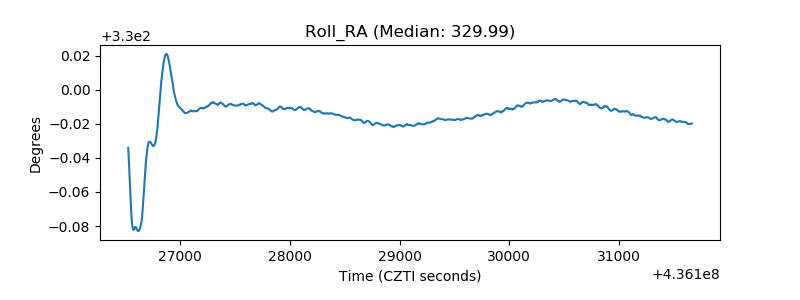 |
| Veto Counter | 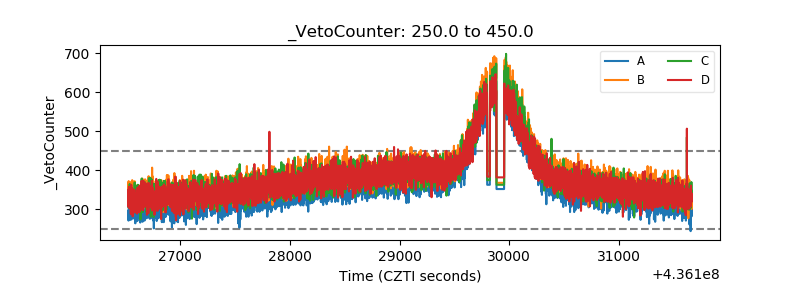 |