| Param | Original file | Final file |
|---|---|---|
| Filename | modeM0/AS1A13_008T02_9000005900_43696cztM0_level2.fits | modeM0/AS1A13_008T02_9000005900_43696cztM0_level2_quad_clean.evt |
| Size (bytes) | 784,494,720 | 129,911,040 |
| Size | 748.2 MB | 123.9 MB |
| Events in quadrant A | 11,489,068 | 857,082 |
| Events in quadrant B | 4,650,999 | 897,524 |
| Events in quadrant C | 4,653,777 | 868,011 |
| Events in quadrant D | 7,625,152 | 751,310 |
| Mode M0 | |||
|---|---|---|---|
| Quadrant | BADHDUFLAG | Total packets | Discarded packets |
| A | 0 | 39821 | 1 |
| B | 0 | 19096 | 1 |
| C | 0 | 19317 | 2 |
| D | 0 | 28225 | 1 |
| Mode SS | |||
|---|---|---|---|
| Quadrant | BADHDUFLAG | Total packets | Discarded packets |
| A | 0 | 162 | 0 |
| B | 0 | 162 | 0 |
| C | 0 | 162 | 0 |
| D | 0 | 162 | 0 |
| Quadrant | Total seconds | Saturated seconds | Saturation percentage |
|---|---|---|---|
| A | 8030 | 1140 | 14.196762% |
| B | 8030 | 195 | 2.428394% |
| C | 8029 | 213 | 2.652883% |
| D | 8030 | 1248 | 15.541719% |
Noise dominated data is calculated using 1-second bins in cleaned event files. If a bin has >2000 counts, and if more than 50% of those come from <1% of pixels, then it is considered to be noise-dominated and hence unusable.
| Quadrant | # 1 sec bins | Bins with >0 counts | Bins with >2000 counts | High rate bins dominated by noise | Noise dominated (total time) | Noise dominated (detector-on time) | Marked lightcurve |
|---|---|---|---|---|---|---|---|
| A | 8100 | 8031 | 309 | 309 | 3.81% | 3.85% | 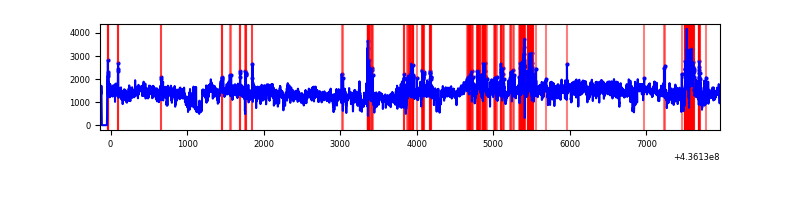 |
| B | 8100 | 8031 | 70 | 70 | 0.86% | 0.87% | 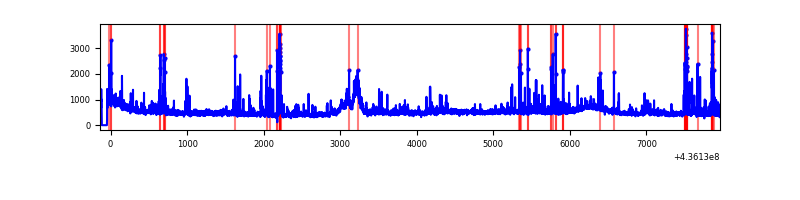 |
| C | 8099 | 8030 | 139 | 139 | 1.72% | 1.73% | 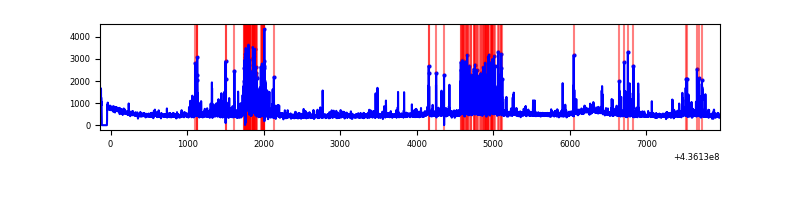 |
| D | 8100 | 8031 | 567 | 567 | 7.00% | 7.06% | 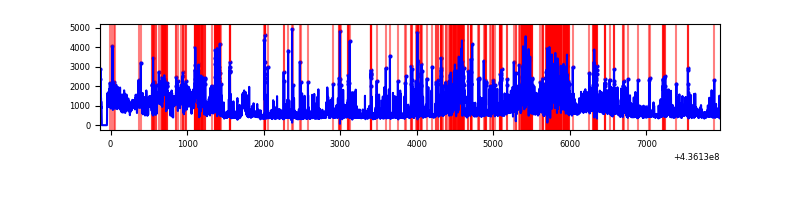 |
Top three noisy pixels from each quadrant. If the there are fewer than three noisy pixels in the level2.evt file, extra rows are filled as -1
| Pixel properties | Quadrant properties | ||||||
|---|---|---|---|---|---|---|---|
| Quadrant | DetID | PixID | Counts | Sigma | Mean | Median | Sigma |
| A | 15 | 222 | 5860464 | 31101.57 | 902 | 882 | 188.4 |
| A | 10 | 83 | 918165 | 4868.77 | 902 | 882 | 188.4 |
| A | 15 | 223 | 792678 | 4202.71 | 902 | 882 | 188.4 |
| B | 5 | 235 | 365001 | 1976.1 | 929 | 902 | 184.3 |
| B | 12 | 3 | 244864 | 1324.07 | 929 | 902 | 184.3 |
| B | 4 | 206 | 120483 | 649.01 | 929 | 902 | 184.3 |
| C | 15 | 157 | 845785 | 3953.82 | 905 | 912 | 213.7 |
| C | 15 | 173 | 71906 | 332.24 | 905 | 912 | 213.7 |
| C | 3 | 233 | 60980 | 281.1 | 905 | 912 | 213.7 |
| D | 1 | 20 | 722421 | 3057.12 | 856 | 834 | 236.0 |
| D | 2 | 249 | 465211 | 1967.41 | 856 | 834 | 236.0 |
| D | 1 | 47 | 426408 | 1803.02 | 856 | 834 | 236.0 |
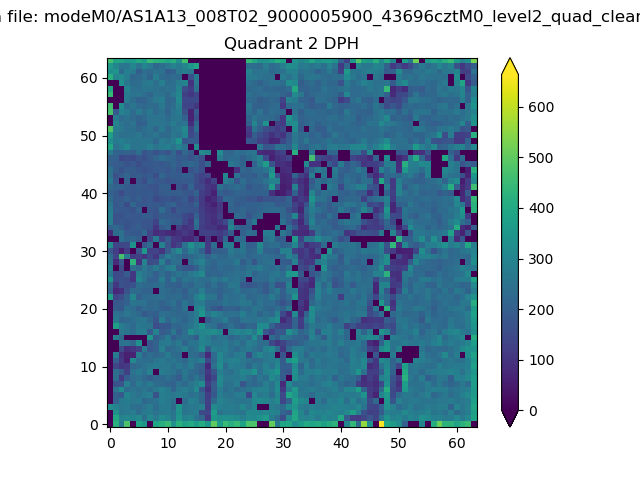
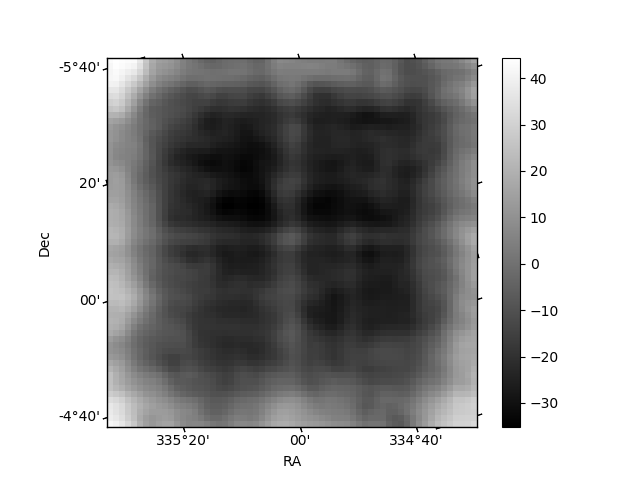
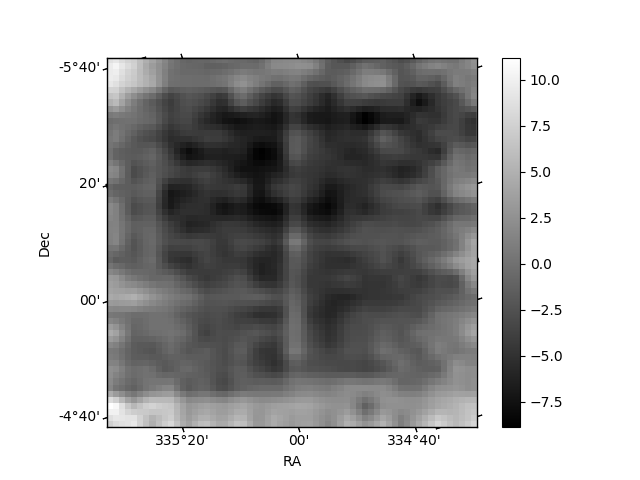
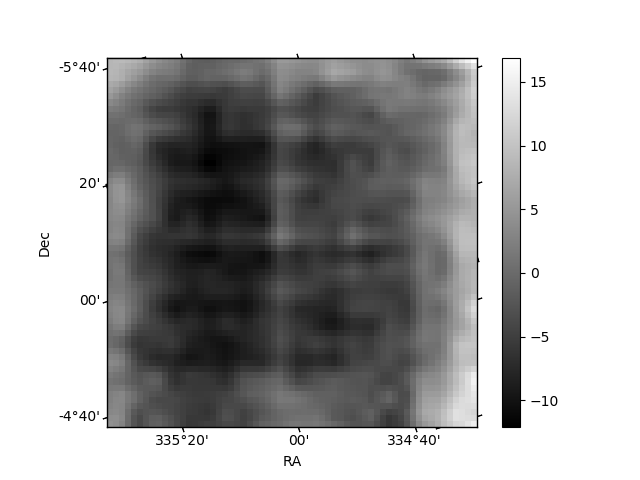
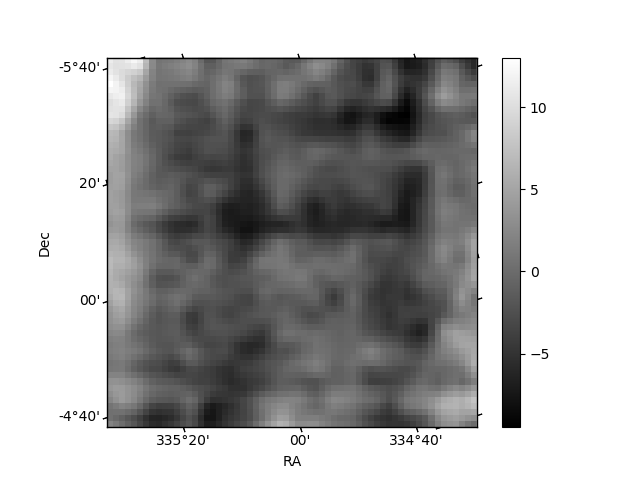
Histogram calculated using DETX and DETY for each event in the final _common_clean file
| Quadrant A | 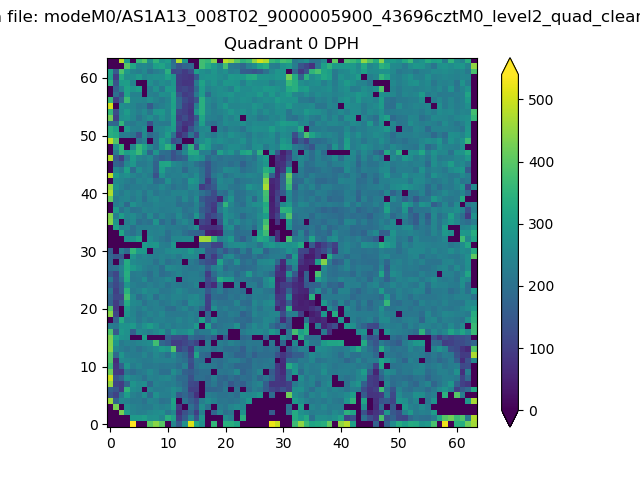 |
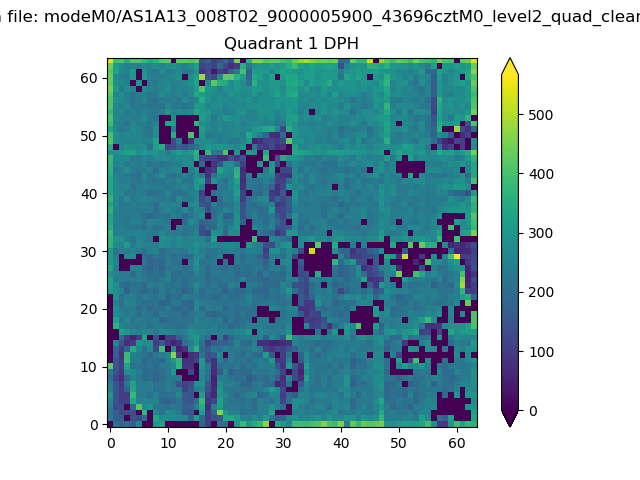 |
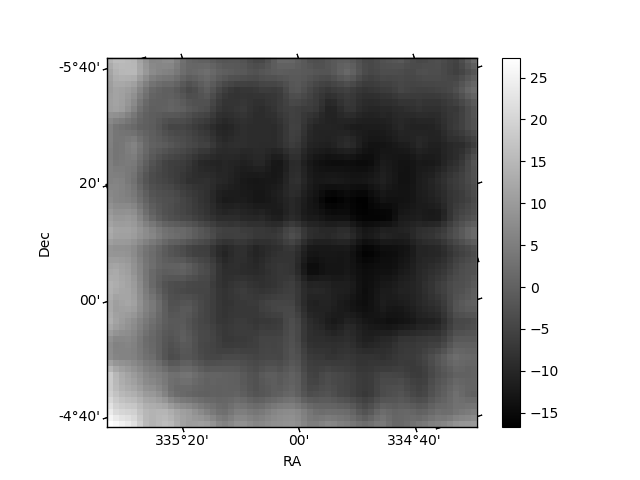
Quadrant B |
|---|---|---|---|
| Quadrant D | 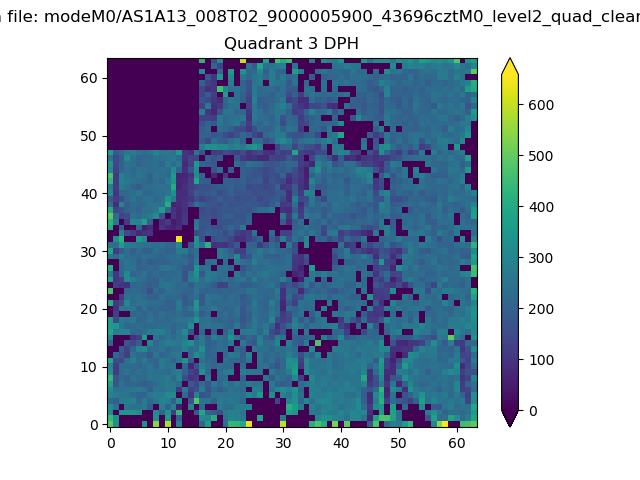 |
 |
Quadrant C |
| Plot type | Count rate plots | Images |
|---|---|---|
| Comparison with Poisson distribution Blue bars denote a histogram of data divided into 1 sec bins. Red curve is a Poisson curve with rate = median count rate of data. |
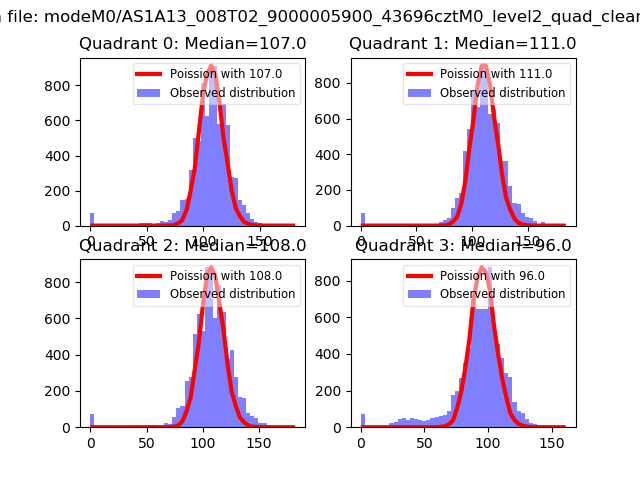 |
 |
| Quadrant-wise count rates Data is divided into 100 sec bins |
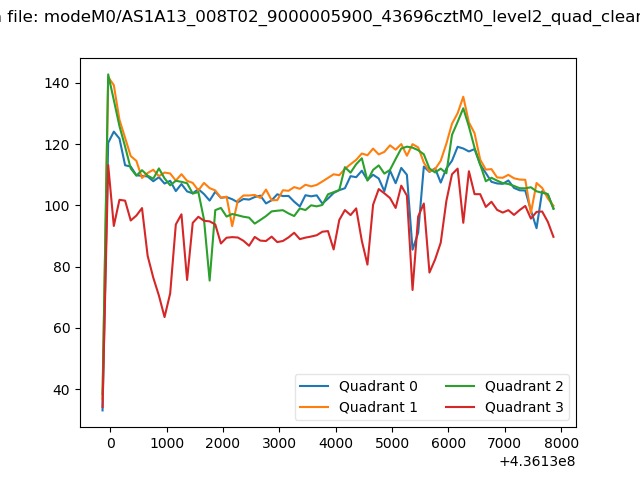 |
|
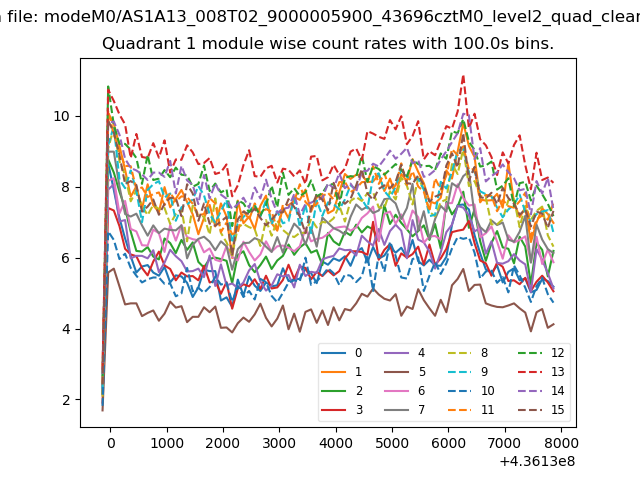
| Module-wise count rates for Quadrant A Data is divided into 100 sec bins |
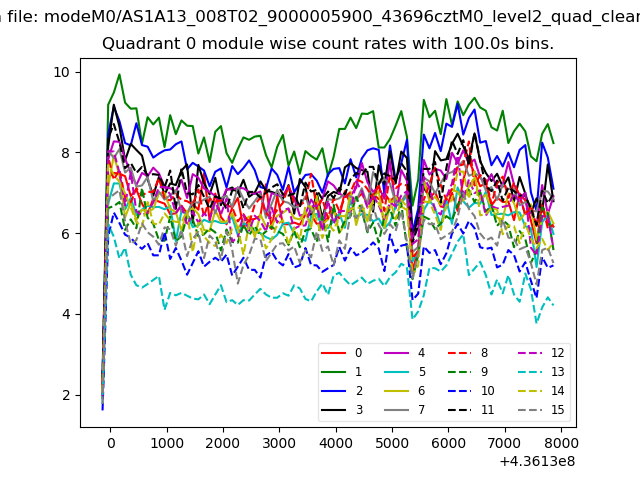 |
 |
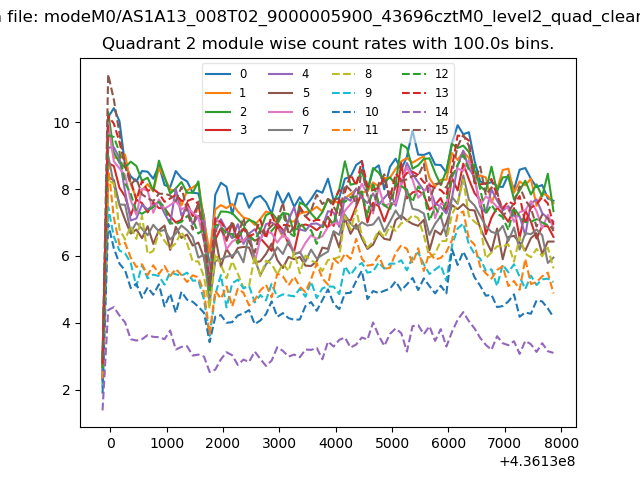
| Module-wise count rates for Quadrant B Data is divided into 100 sec bins |
 |
 |
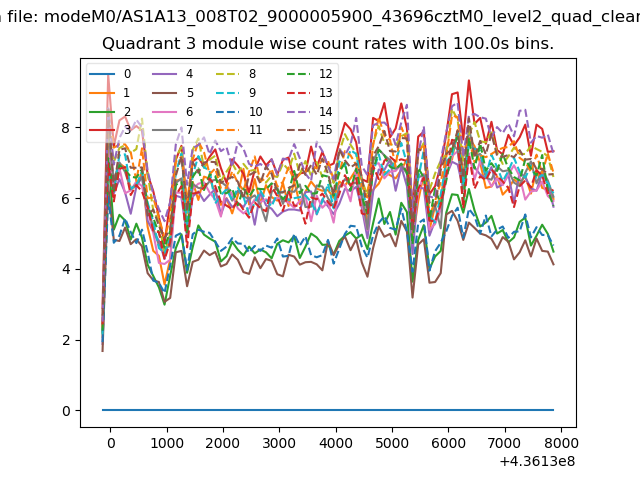
| Module-wise count rates for Quadrant C Data is divided into 100 sec bins |
 |
 |
| Module-wise count rates for Quadrant D Data is divided into 100 sec bins |
 |
 |
| Parameter | Plot |
|---|---|
| CZT HV Monitor | 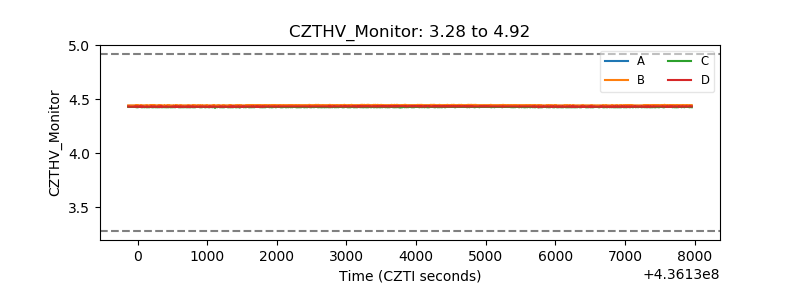 |
| D_VDD | 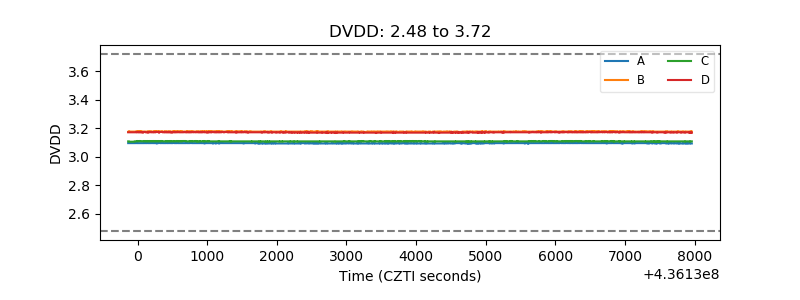 |
| Temperature 1 | 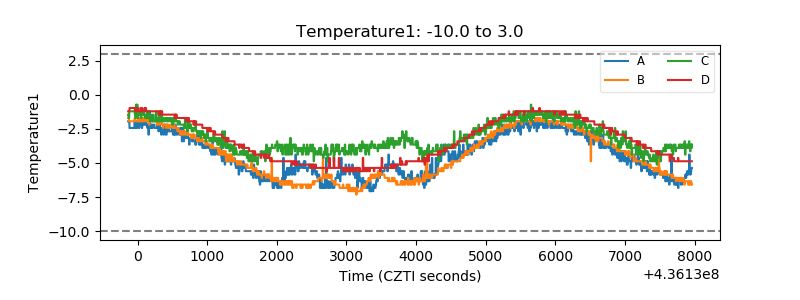 |
| Veto HV Monitor | 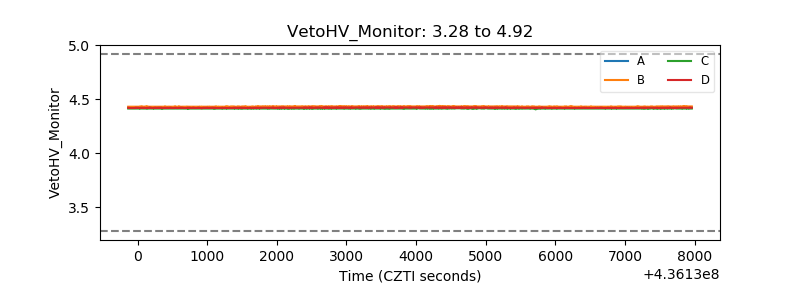 |
| Veto LLD | 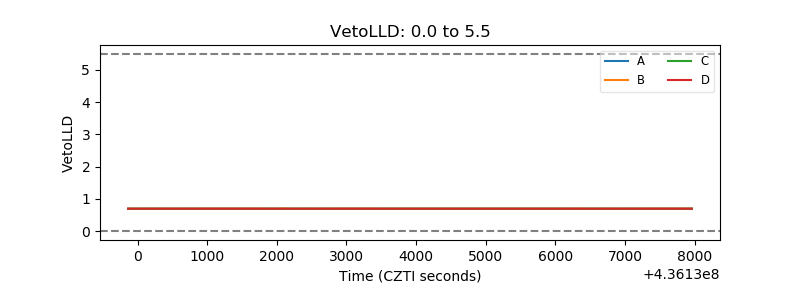 |
| Alpha Counter | 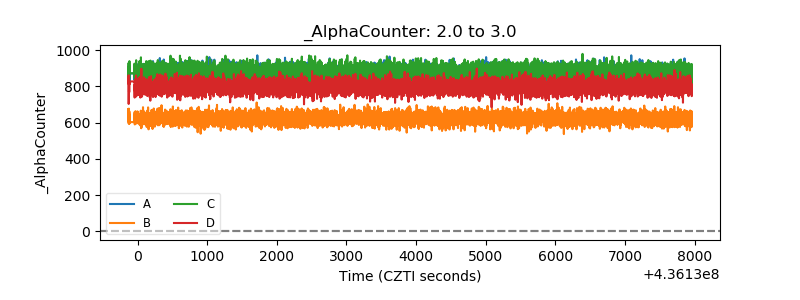 |
| _CPM_Rate | 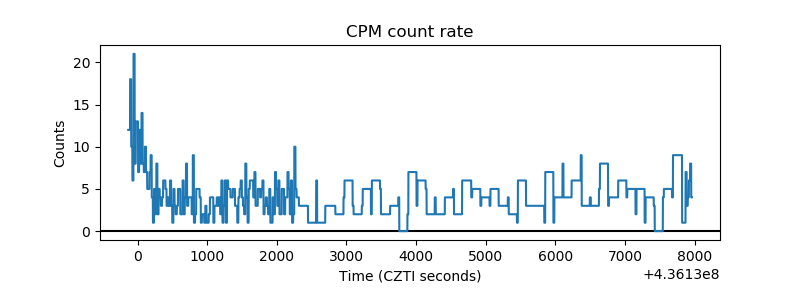 |
| CZT Counter | 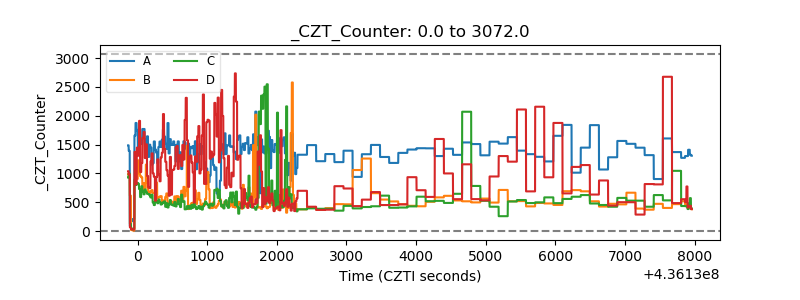 |
| +2.5 Volts monitor | 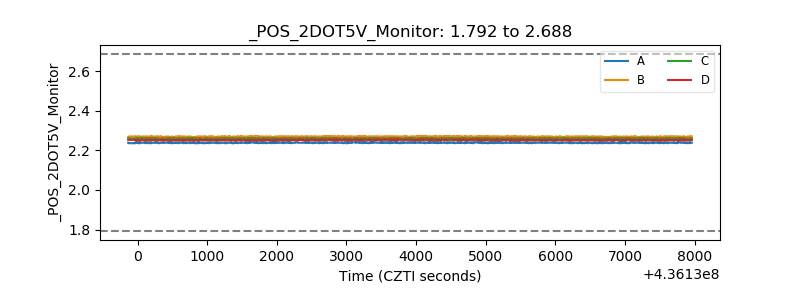 |
| +5 Volts monitor | 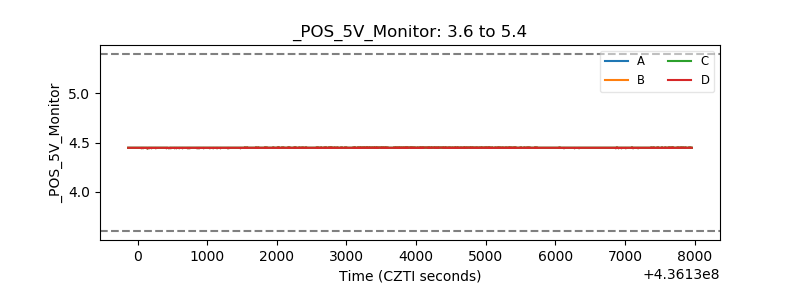 |
| _ROLL_ROT | 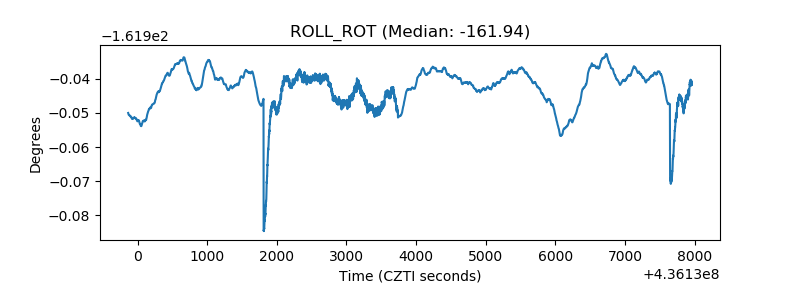 |
| _Roll_DEC | 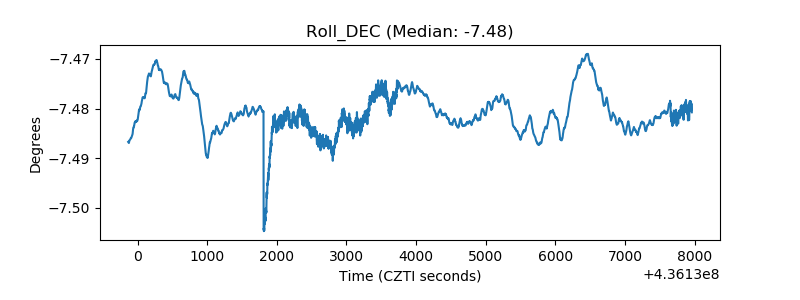 |
| _Roll_RA | 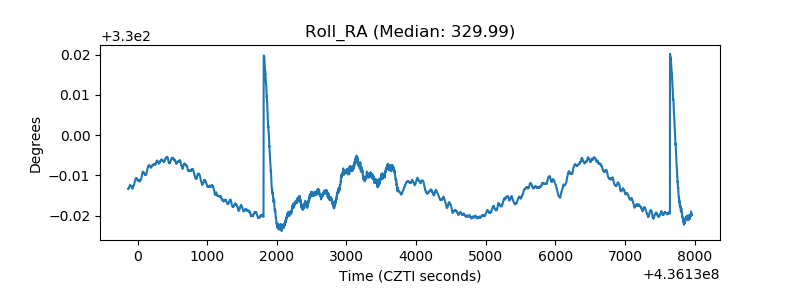 |
| Veto Counter | 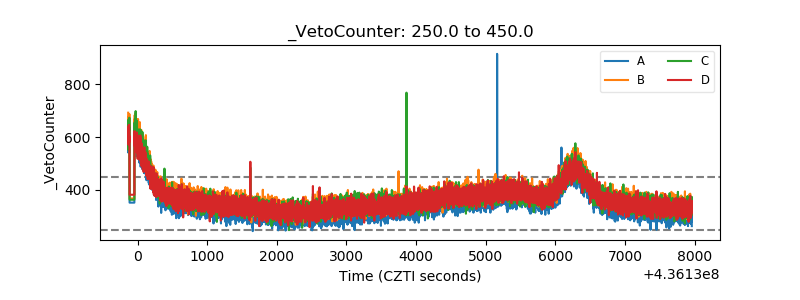 |