| Param | Original file | Final file |
|---|---|---|
| Filename | modeM0/AS1A13_008T02_9000005900_43697cztM0_level2.fits | modeM0/AS1A13_008T02_9000005900_43697cztM0_level2_quad_clean.evt |
| Size (bytes) | 789,315,840 | 129,323,520 |
| Size | 752.8 MB | 123.3 MB |
| Events in quadrant A | 11,462,459 | 800,873 |
| Events in quadrant B | 4,934,806 | 901,805 |
| Events in quadrant C | 4,731,525 | 883,666 |
| Events in quadrant D | 7,453,902 | 756,758 |
| Mode M0 | |||
|---|---|---|---|
| Quadrant | BADHDUFLAG | Total packets | Discarded packets |
| A | 0 | 39883 | 3 |
| B | 0 | 20112 | 0 |
| C | 0 | 19699 | 0 |
| D | 0 | 27835 | 0 |
| Mode SS | |||
|---|---|---|---|
| Quadrant | BADHDUFLAG | Total packets | Discarded packets |
| A | 0 | 166 | 0 |
| B | 0 | 166 | 0 |
| C | 0 | 166 | 0 |
| D | 0 | 166 | 0 |
| Quadrant | Total seconds | Saturated seconds | Saturation percentage |
|---|---|---|---|
| A | 8228 | 1105 | 13.429752% |
| B | 8229 | 280 | 3.402601% |
| C | 8229 | 136 | 1.652692% |
| D | 8229 | 811 | 9.855389% |
Noise dominated data is calculated using 1-second bins in cleaned event files. If a bin has >2000 counts, and if more than 50% of those come from <1% of pixels, then it is considered to be noise-dominated and hence unusable.
| Quadrant | # 1 sec bins | Bins with >0 counts | Bins with >2000 counts | High rate bins dominated by noise | Noise dominated (total time) | Noise dominated (detector-on time) | Marked lightcurve |
|---|---|---|---|---|---|---|---|
| A | 8228 | 8228 | 248 | 248 | 3.01% | 3.01% | 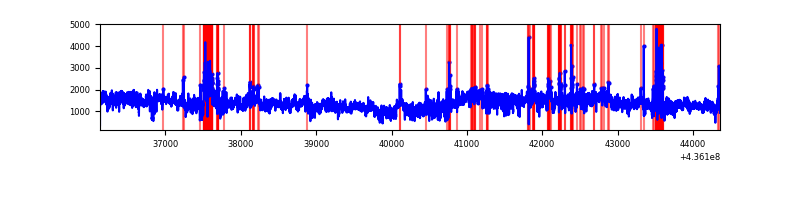 |
| B | 8229 | 8229 | 96 | 96 | 1.17% | 1.17% | 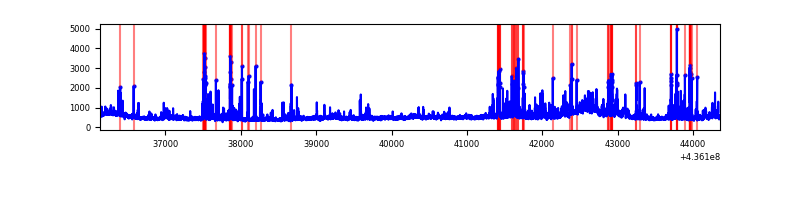 |
| C | 8229 | 8229 | 66 | 66 | 0.80% | 0.80% | 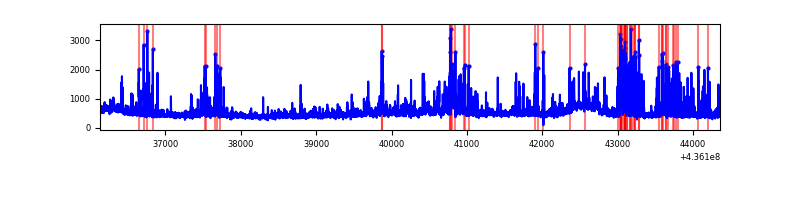 |
| D | 8229 | 8229 | 534 | 534 | 6.49% | 6.49% | 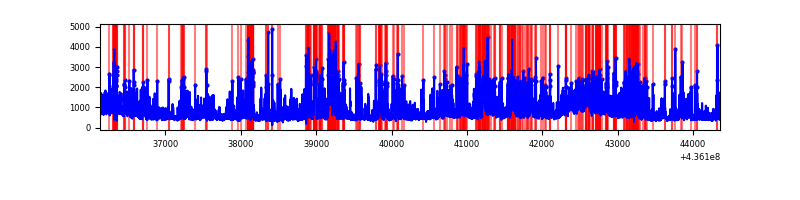 |
Top three noisy pixels from each quadrant. If the there are fewer than three noisy pixels in the level2.evt file, extra rows are filled as -1
| Pixel properties | Quadrant properties | ||||||
|---|---|---|---|---|---|---|---|
| Quadrant | DetID | PixID | Counts | Sigma | Mean | Median | Sigma |
| A | 15 | 222 | 5681411 | 29631.13 | 916 | 897 | 191.7 |
| A | 10 | 83 | 934572 | 4870.31 | 916 | 897 | 191.7 |
| A | 15 | 223 | 813862 | 4240.65 | 916 | 897 | 191.7 |
| B | 5 | 235 | 420657 | 2254.9 | 945 | 918 | 186.1 |
| B | 12 | 3 | 202888 | 1085.01 | 945 | 918 | 186.1 |
| B | 15 | 35 | 133676 | 713.2 | 945 | 918 | 186.1 |
| C | 15 | 157 | 501040 | 2289.77 | 927 | 935 | 218.4 |
| C | 3 | 233 | 284531 | 1298.47 | 927 | 935 | 218.4 |
| C | 14 | 96 | 94070 | 426.42 | 927 | 935 | 218.4 |
| D | 4 | 221 | 805593 | 3319.12 | 901 | 876 | 242.4 |
| D | 14 | 210 | 604204 | 2488.47 | 901 | 876 | 242.4 |
| D | 5 | 235 | 321548 | 1322.64 | 901 | 876 | 242.4 |
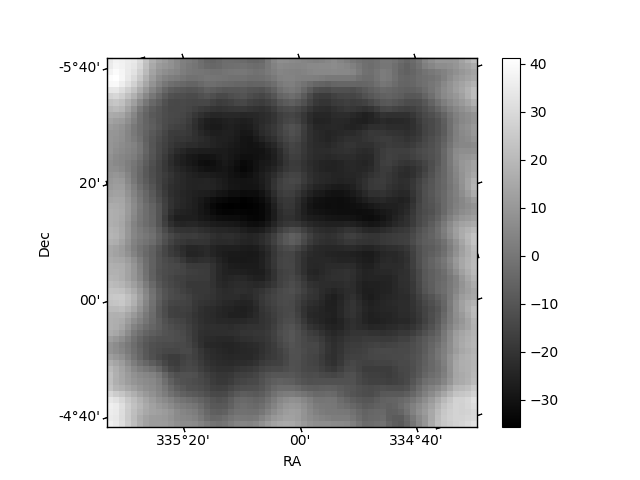
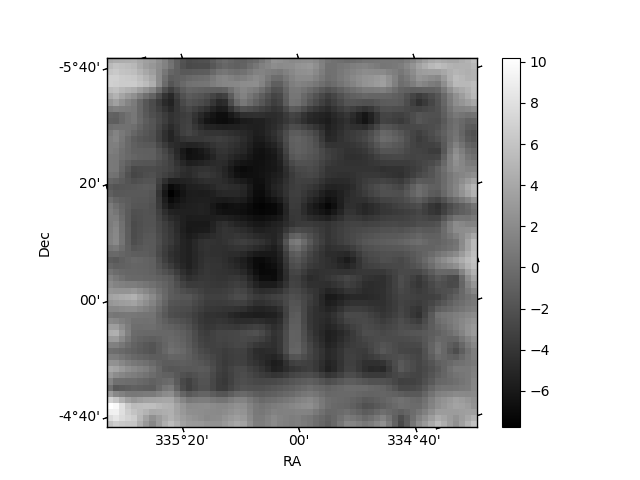
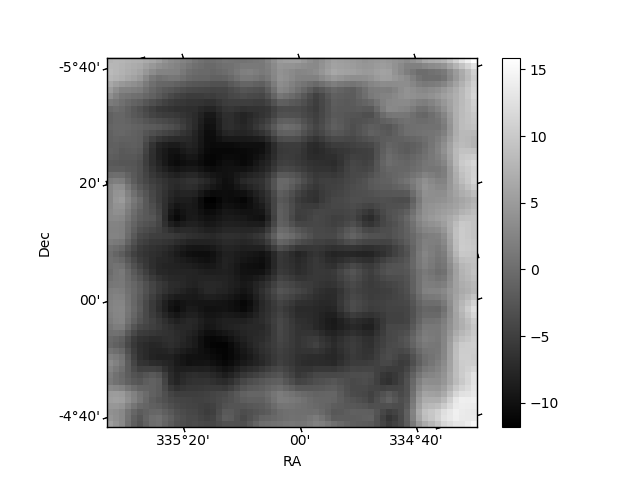
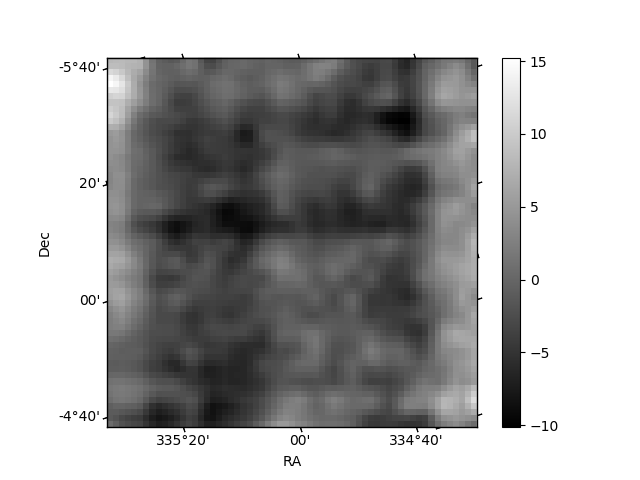
Histogram calculated using DETX and DETY for each event in the final _common_clean file
| Quadrant A | 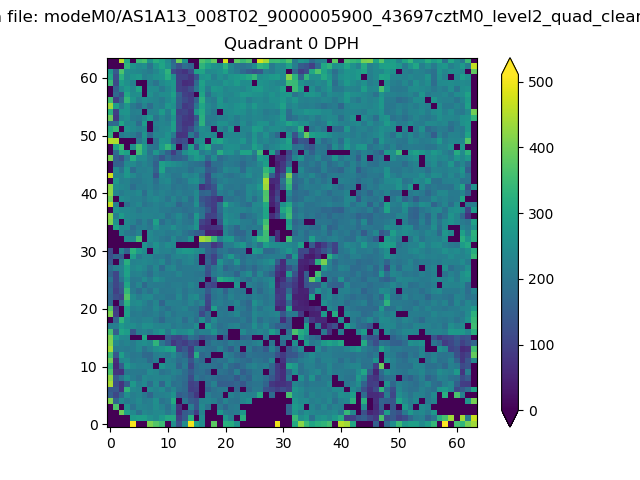 |
 |
Quadrant B |
|---|---|---|---|
| Quadrant D | 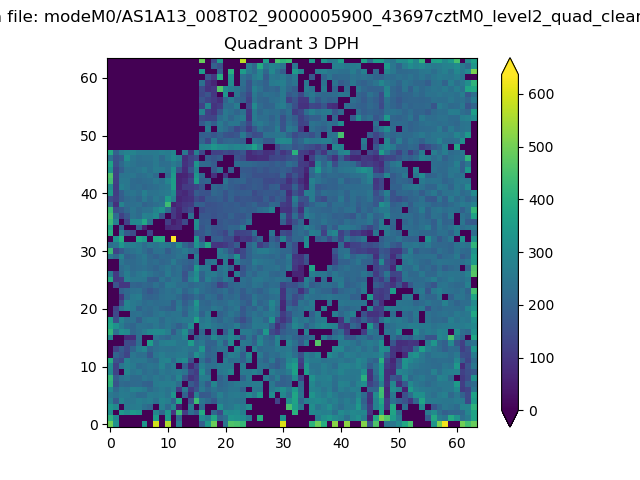 |
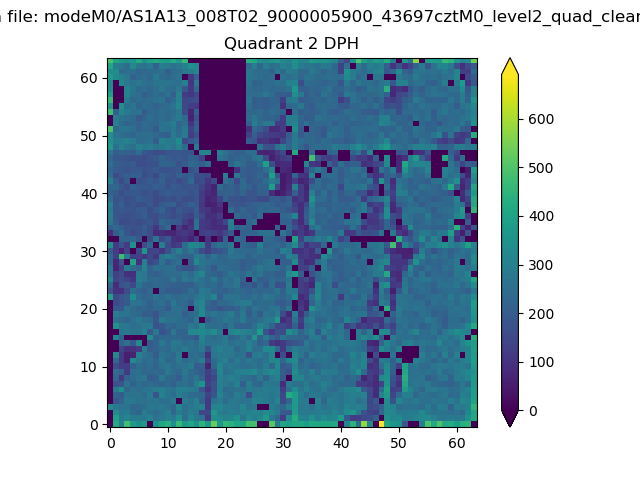 |
Quadrant C |
| Plot type | Count rate plots | Images |
|---|---|---|
| Comparison with Poisson distribution Blue bars denote a histogram of data divided into 1 sec bins. Red curve is a Poisson curve with rate = median count rate of data. |
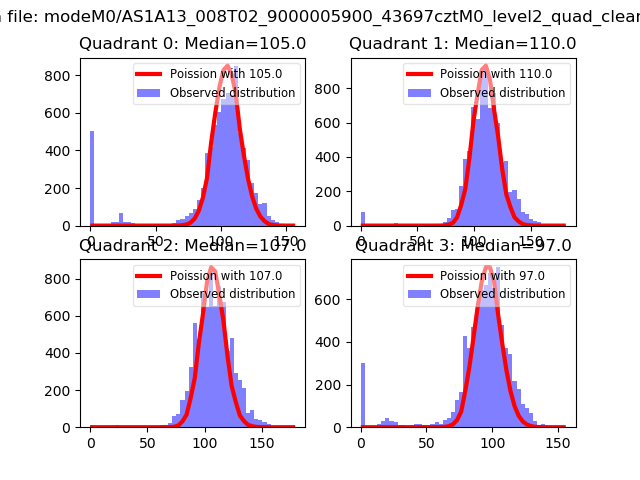 |
 |
| Quadrant-wise count rates Data is divided into 100 sec bins |
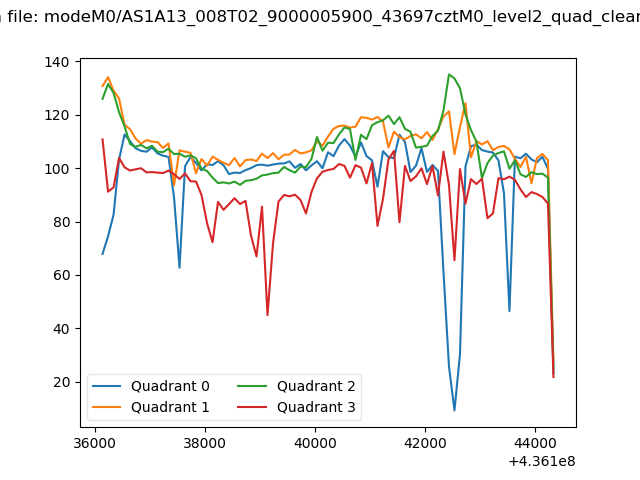 |
|
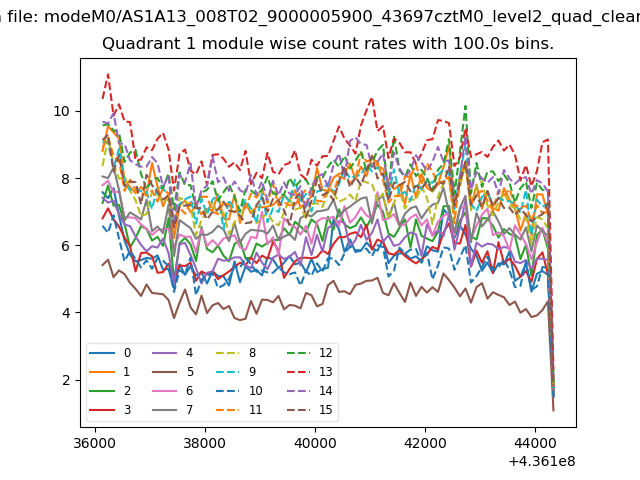
| Module-wise count rates for Quadrant A Data is divided into 100 sec bins |
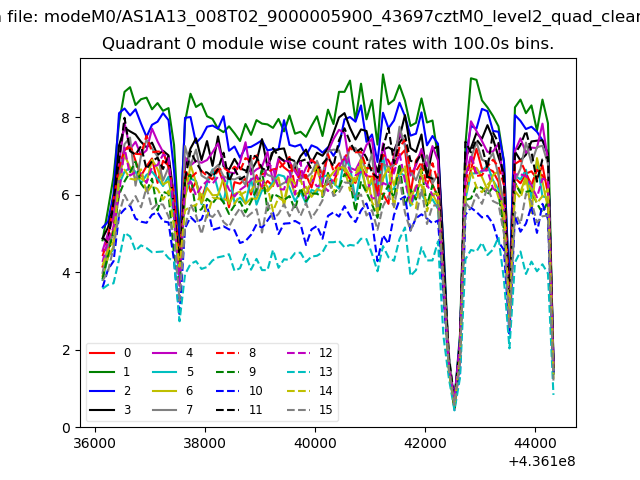 |
 |
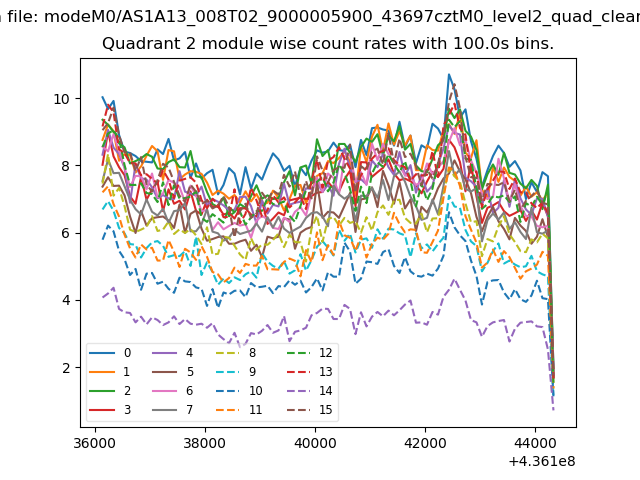
| Module-wise count rates for Quadrant B Data is divided into 100 sec bins |
 |
 |
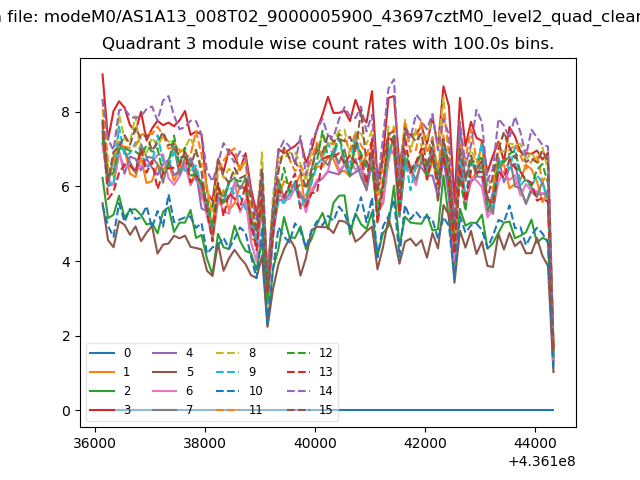
| Module-wise count rates for Quadrant C Data is divided into 100 sec bins |
 |
 |
| Module-wise count rates for Quadrant D Data is divided into 100 sec bins |
 |
 |
| Parameter | Plot |
|---|---|
| CZT HV Monitor | 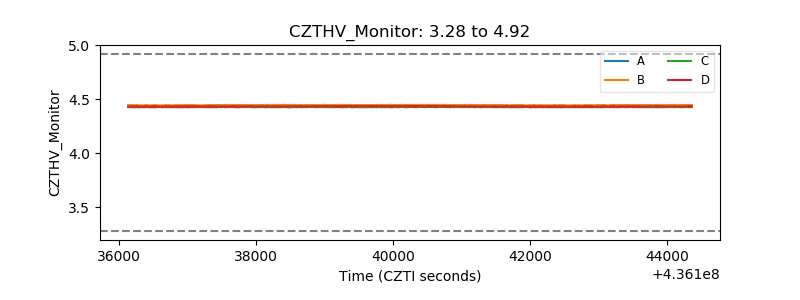 |
| D_VDD | 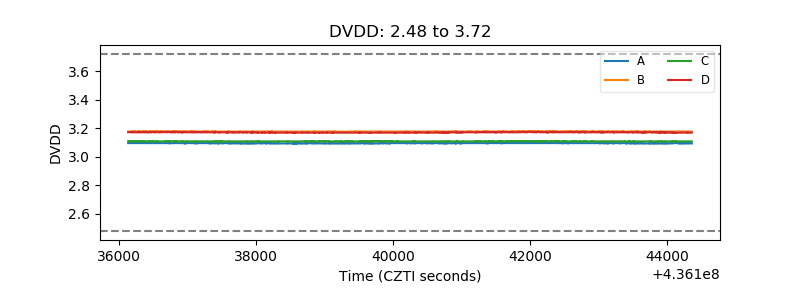 |
| Temperature 1 | 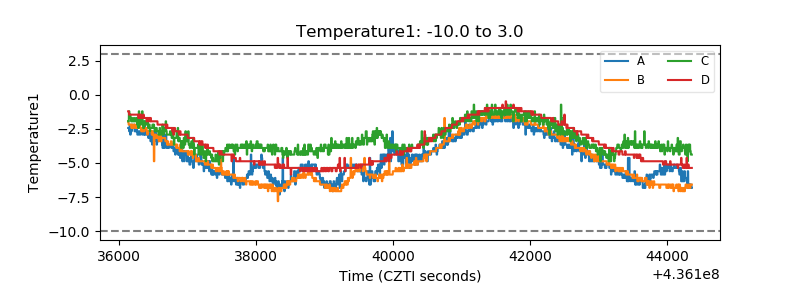 |
| Veto HV Monitor | 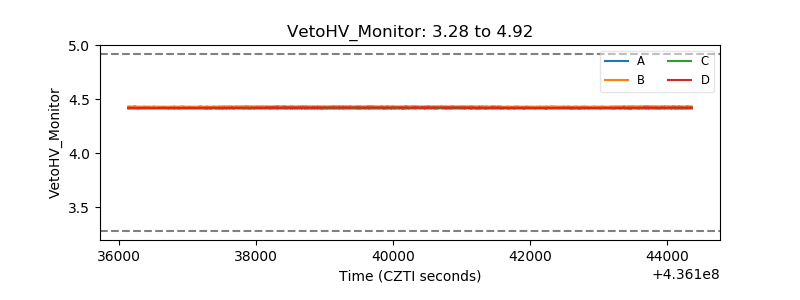 |
| Veto LLD | 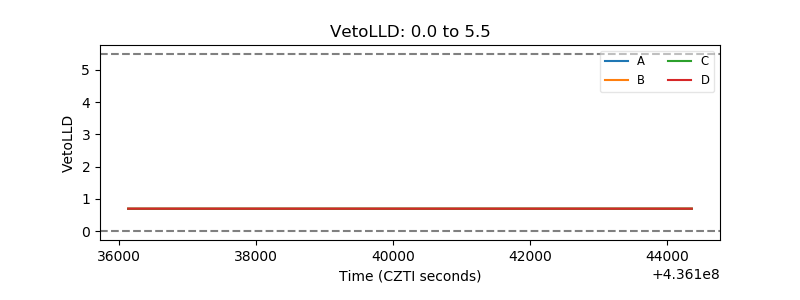 |
| Alpha Counter | 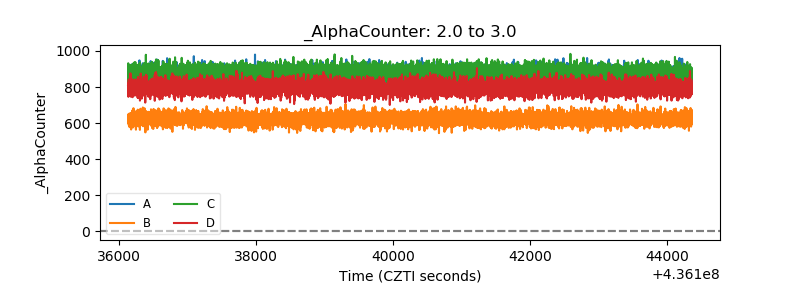 |
| _CPM_Rate | 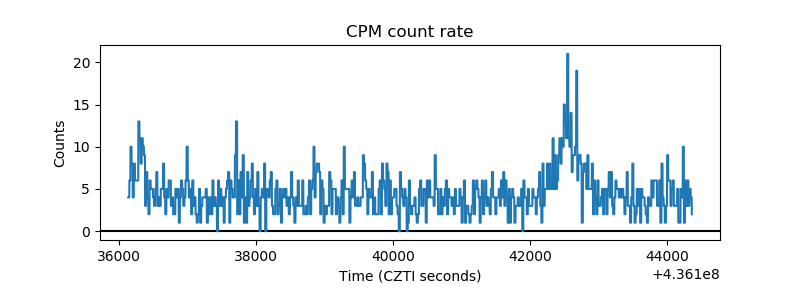 |
| CZT Counter | 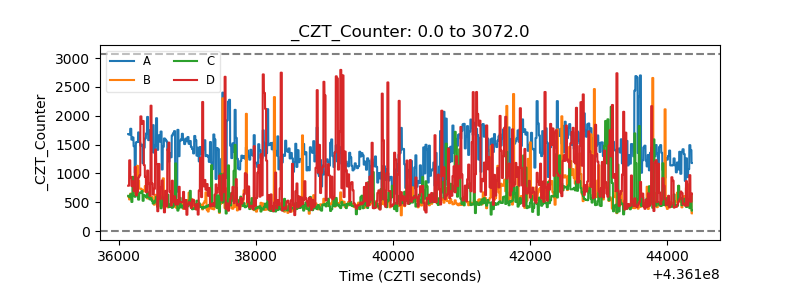 |
| +2.5 Volts monitor | 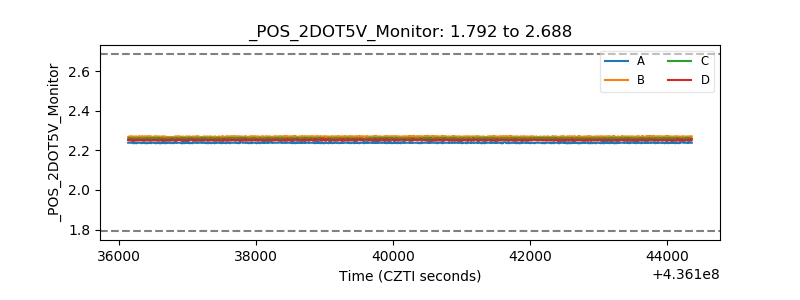 |
| +5 Volts monitor | 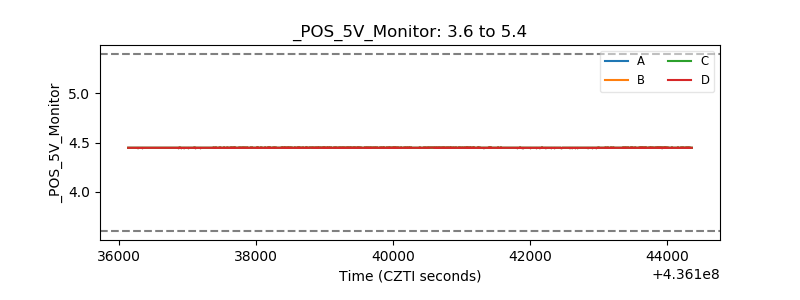 |
| _ROLL_ROT | 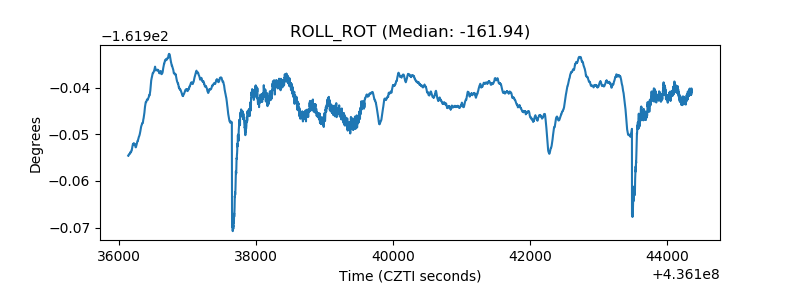 |
| _Roll_DEC | 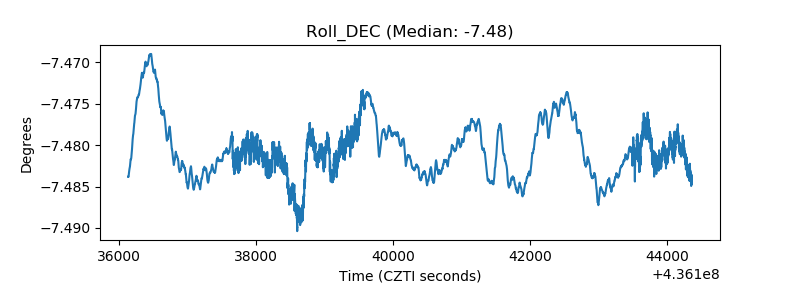 |
| _Roll_RA | 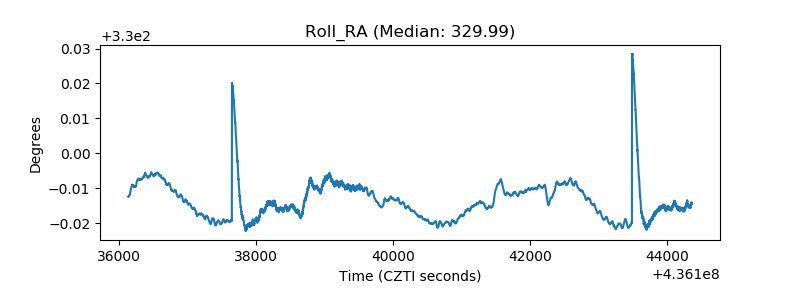 |
| Veto Counter | 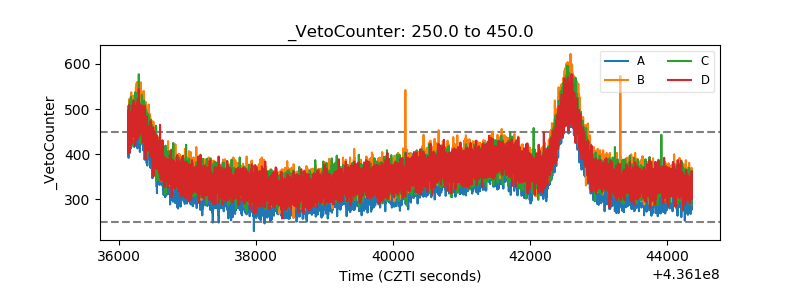 |