| Param | Original file | Final file |
|---|---|---|
| Filename | modeM0/AS1A13_008T02_9000005900_43700cztM0_level2.fits | modeM0/AS1A13_008T02_9000005900_43700cztM0_level2_quad_clean.evt |
| Size (bytes) | 1,808,262,720 | 284,817,600 |
| Size | 1.7 GB | 271.6 MB |
| Events in quadrant A | 24,061,482 | 1,863,739 |
| Events in quadrant B | 10,717,953 | 1,999,256 |
| Events in quadrant C | 14,362,174 | 1,846,947 |
| Events in quadrant D | 16,351,920 | 1,621,230 |
| Mode M9 | |||
|---|---|---|---|
| Quadrant | BADHDUFLAG | Total packets | Discarded packets |
| A | 0 | 18 | 0 |
| B | 0 | 18 | 0 |
| C | 0 | 18 | 0 |
| D | 0 | 18 | 0 |
| Mode M0 | |||
|---|---|---|---|
| Quadrant | BADHDUFLAG | Total packets | Discarded packets |
| A | 0 | 84773 | 3 |
| B | 0 | 44005 | 3 |
| C | 0 | 55547 | 3 |
| D | 0 | 61616 | 3 |
| Mode SS | |||
|---|---|---|---|
| Quadrant | BADHDUFLAG | Total packets | Discarded packets |
| A | 0 | 378 | 0 |
| B | 0 | 378 | 0 |
| C | 0 | 378 | 0 |
| D | 0 | 378 | 0 |
| Quadrant | Total seconds | Saturated seconds | Saturation percentage |
|---|---|---|---|
| A | 18748 | 1352 | 7.211436% |
| B | 18748 | 582 | 3.104331% |
| C | 18748 | 1435 | 7.654150% |
| D | 18749 | 1991 | 10.619233% |
Noise dominated data is calculated using 1-second bins in cleaned event files. If a bin has >2000 counts, and if more than 50% of those come from <1% of pixels, then it is considered to be noise-dominated and hence unusable.
| Quadrant | # 1 sec bins | Bins with >0 counts | Bins with >2000 counts | High rate bins dominated by noise | Noise dominated (total time) | Noise dominated (detector-on time) | Marked lightcurve |
|---|---|---|---|---|---|---|---|
| A | 20468 | 18751 | 338 | 338 | 1.65% | 1.80% | 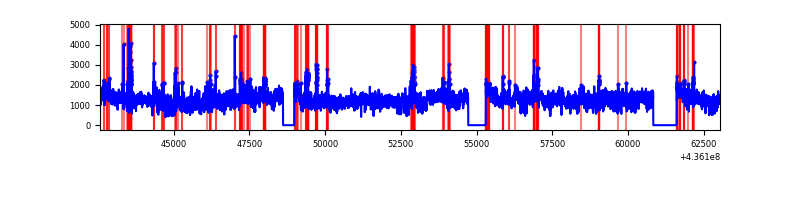 |
| B | 20468 | 18751 | 214 | 214 | 1.05% | 1.14% | 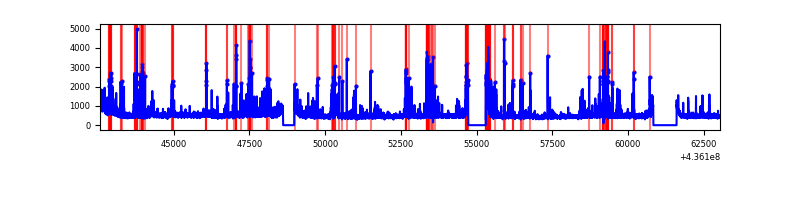 |
| C | 20468 | 18751 | 963 | 963 | 4.70% | 5.14% | 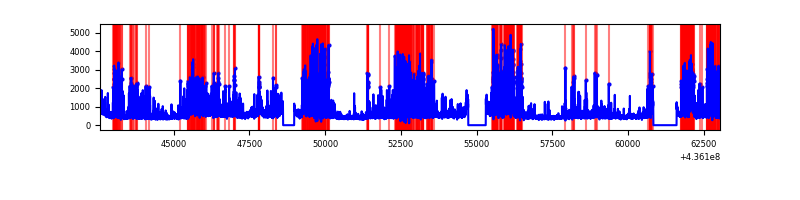 |
| D | 20469 | 18752 | 1305 | 1305 | 6.38% | 6.96% | 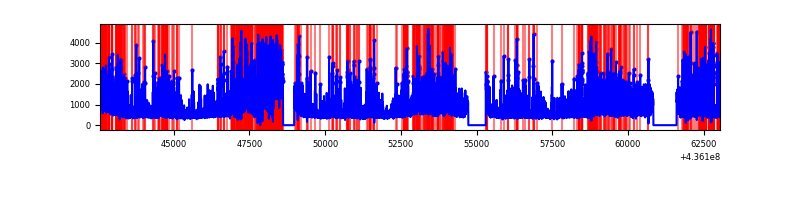 |
Top three noisy pixels from each quadrant. If the there are fewer than three noisy pixels in the level2.evt file, extra rows are filled as -1
| Pixel properties | Quadrant properties | ||||||
|---|---|---|---|---|---|---|---|
| Quadrant | DetID | PixID | Counts | Sigma | Mean | Median | Sigma |
| A | 15 | 222 | 11879150 | 27606.93 | 2088 | 2042 | 430.2 |
| A | 10 | 83 | 2194214 | 5095.44 | 2088 | 2042 | 430.2 |
| A | 14 | 63 | 910841 | 2112.4 | 2088 | 2042 | 430.2 |
| B | 5 | 235 | 1191092 | 2830.85 | 2118 | 2050 | 420.0 |
| B | 12 | 3 | 279021 | 659.41 | 2118 | 2050 | 420.0 |
| B | 4 | 206 | 277823 | 656.55 | 2118 | 2050 | 420.0 |
| C | 15 | 157 | 4438622 | 9172.72 | 2043 | 2053 | 483.7 |
| C | 3 | 233 | 1215921 | 2509.7 | 2043 | 2053 | 483.7 |
| C | 14 | 96 | 201133 | 411.6 | 2043 | 2053 | 483.7 |
| D | 5 | 222 | 1575305 | 3047.52 | 2013 | 1947 | 516.3 |
| D | 7 | 80 | 813847 | 1572.61 | 2013 | 1947 | 516.3 |
| D | 5 | 235 | 813269 | 1571.49 | 2013 | 1947 | 516.3 |
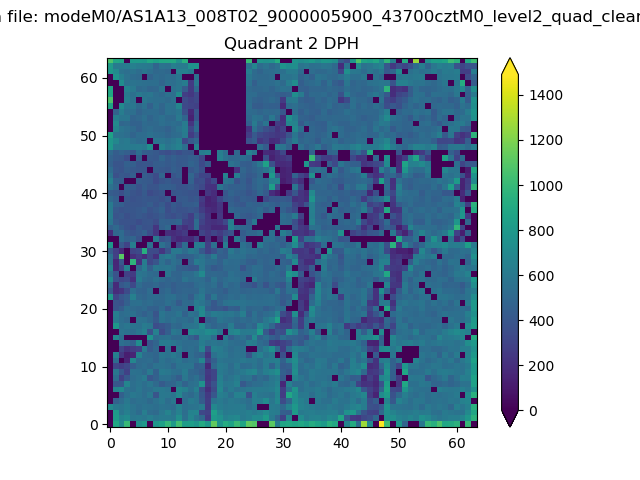
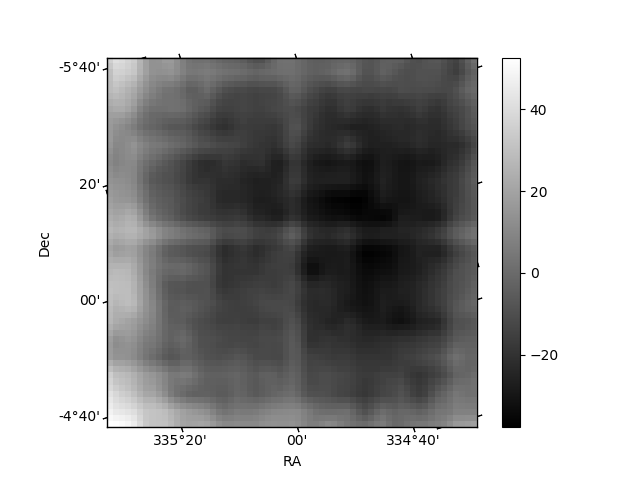
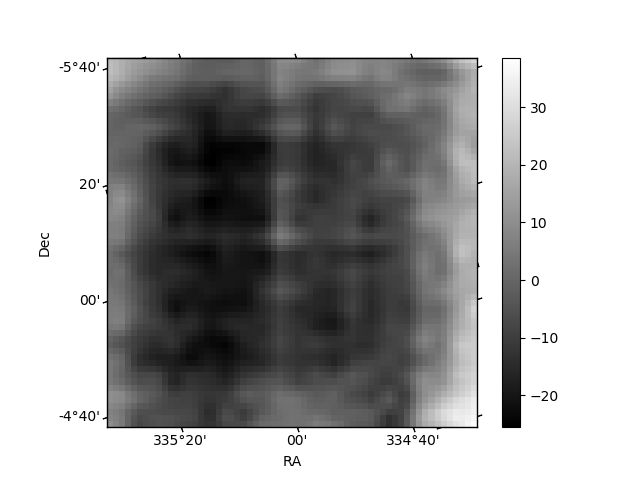
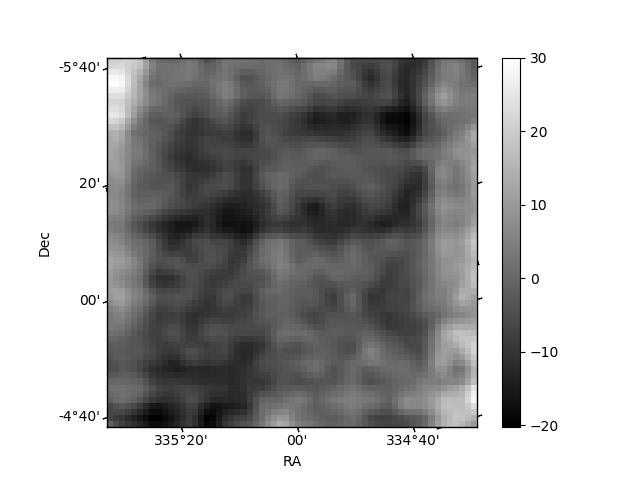
Histogram calculated using DETX and DETY for each event in the final _common_clean file
| Quadrant A | 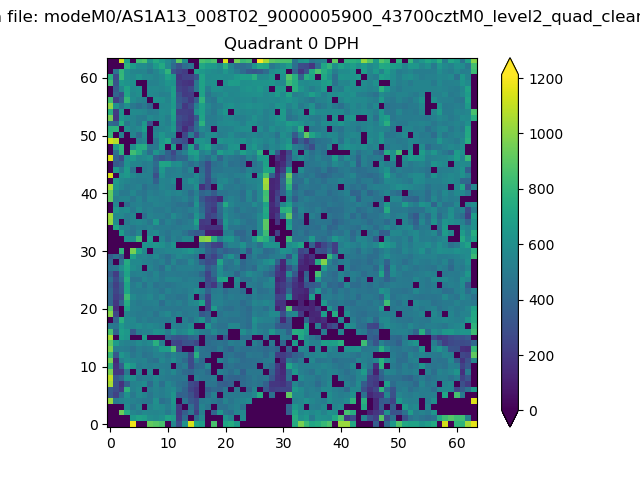 |
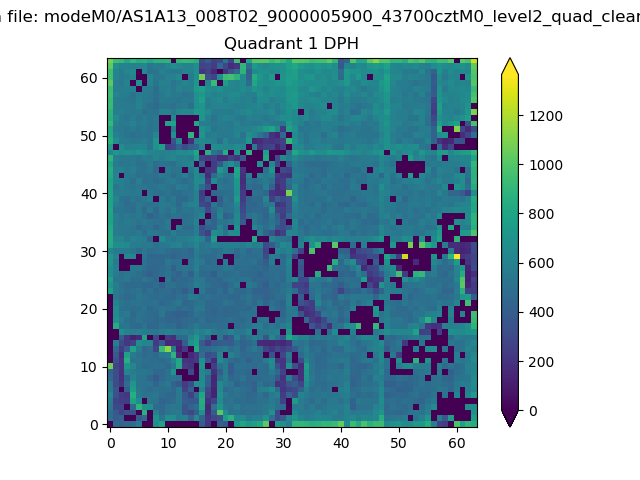 |
Quadrant B |
|---|---|---|---|
| Quadrant D | 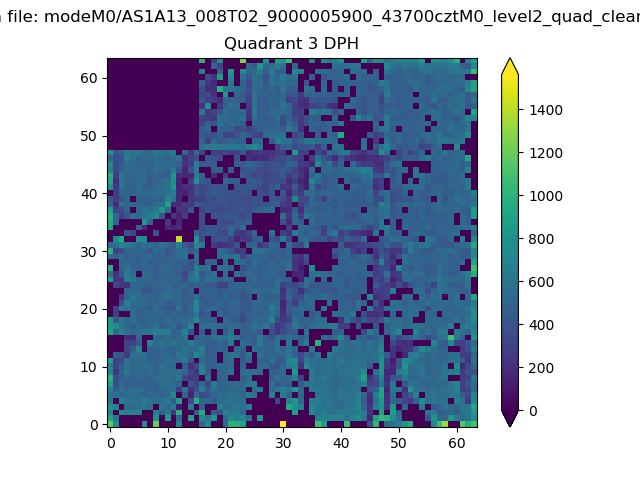 |
 |
Quadrant C |
| Plot type | Count rate plots | Images |
|---|---|---|
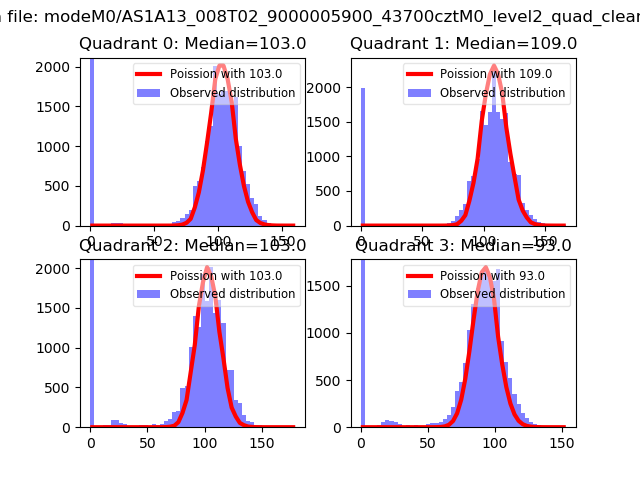
| Comparison with Poisson distribution Blue bars denote a histogram of data divided into 1 sec bins. Red curve is a Poisson curve with rate = median count rate of data. |
 |
 |
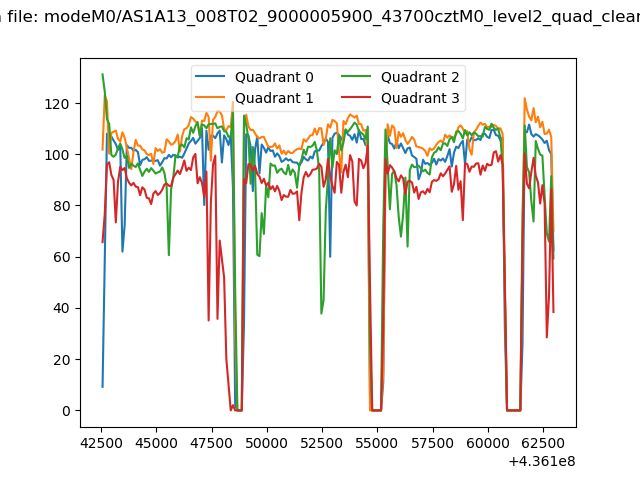
| Quadrant-wise count rates Data is divided into 100 sec bins |
 |
|
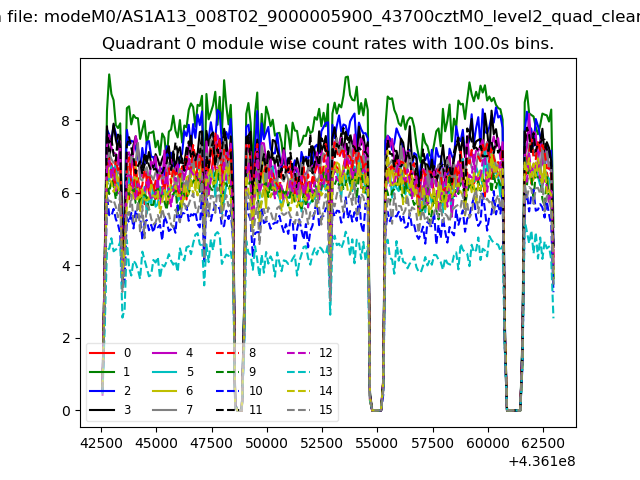
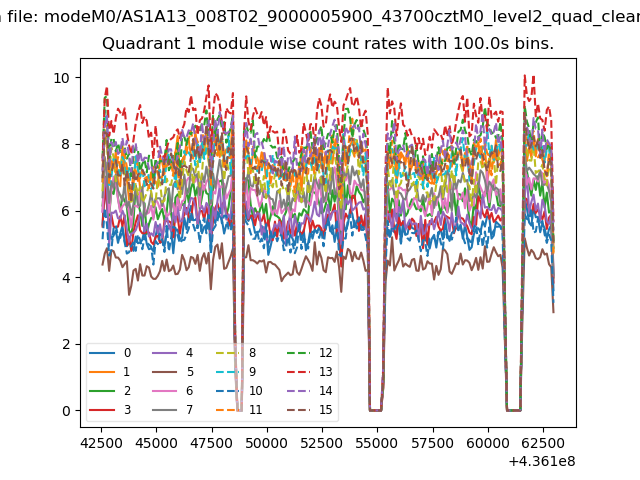
| Module-wise count rates for Quadrant A Data is divided into 100 sec bins |
 |
 |
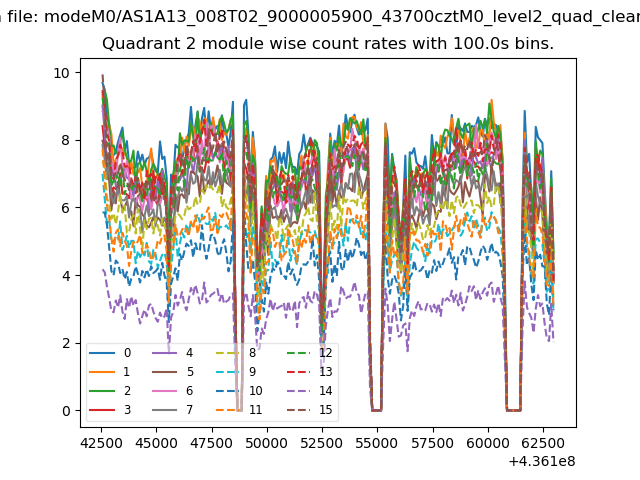
| Module-wise count rates for Quadrant B Data is divided into 100 sec bins |
 |
 |
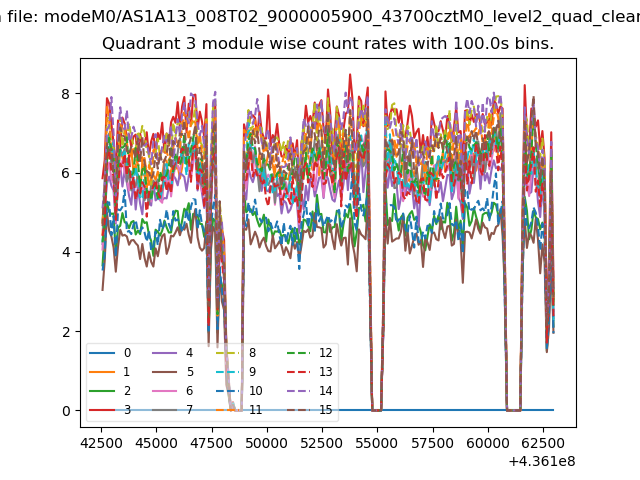
| Module-wise count rates for Quadrant C Data is divided into 100 sec bins |
 |
 |
| Module-wise count rates for Quadrant D Data is divided into 100 sec bins |
 |
 |
| Parameter | Plot |
|---|---|
| CZT HV Monitor | 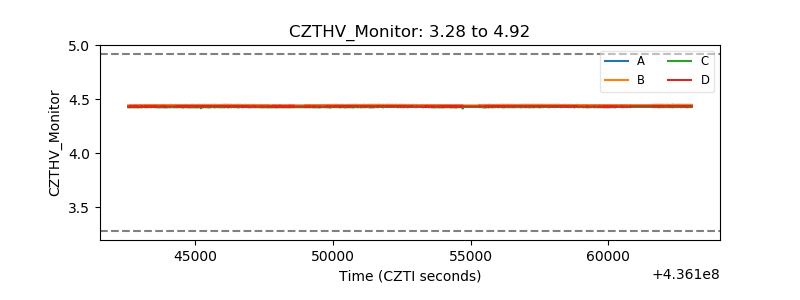 |
| D_VDD | 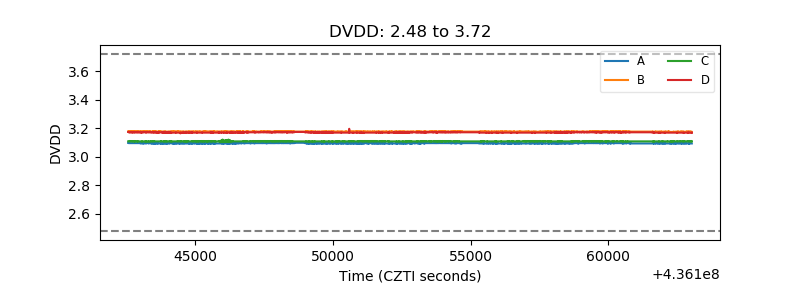 |
| Temperature 1 | 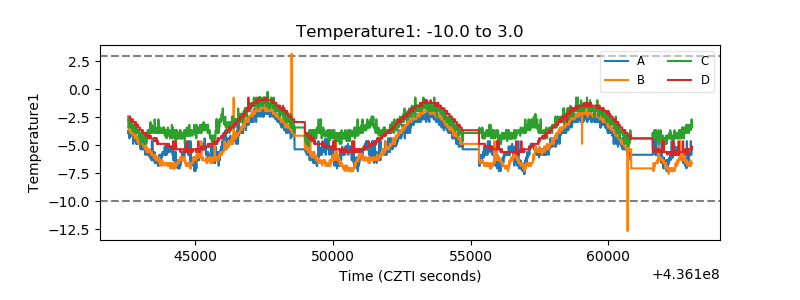 |
| Veto HV Monitor | 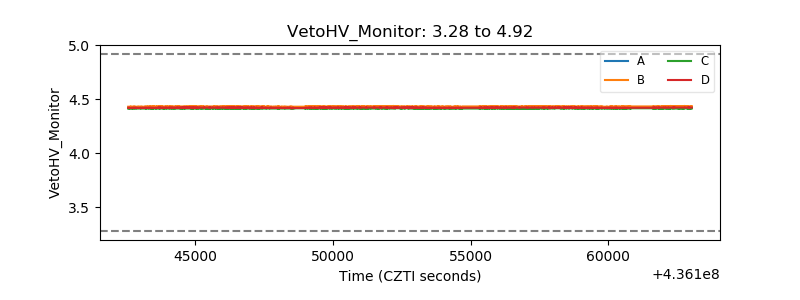 |
| Veto LLD | 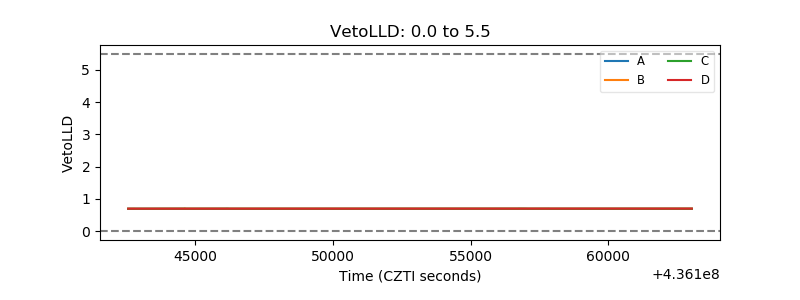 |
| Alpha Counter | 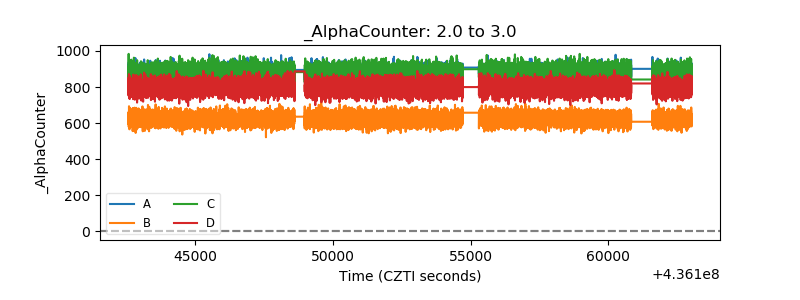 |
| _CPM_Rate | 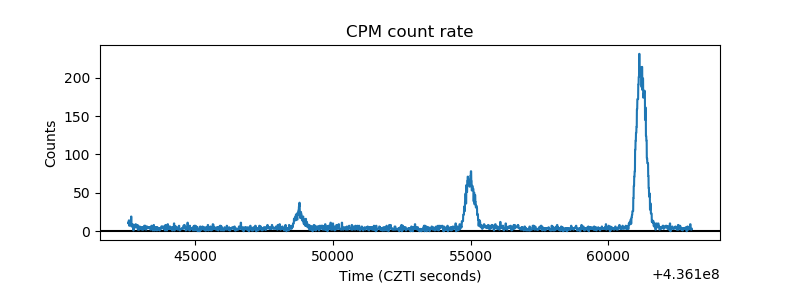 |
| CZT Counter | 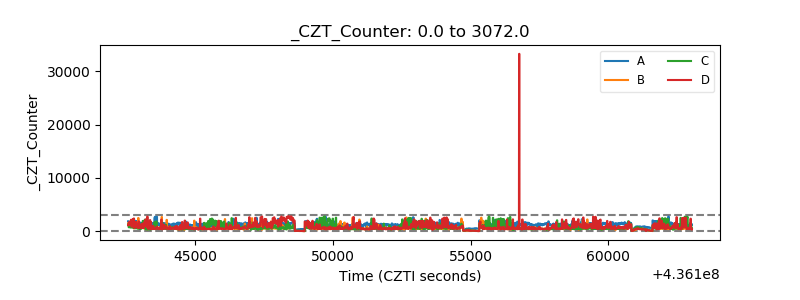 |
| +2.5 Volts monitor | 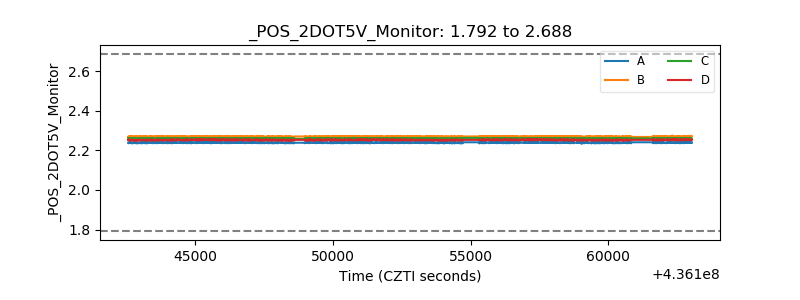 |
| +5 Volts monitor | 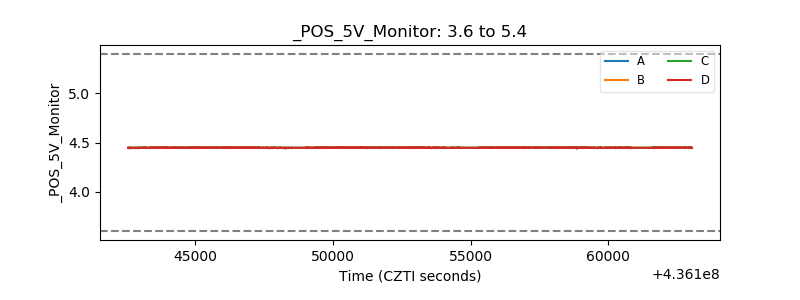 |
| _ROLL_ROT | 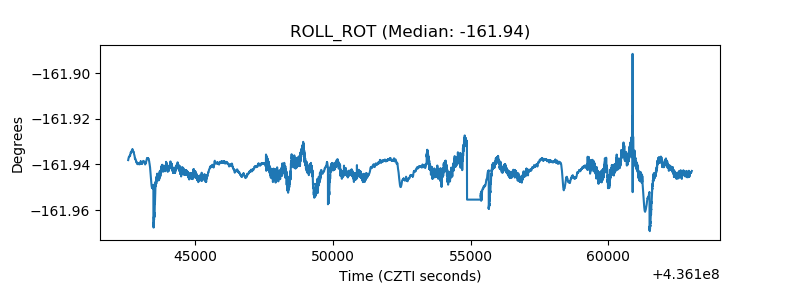 |
| _Roll_DEC | 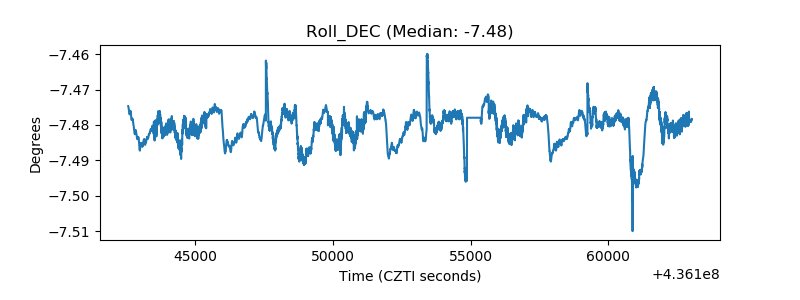 |
| _Roll_RA |  |
| Veto Counter | 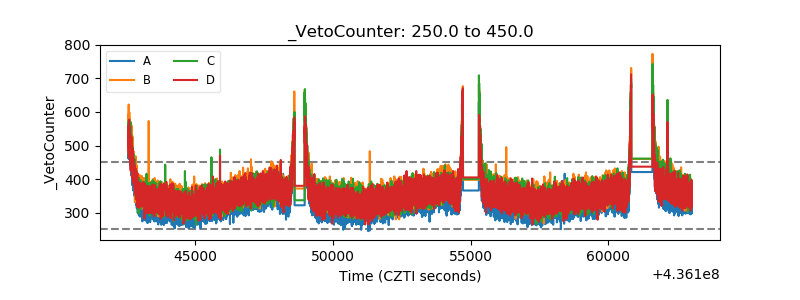 |