| Param | Original file | Final file |
|---|---|---|
| Filename | modeM0/AS1A13_008T02_9000005900_43701cztM0_level2.fits | modeM0/AS1A13_008T02_9000005900_43701cztM0_level2_quad_clean.evt |
| Size (bytes) | 671,613,120 | 105,793,920 |
| Size | 640.5 MB | 100.9 MB |
| Events in quadrant A | 8,102,344 | 716,256 |
| Events in quadrant B | 3,441,057 | 755,834 |
| Events in quadrant C | 5,462,981 | 678,250 |
| Events in quadrant D | 7,336,837 | 584,969 |
| Mode M9 | |||
|---|---|---|---|
| Quadrant | BADHDUFLAG | Total packets | Discarded packets |
| A | 0 | 13 | 0 |
| B | 0 | 14 | 0 |
| C | 0 | 14 | 0 |
| D | 0 | 14 | 0 |
| Mode M0 | |||
|---|---|---|---|
| Quadrant | BADHDUFLAG | Total packets | Discarded packets |
| A | 0 | 28808 | 2 |
| B | 0 | 14503 | 2 |
| C | 0 | 20700 | 2 |
| D | 0 | 26475 | 2 |
| Mode SS | |||
|---|---|---|---|
| Quadrant | BADHDUFLAG | Total packets | Discarded packets |
| A | 0 | 138 | 0 |
| B | 0 | 138 | 0 |
| C | 0 | 138 | 0 |
| D | 0 | 138 | 0 |
| Quadrant | Total seconds | Saturated seconds | Saturation percentage |
|---|---|---|---|
| A | 6704 | 300 | 4.474940% |
| B | 6704 | 101 | 1.506563% |
| C | 6704 | 642 | 9.576372% |
| D | 6704 | 994 | 14.826969% |
Noise dominated data is calculated using 1-second bins in cleaned event files. If a bin has >2000 counts, and if more than 50% of those come from <1% of pixels, then it is considered to be noise-dominated and hence unusable.
| Quadrant | # 1 sec bins | Bins with >0 counts | Bins with >2000 counts | High rate bins dominated by noise | Noise dominated (total time) | Noise dominated (detector-on time) | Marked lightcurve |
|---|---|---|---|---|---|---|---|
| A | 7669 | 6705 | 48 | 48 | 0.63% | 0.72% | 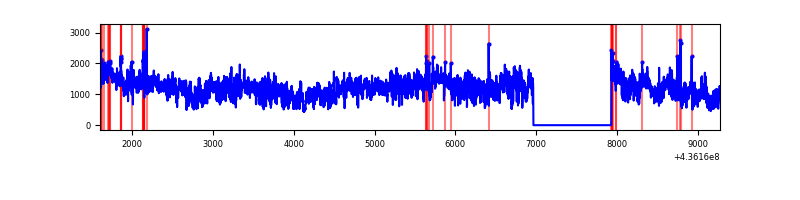 |
| B | 7669 | 6705 | 11 | 11 | 0.14% | 0.16% | 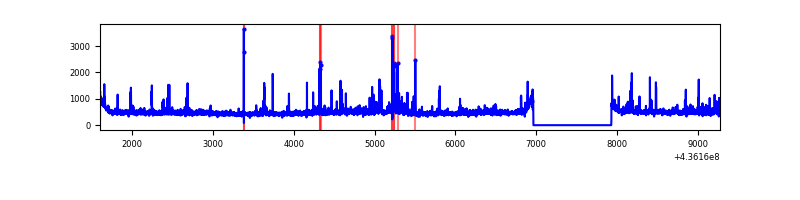 |
| C | 7669 | 6705 | 459 | 459 | 5.99% | 6.85% | 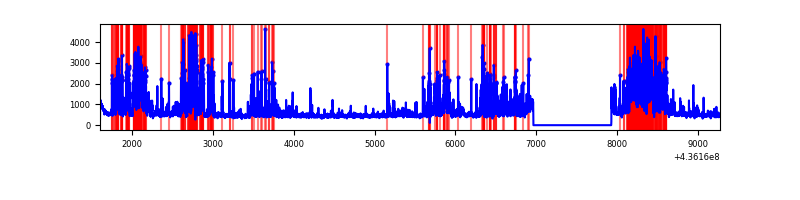 |
| D | 7669 | 6705 | 773 | 773 | 10.08% | 11.53% | 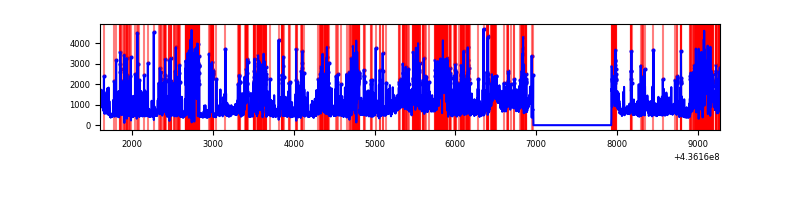 |
Top three noisy pixels from each quadrant. If the there are fewer than three noisy pixels in the level2.evt file, extra rows are filled as -1
| Pixel properties | Quadrant properties | ||||||
|---|---|---|---|---|---|---|---|
| Quadrant | DetID | PixID | Counts | Sigma | Mean | Median | Sigma |
| A | 15 | 222 | 3782936 | 23938.51 | 763 | 747 | 158.0 |
| A | 10 | 83 | 900288 | 5693.44 | 763 | 747 | 158.0 |
| A | 14 | 63 | 346059 | 2185.57 | 763 | 747 | 158.0 |
| B | 5 | 235 | 159252 | 1030.85 | 777 | 752 | 153.8 |
| B | 4 | 206 | 76721 | 494.08 | 777 | 752 | 153.8 |
| B | 4 | 171 | 42936 | 274.35 | 777 | 752 | 153.8 |
| C | 15 | 157 | 2013293 | 11524.22 | 740 | 742 | 174.6 |
| C | 3 | 233 | 280163 | 1600.01 | 740 | 742 | 174.6 |
| C | 15 | 173 | 77071 | 437.07 | 740 | 742 | 174.6 |
| D | 7 | 80 | 1745742 | 9421.8 | 720 | 701 | 185.2 |
| D | 12 | 33 | 504298 | 2719.01 | 720 | 701 | 185.2 |
| D | 8 | 48 | 376213 | 2027.46 | 720 | 701 | 185.2 |
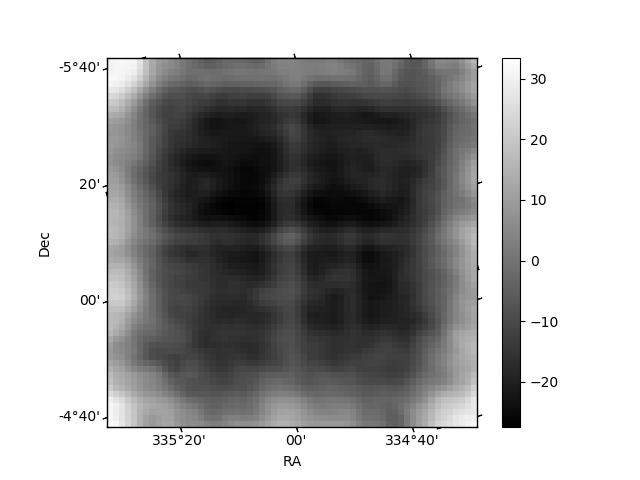
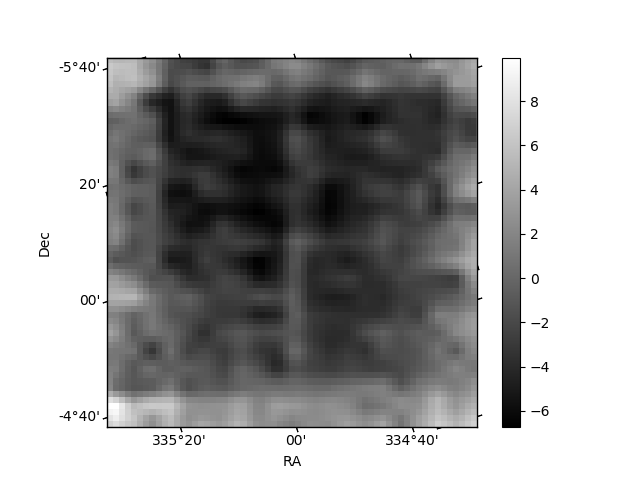
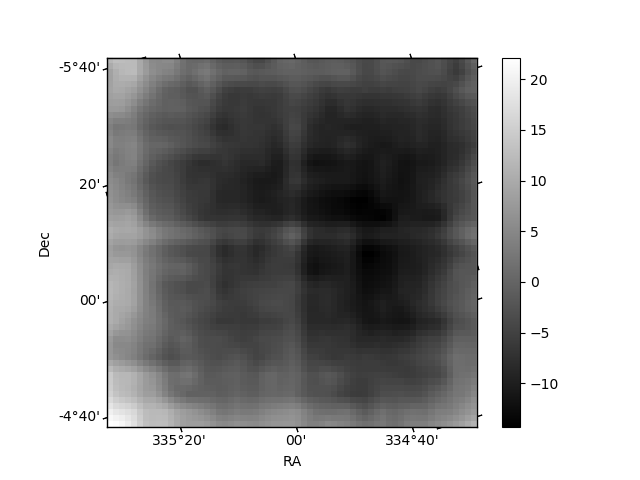
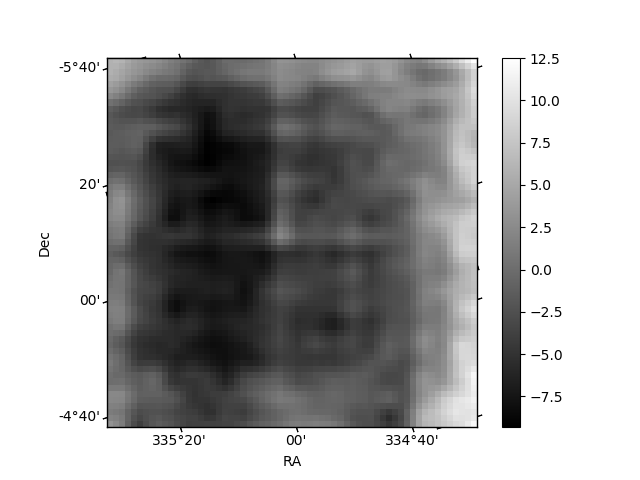
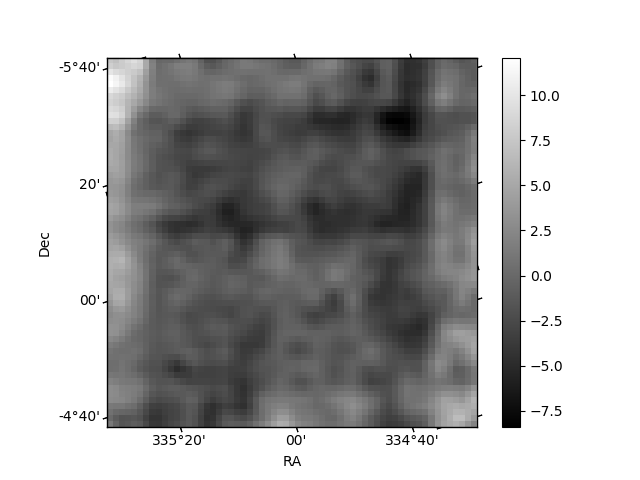
Histogram calculated using DETX and DETY for each event in the final _common_clean file
| Quadrant A | 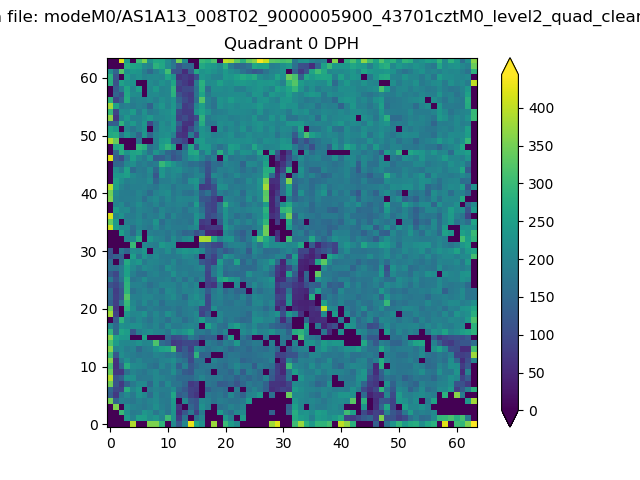 |
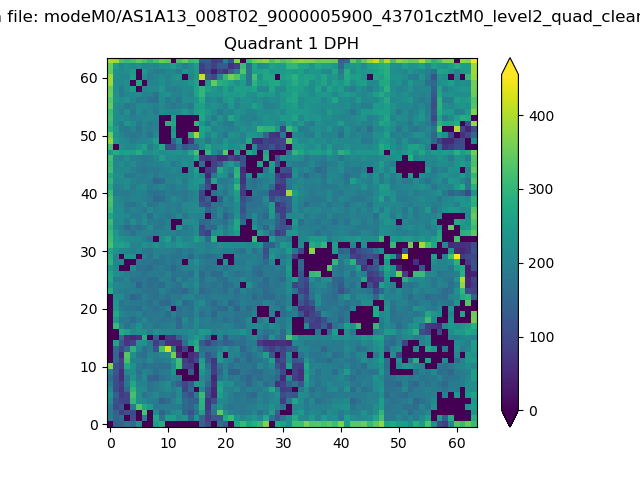 |
Quadrant B |
|---|---|---|---|
| Quadrant D |  |
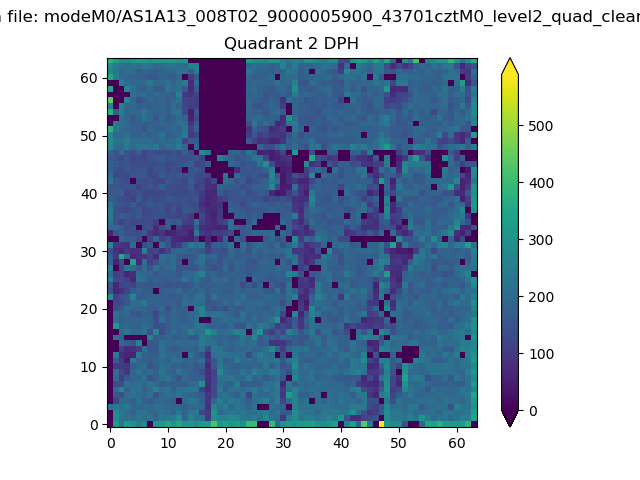 |
Quadrant C |
| Plot type | Count rate plots | Images |
|---|---|---|
| Comparison with Poisson distribution Blue bars denote a histogram of data divided into 1 sec bins. Red curve is a Poisson curve with rate = median count rate of data. |
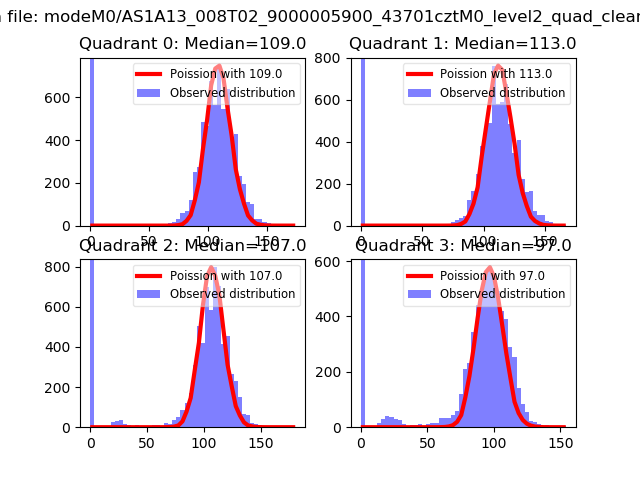 |
 |
| Quadrant-wise count rates Data is divided into 100 sec bins |
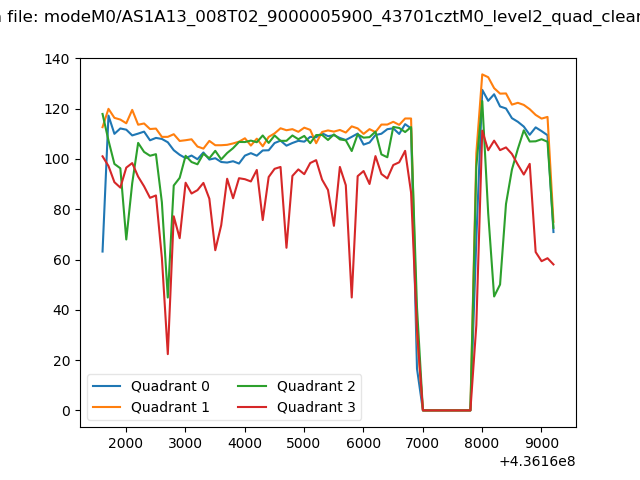 |
|
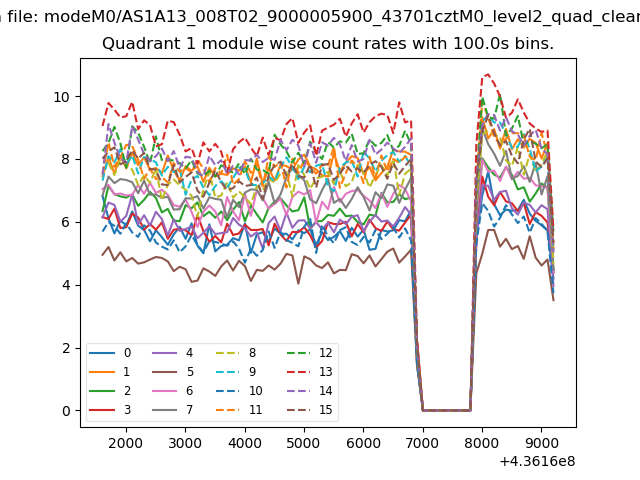
| Module-wise count rates for Quadrant A Data is divided into 100 sec bins |
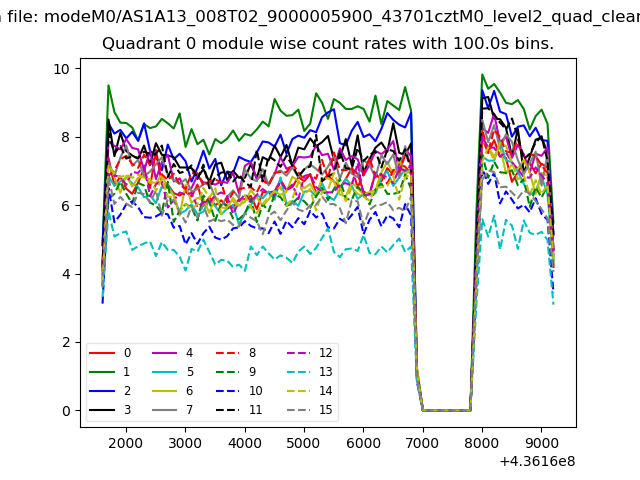 |
 |
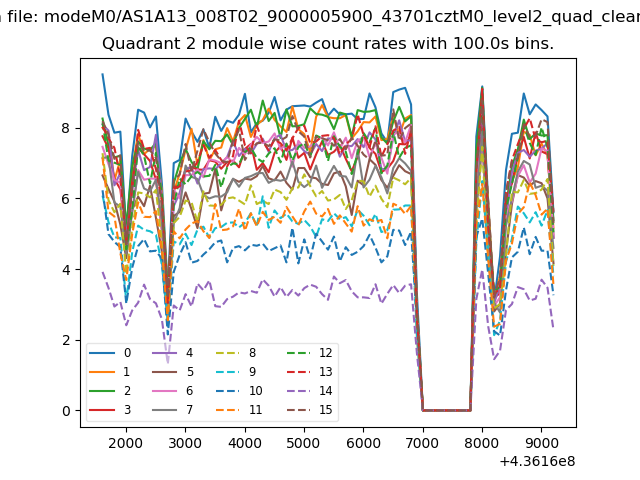
| Module-wise count rates for Quadrant B Data is divided into 100 sec bins |
 |
 |
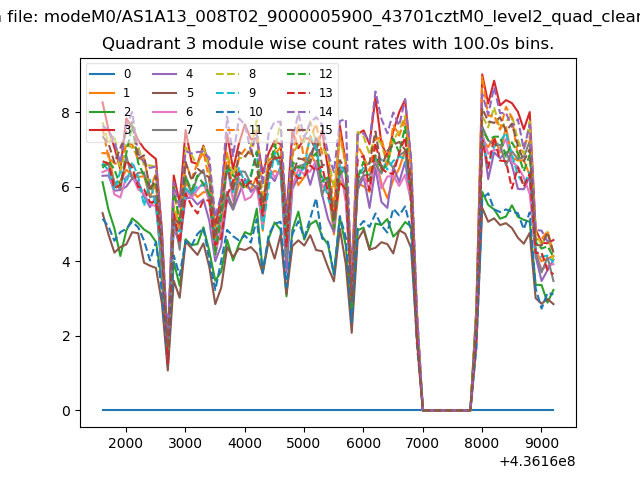
| Module-wise count rates for Quadrant C Data is divided into 100 sec bins |
 |
 |
| Module-wise count rates for Quadrant D Data is divided into 100 sec bins |
 |
 |
| Parameter | Plot |
|---|---|
| CZT HV Monitor | 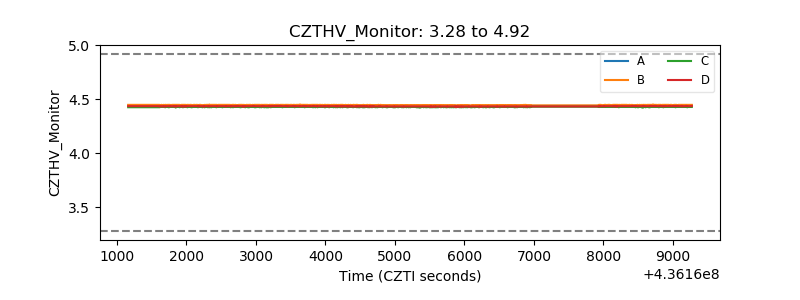 |
| D_VDD | 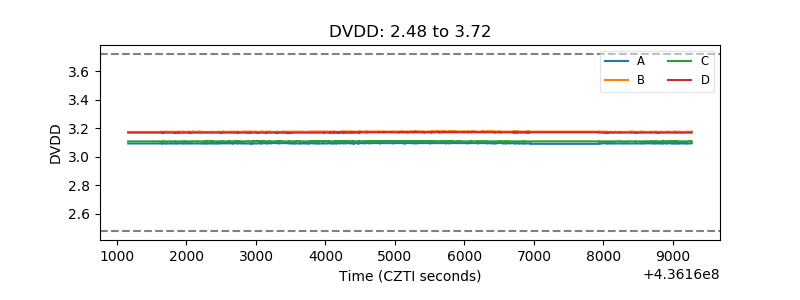 |
| Temperature 1 | 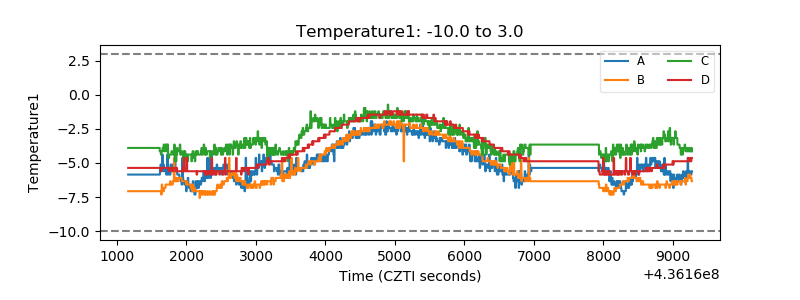 |
| Veto HV Monitor | 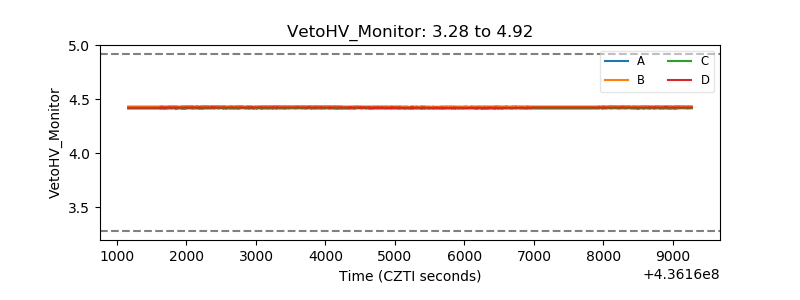 |
| Veto LLD | 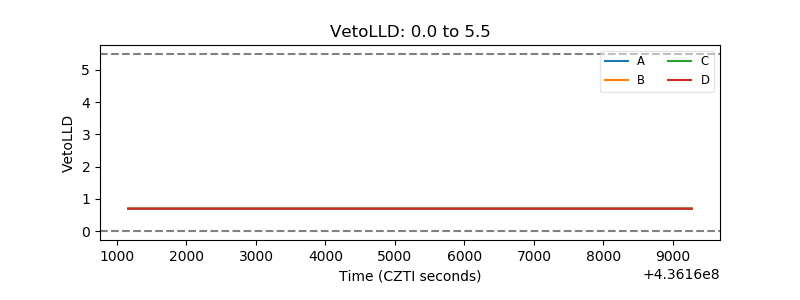 |
| Alpha Counter | 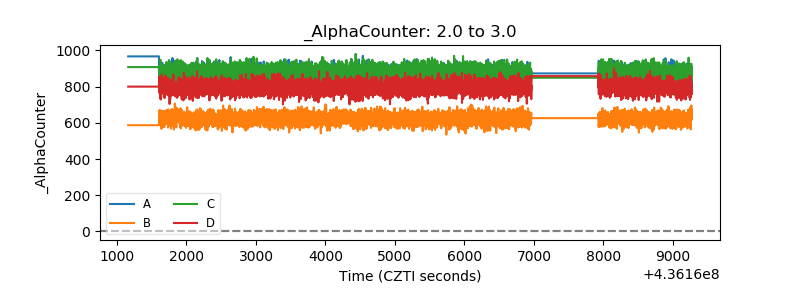 |
| _CPM_Rate | 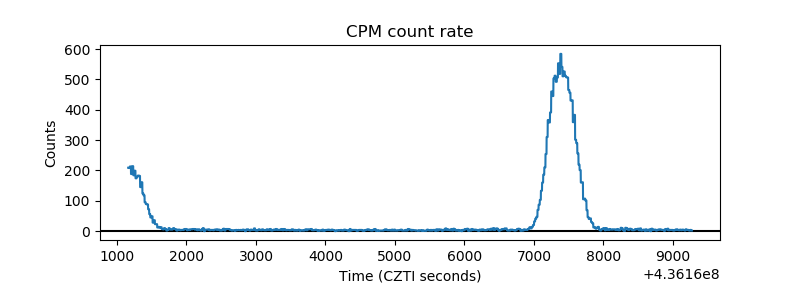 |
| CZT Counter | 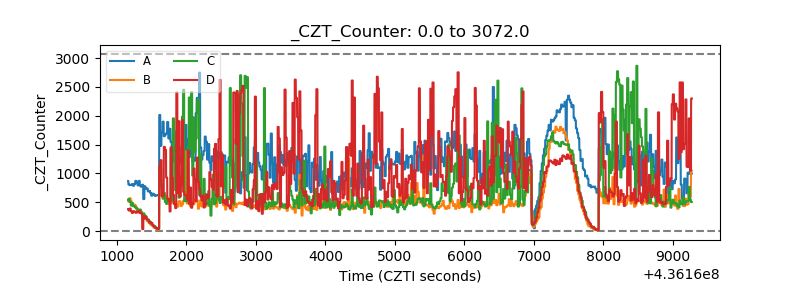 |
| +2.5 Volts monitor | 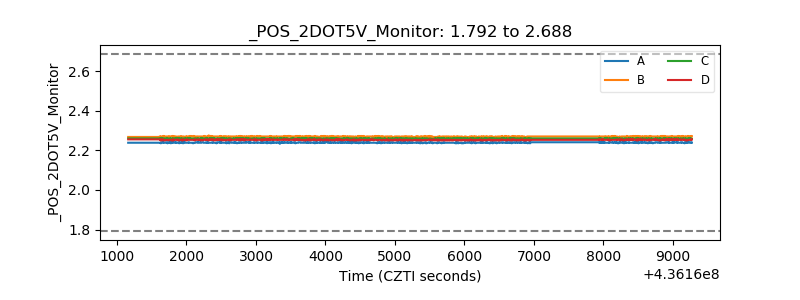 |
| +5 Volts monitor | 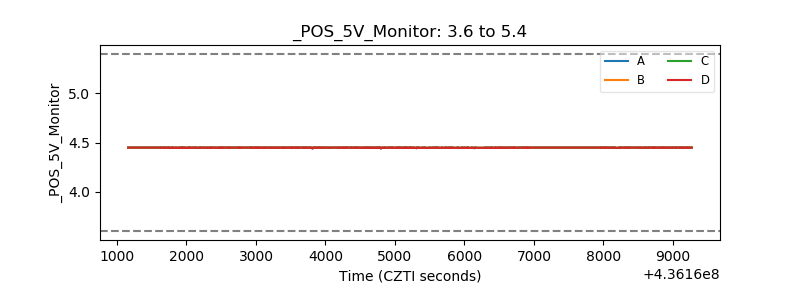 |
| _ROLL_ROT | 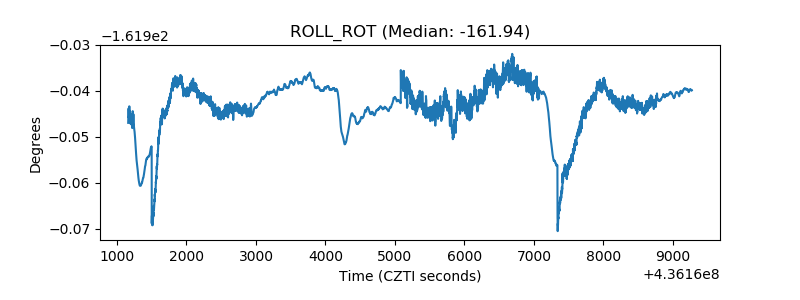 |
| _Roll_DEC | 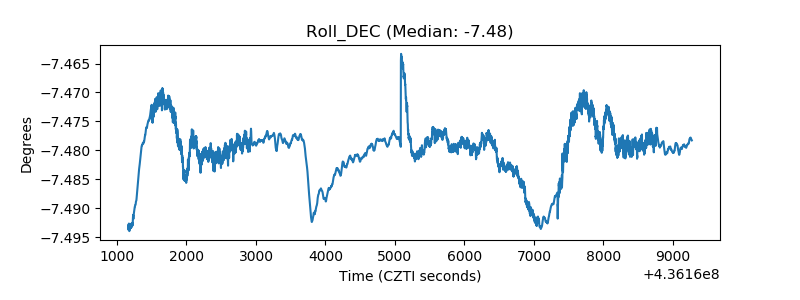 |
| _Roll_RA | 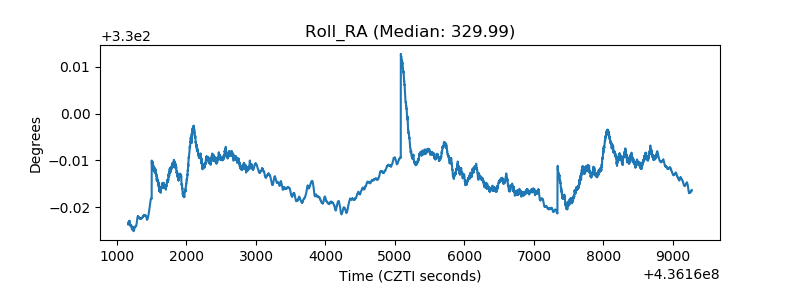 |
| Veto Counter | 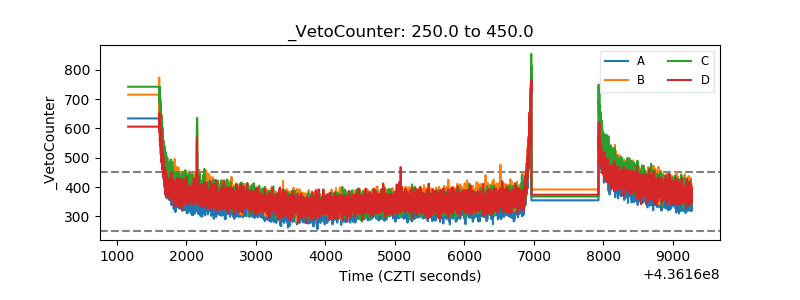 |