| Param | Original file | Final file |
|---|---|---|
| Filename | modeM0/AS1A13_008T02_9000005900_43703cztM0_level2.fits | modeM0/AS1A13_008T02_9000005900_43703cztM0_level2_quad_clean.evt |
| Size (bytes) | 680,083,200 | 107,447,040 |
| Size | 648.6 MB | 102.5 MB |
| Events in quadrant A | 8,336,406 | 721,562 |
| Events in quadrant B | 3,627,663 | 782,326 |
| Events in quadrant C | 4,852,992 | 717,325 |
| Events in quadrant D | 7,846,080 | 570,412 |
| Mode M9 | |||
|---|---|---|---|
| Quadrant | BADHDUFLAG | Total packets | Discarded packets |
| A | 0 | 11 | 0 |
| B | 0 | 12 | 0 |
| C | 0 | 12 | 0 |
| D | 0 | 12 | 0 |
| Mode M0 | |||
|---|---|---|---|
| Quadrant | BADHDUFLAG | Total packets | Discarded packets |
| A | 0 | 29494 | 2 |
| B | 0 | 15016 | 2 |
| C | 0 | 18749 | 2 |
| D | 0 | 27967 | 2 |
| Mode SS | |||
|---|---|---|---|
| Quadrant | BADHDUFLAG | Total packets | Discarded packets |
| A | 0 | 136 | 0 |
| B | 0 | 136 | 0 |
| C | 0 | 136 | 0 |
| D | 0 | 136 | 0 |
| Quadrant | Total seconds | Saturated seconds | Saturation percentage |
|---|---|---|---|
| A | 6615 | 512 | 7.739985% |
| B | 6615 | 166 | 2.509448% |
| C | 6615 | 508 | 7.679516% |
| D | 6615 | 1358 | 20.529101% |
Noise dominated data is calculated using 1-second bins in cleaned event files. If a bin has >2000 counts, and if more than 50% of those come from <1% of pixels, then it is considered to be noise-dominated and hence unusable.
| Quadrant | # 1 sec bins | Bins with >0 counts | Bins with >2000 counts | High rate bins dominated by noise | Noise dominated (total time) | Noise dominated (detector-on time) | Marked lightcurve |
|---|---|---|---|---|---|---|---|
| A | 7660 | 6616 | 177 | 177 | 2.31% | 2.68% | 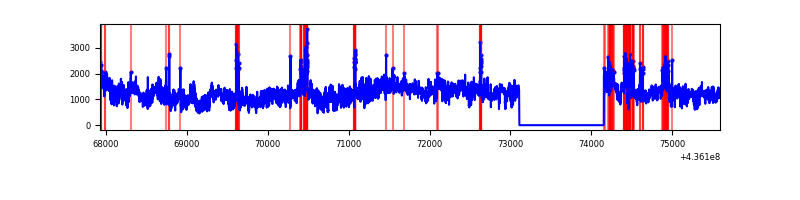 |
| B | 7660 | 6616 | 40 | 40 | 0.52% | 0.60% | 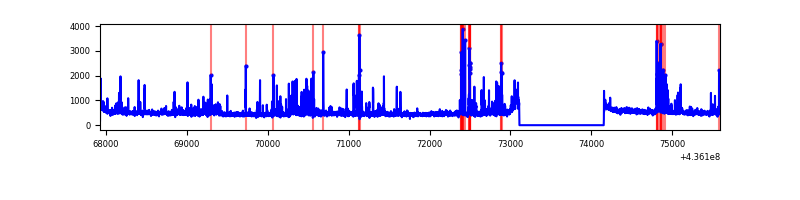 |
| C | 7660 | 6616 | 357 | 357 | 4.66% | 5.40% | 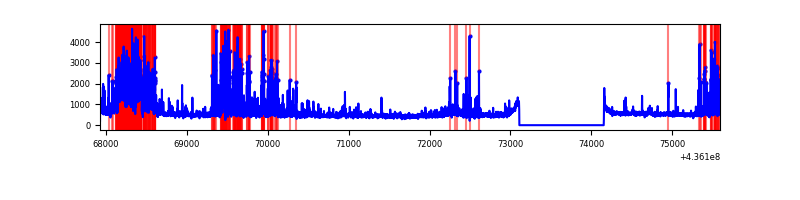 |
| D | 7660 | 6616 | 1095 | 1095 | 14.30% | 16.55% | 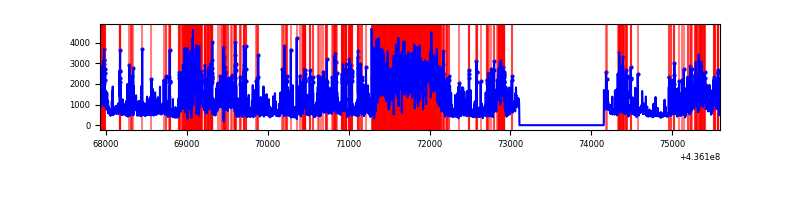 |
Top three noisy pixels from each quadrant. If the there are fewer than three noisy pixels in the level2.evt file, extra rows are filled as -1
| Pixel properties | Quadrant properties | ||||||
|---|---|---|---|---|---|---|---|
| Quadrant | DetID | PixID | Counts | Sigma | Mean | Median | Sigma |
| A | 15 | 222 | 3573599 | 22555.14 | 771 | 756 | 158.4 |
| A | 10 | 83 | 879429 | 5547.01 | 771 | 756 | 158.4 |
| A | 14 | 63 | 487777 | 3074.53 | 771 | 756 | 158.4 |
| B | 5 | 255 | 185841 | 1202.62 | 787 | 763 | 153.9 |
| B | 5 | 235 | 161211 | 1042.58 | 787 | 763 | 153.9 |
| B | 4 | 171 | 59950 | 384.59 | 787 | 763 | 153.9 |
| C | 15 | 157 | 1566806 | 8778.29 | 756 | 760 | 178.4 |
| C | 3 | 233 | 138723 | 773.33 | 756 | 760 | 178.4 |
| C | 15 | 174 | 55803 | 308.53 | 756 | 760 | 178.4 |
| D | 7 | 80 | 1099836 | 5956.77 | 721 | 698 | 184.5 |
| D | 12 | 34 | 886573 | 4800.99 | 721 | 698 | 184.5 |
| D | 13 | 138 | 498632 | 2698.55 | 721 | 698 | 184.5 |
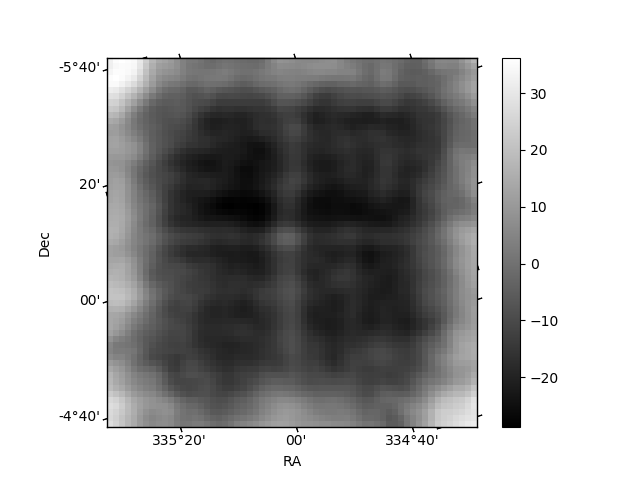
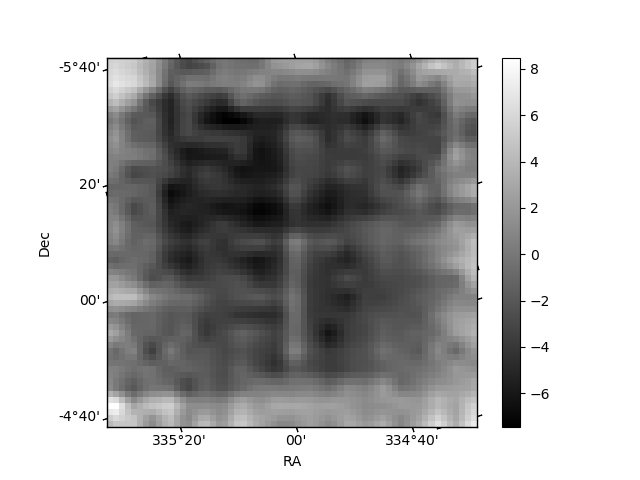
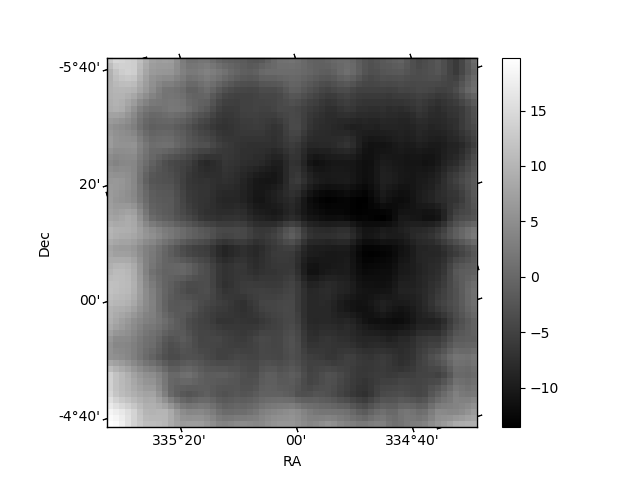
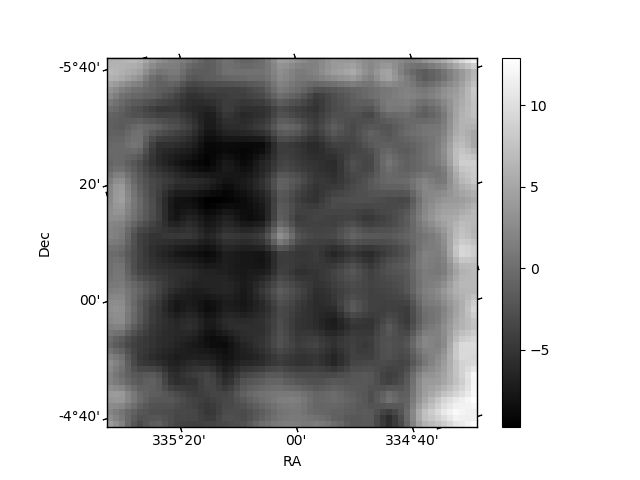
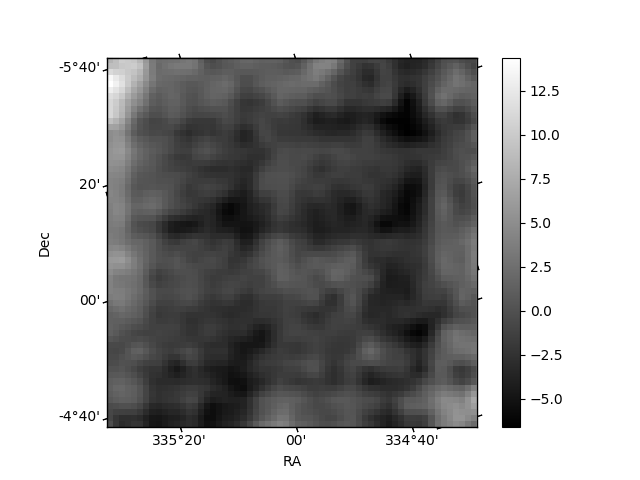
Histogram calculated using DETX and DETY for each event in the final _common_clean file
| Quadrant A | 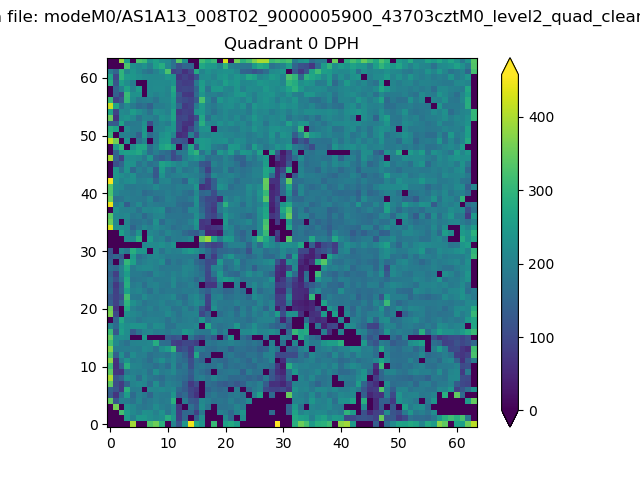 |
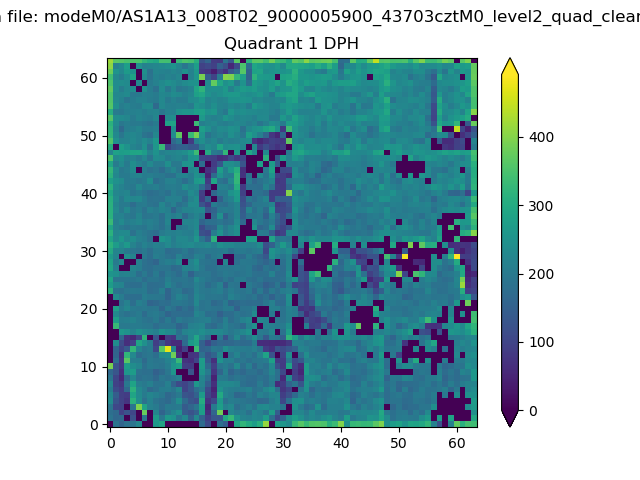 |
Quadrant B |
|---|---|---|---|
| Quadrant D | 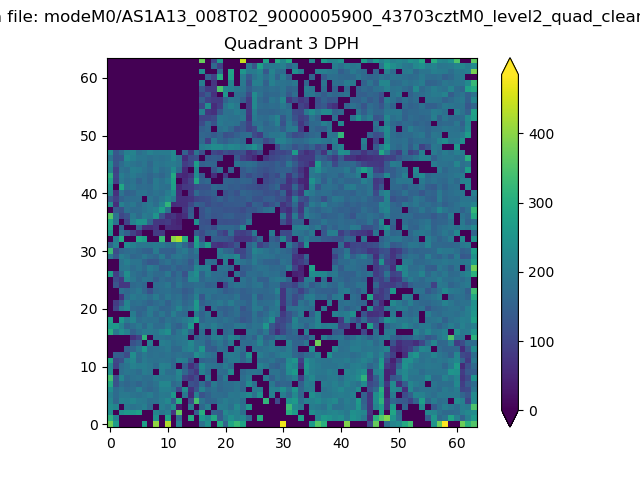 |
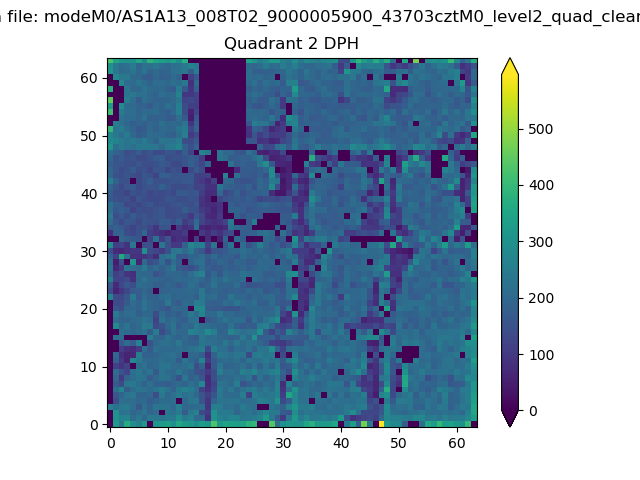 |
Quadrant C |
| Plot type | Count rate plots | Images |
|---|---|---|
| Comparison with Poisson distribution Blue bars denote a histogram of data divided into 1 sec bins. Red curve is a Poisson curve with rate = median count rate of data. |
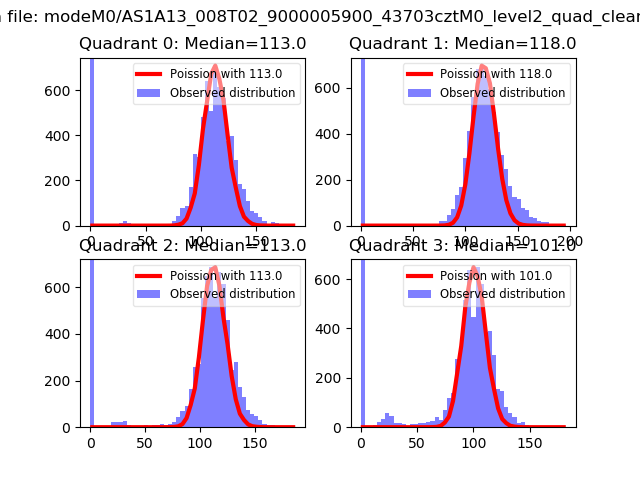 |
 |
| Quadrant-wise count rates Data is divided into 100 sec bins |
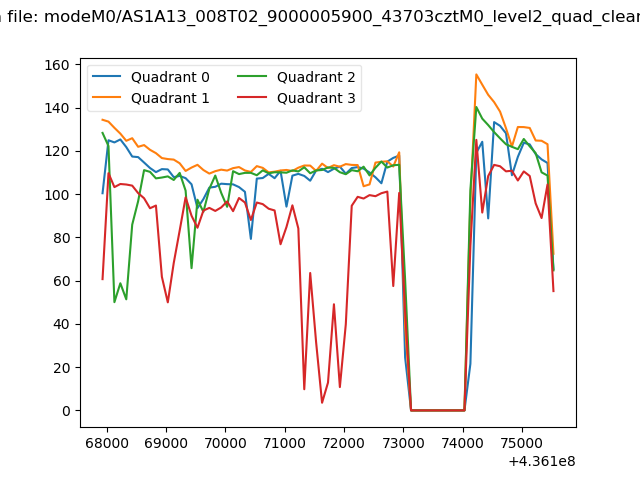 |
|
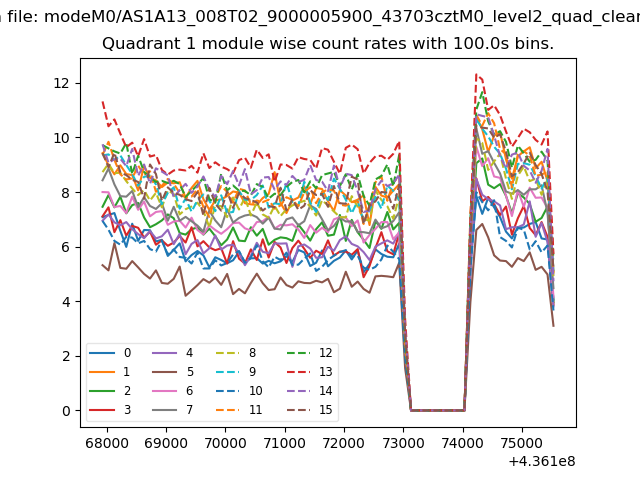
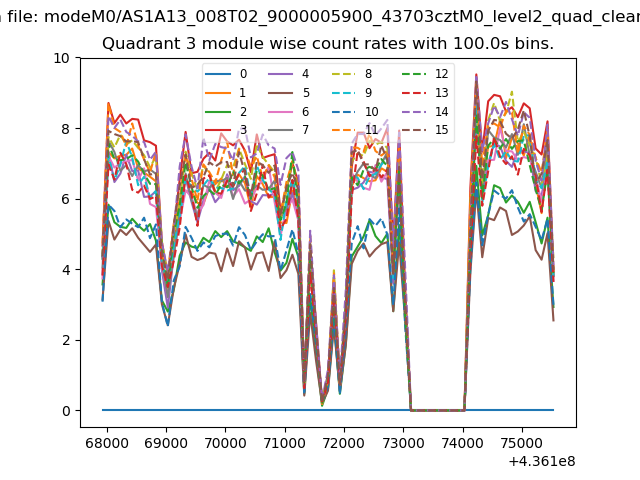
| Module-wise count rates for Quadrant A Data is divided into 100 sec bins |
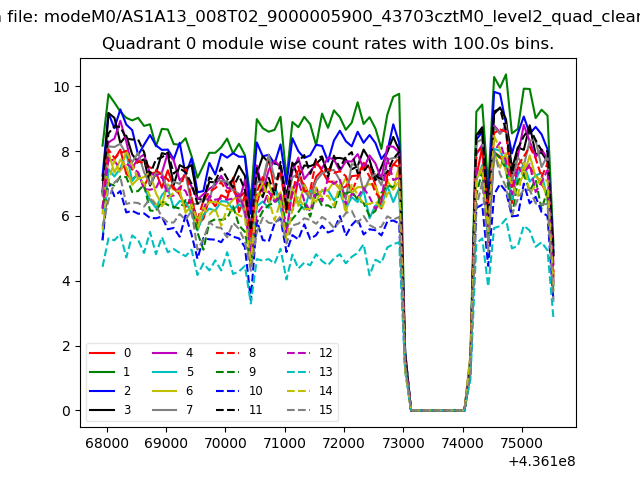 |
 |
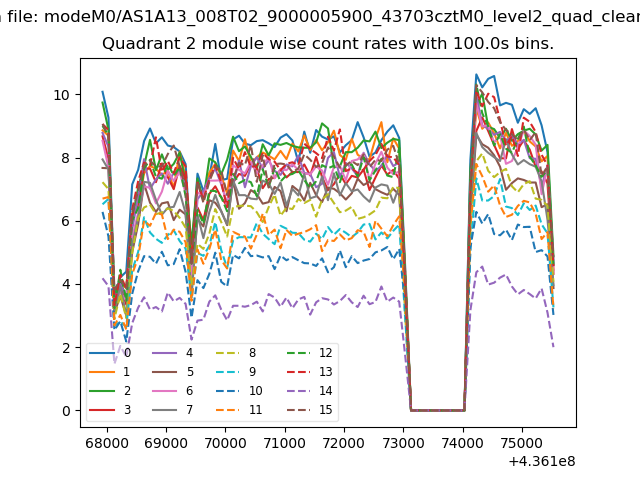
| Module-wise count rates for Quadrant B Data is divided into 100 sec bins |
 |
 |
| Module-wise count rates for Quadrant C Data is divided into 100 sec bins |
 |
 |
| Module-wise count rates for Quadrant D Data is divided into 100 sec bins |
 |
 |
| Parameter | Plot |
|---|---|
| CZT HV Monitor | 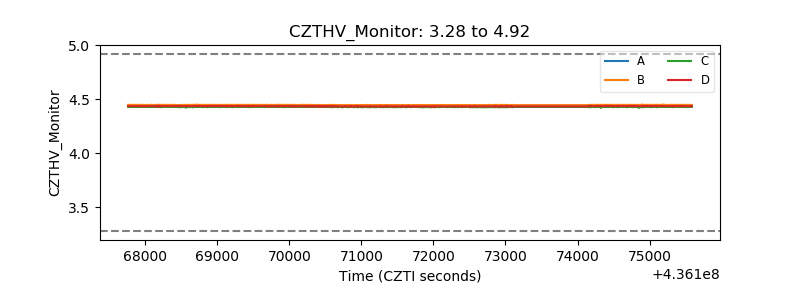 |
| D_VDD | 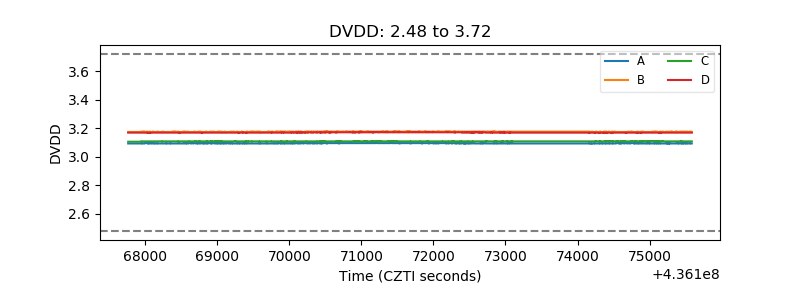 |
| Temperature 1 | 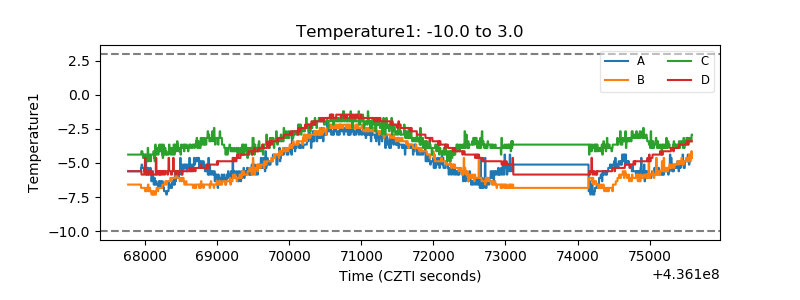 |
| Veto HV Monitor | 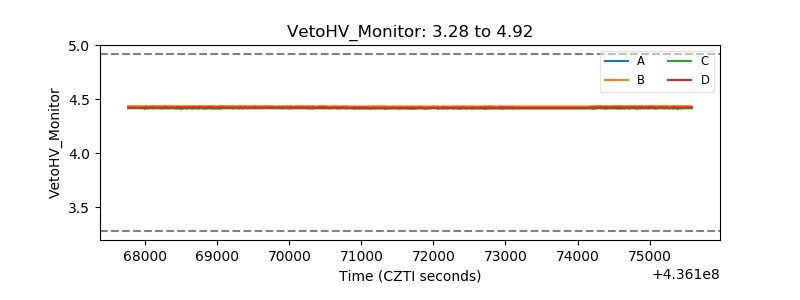 |
| Veto LLD | 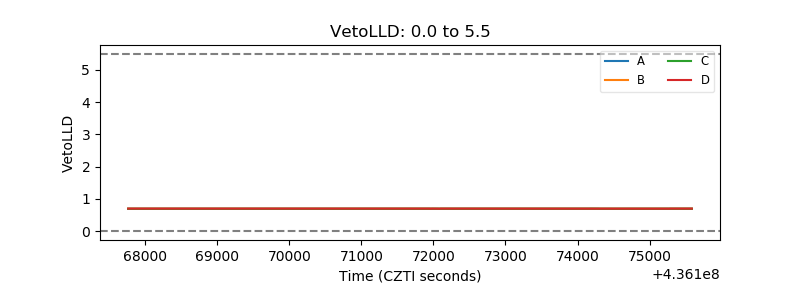 |
| Alpha Counter | 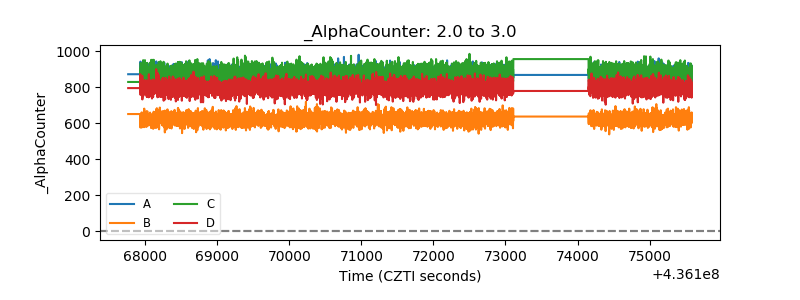 |
| _CPM_Rate | 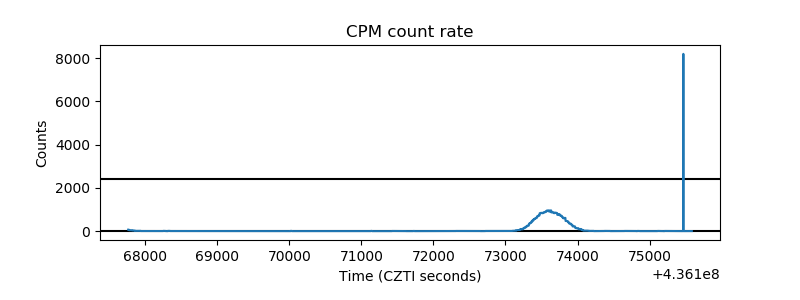 |
| CZT Counter | 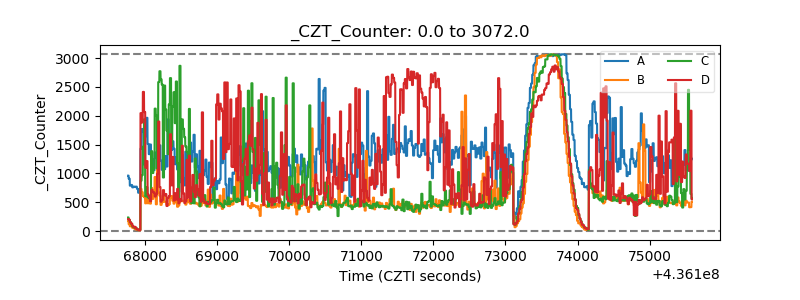 |
| +2.5 Volts monitor | 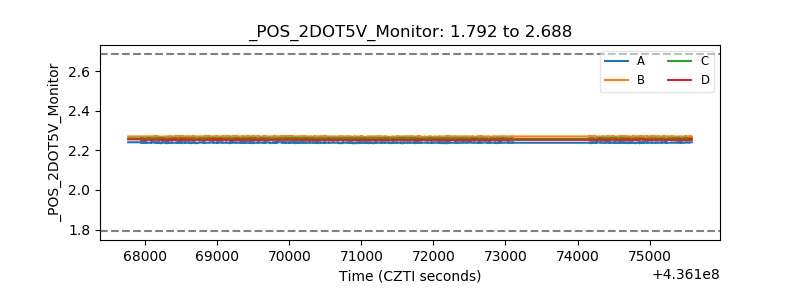 |
| +5 Volts monitor | 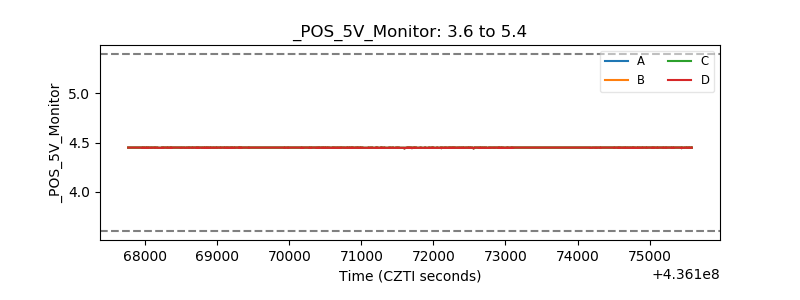 |
| _ROLL_ROT | 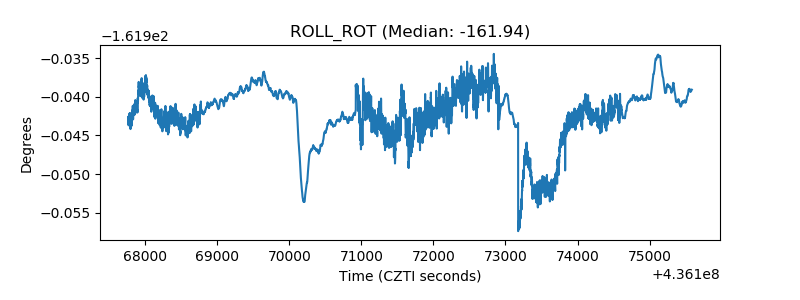 |
| _Roll_DEC | 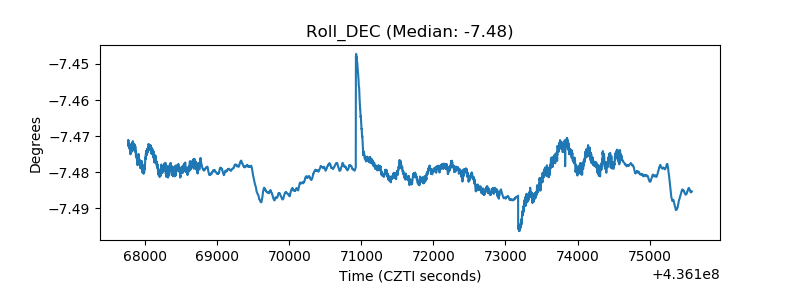 |
| _Roll_RA | 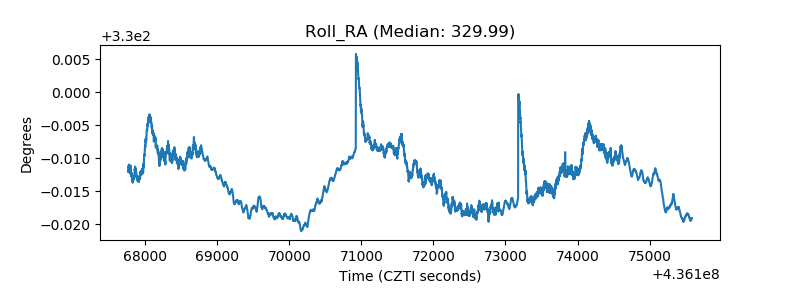 |
| Veto Counter | 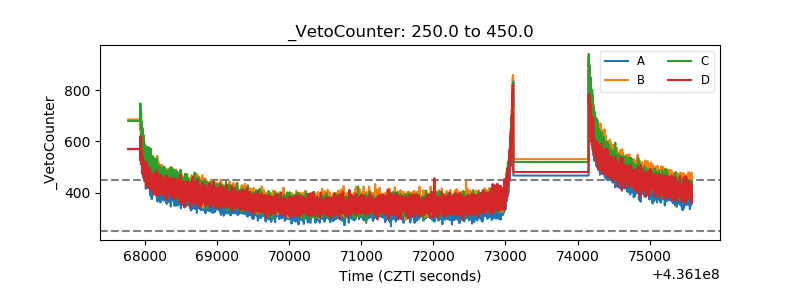 |