| Param | Original file | Final file |
|---|---|---|
| Filename | modeM0/AS1A13_008T02_9000005900_43704cztM0_level2.fits | modeM0/AS1A13_008T02_9000005900_43704cztM0_level2_quad_clean.evt |
| Size (bytes) | 738,455,040 | 107,222,400 |
| Size | 704.2 MB | 102.3 MB |
| Events in quadrant A | 8,677,648 | 742,086 |
| Events in quadrant B | 3,749,894 | 817,045 |
| Events in quadrant C | 4,392,325 | 756,527 |
| Events in quadrant D | 10,014,570 | 478,853 |
| Mode M9 | |||
|---|---|---|---|
| Quadrant | BADHDUFLAG | Total packets | Discarded packets |
| A | 0 | 11 | 0 |
| B | 0 | 11 | 0 |
| C | 0 | 11 | 0 |
| D | 0 | 11 | 0 |
| Mode M0 | |||
|---|---|---|---|
| Quadrant | BADHDUFLAG | Total packets | Discarded packets |
| A | 0 | 30380 | 1 |
| B | 0 | 15085 | 1 |
| C | 0 | 17233 | 6 |
| D | 0 | 34308 | 1 |
| Mode SS | |||
|---|---|---|---|
| Quadrant | BADHDUFLAG | Total packets | Discarded packets |
| A | 0 | 132 | 0 |
| B | 0 | 132 | 0 |
| C | 0 | 132 | 0 |
| D | 0 | 132 | 0 |
| Quadrant | Total seconds | Saturated seconds | Saturation percentage |
|---|---|---|---|
| A | 6479 | 619 | 9.553944% |
| B | 6480 | 133 | 2.052469% |
| C | 6479 | 347 | 5.355765% |
| D | 6479 | 2489 | 38.416422% |
Noise dominated data is calculated using 1-second bins in cleaned event files. If a bin has >2000 counts, and if more than 50% of those come from <1% of pixels, then it is considered to be noise-dominated and hence unusable.
| Quadrant | # 1 sec bins | Bins with >0 counts | Bins with >2000 counts | High rate bins dominated by noise | Noise dominated (total time) | Noise dominated (detector-on time) | Marked lightcurve |
|---|---|---|---|---|---|---|---|
| A | 7629 | 6480 | 254 | 254 | 3.33% | 3.92% | 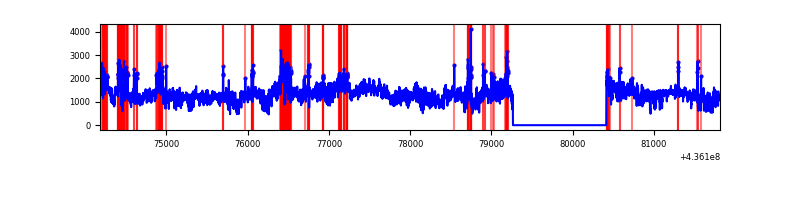 |
| B | 7630 | 6481 | 38 | 38 | 0.50% | 0.59% | 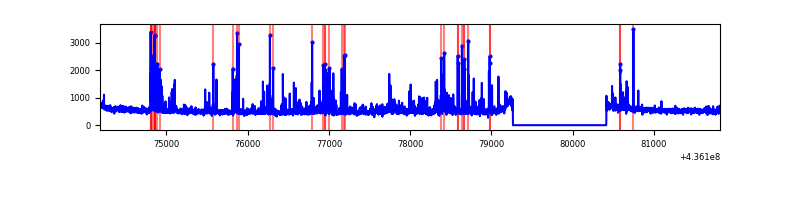 |
| C | 7629 | 6480 | 246 | 246 | 3.22% | 3.80% | 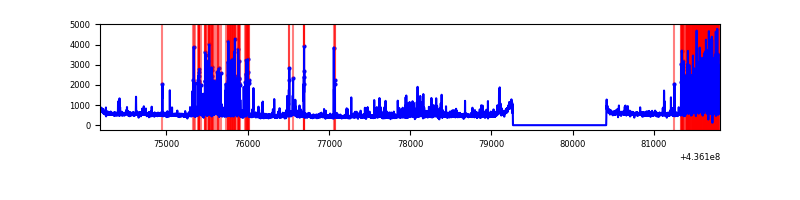 |
| D | 7629 | 6480 | 2189 | 2189 | 28.69% | 33.78% | 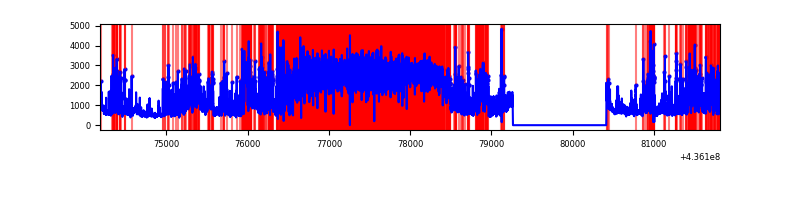 |
Top three noisy pixels from each quadrant. If the there are fewer than three noisy pixels in the level2.evt file, extra rows are filled as -1
| Pixel properties | Quadrant properties | ||||||
|---|---|---|---|---|---|---|---|
| Quadrant | DetID | PixID | Counts | Sigma | Mean | Median | Sigma |
| A | 15 | 222 | 3835572 | 23963.84 | 780 | 766 | 160.0 |
| A | 10 | 83 | 845803 | 5280.67 | 780 | 766 | 160.0 |
| A | 14 | 63 | 535275 | 3340.17 | 780 | 766 | 160.0 |
| B | 5 | 235 | 211889 | 1356.8 | 800 | 777 | 155.6 |
| B | 5 | 255 | 160967 | 1029.53 | 800 | 777 | 155.6 |
| B | 4 | 206 | 143501 | 917.27 | 800 | 777 | 155.6 |
| C | 15 | 157 | 1086487 | 6053.31 | 768 | 776 | 179.4 |
| C | 3 | 233 | 153775 | 853.04 | 768 | 776 | 179.4 |
| C | 15 | 174 | 58377 | 321.15 | 768 | 776 | 179.4 |
| D | 12 | 33 | 4276334 | 24994.54 | 653 | 630 | 171.1 |
| D | 1 | 47 | 834912 | 4876.97 | 653 | 630 | 171.1 |
| D | 8 | 48 | 384477 | 2243.86 | 653 | 630 | 171.1 |
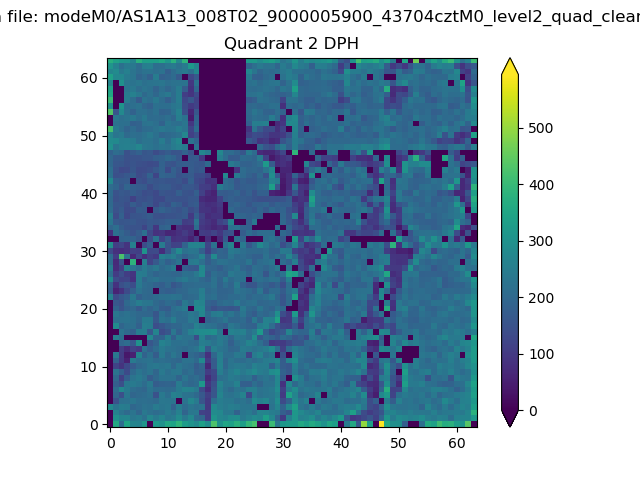
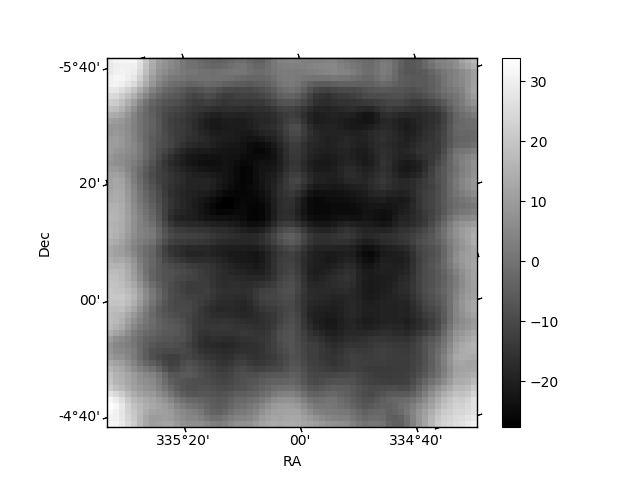
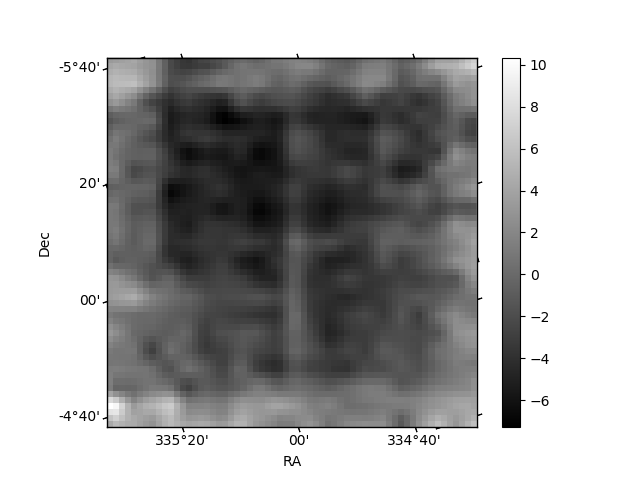
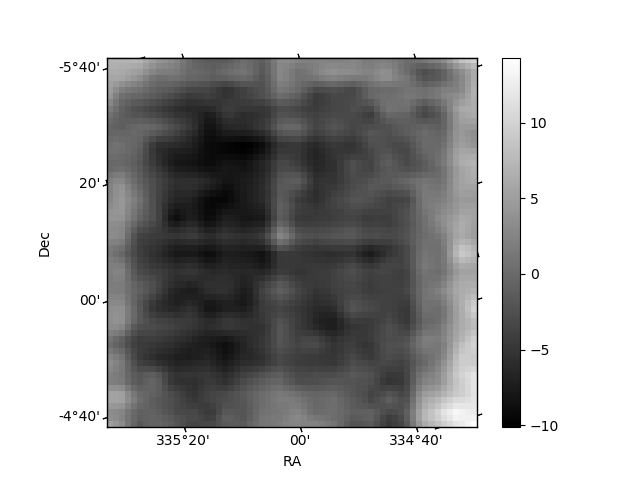
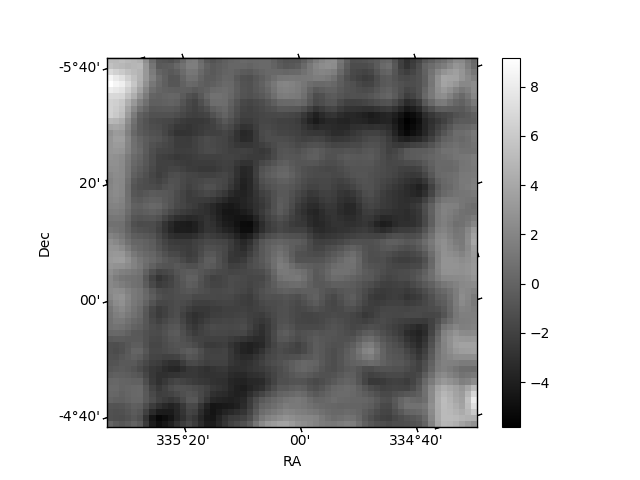
Histogram calculated using DETX and DETY for each event in the final _common_clean file
| Quadrant A | 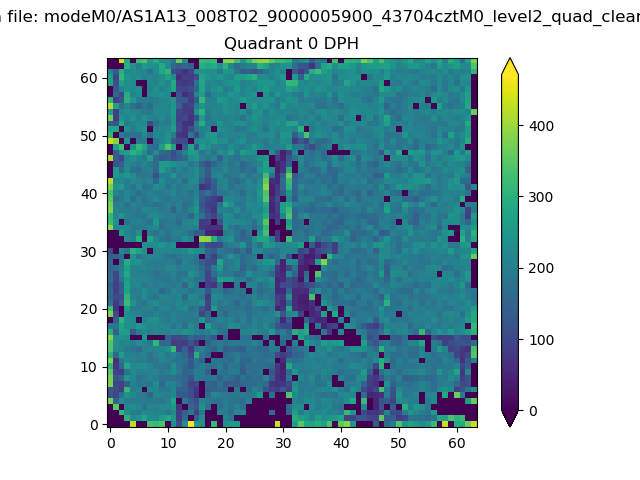 |
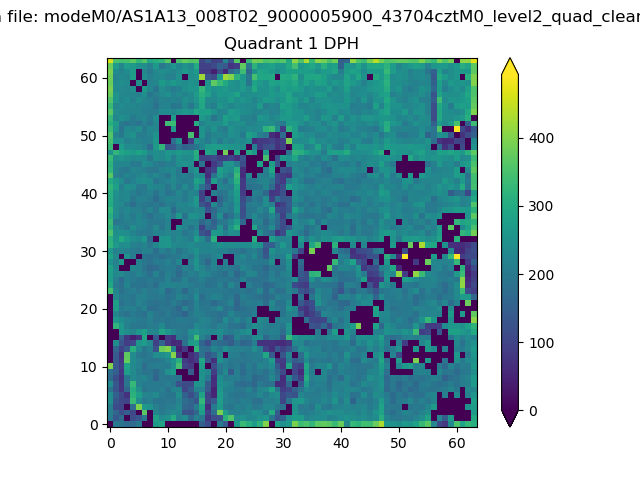 |
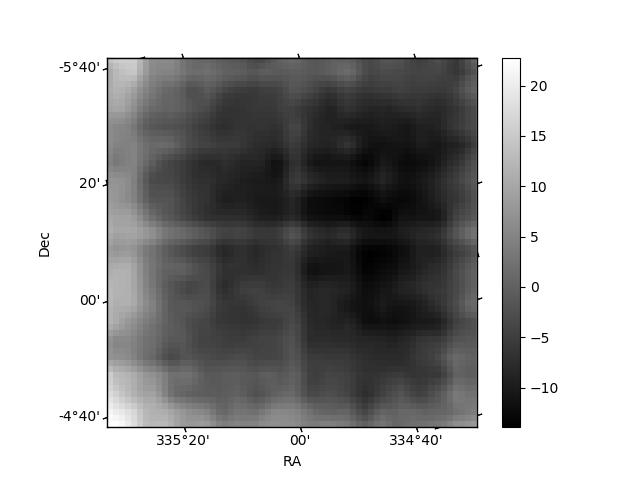
Quadrant B |
|---|---|---|---|
| Quadrant D | 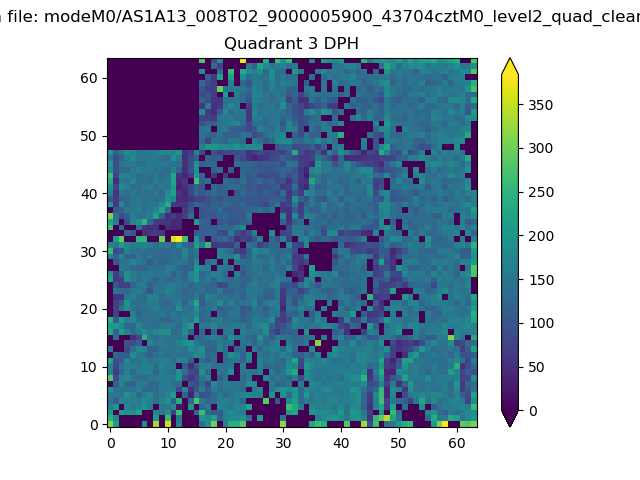 |
 |
Quadrant C |
| Plot type | Count rate plots | Images |
|---|---|---|
| Comparison with Poisson distribution Blue bars denote a histogram of data divided into 1 sec bins. Red curve is a Poisson curve with rate = median count rate of data. |
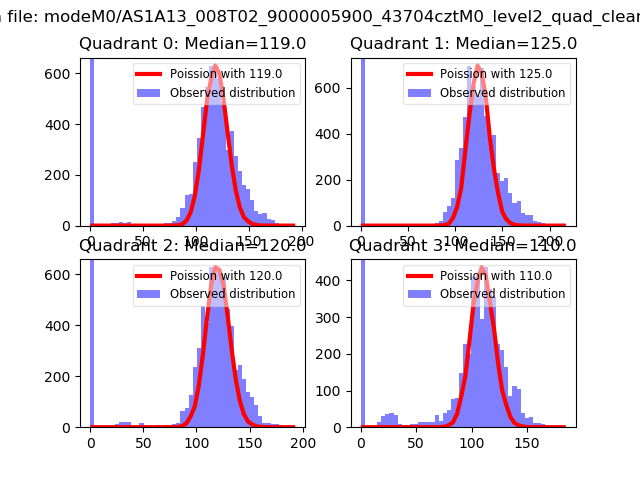 |
 |
| Quadrant-wise count rates Data is divided into 100 sec bins |
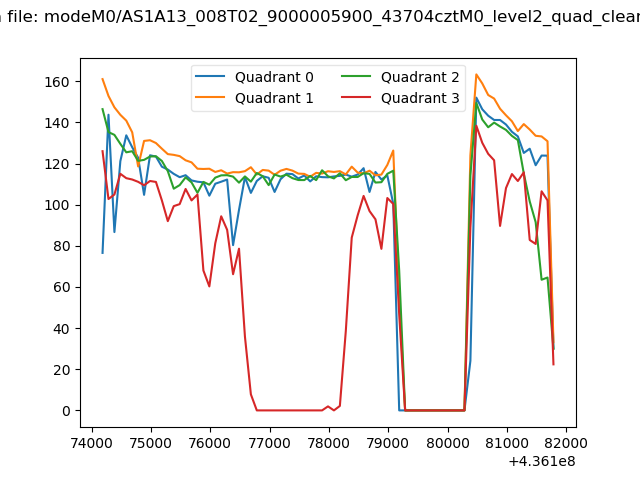 |
|
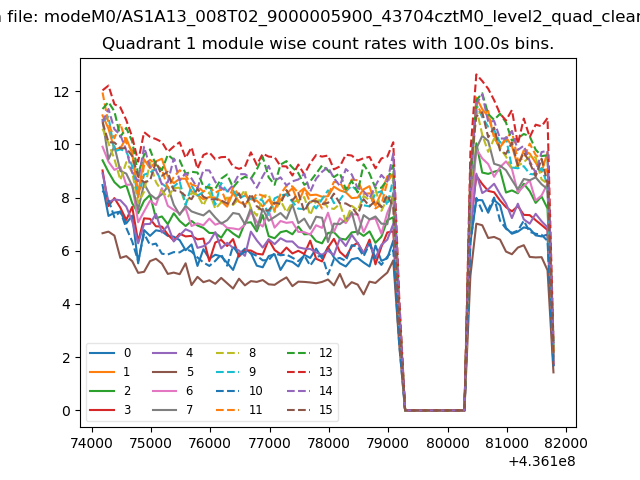
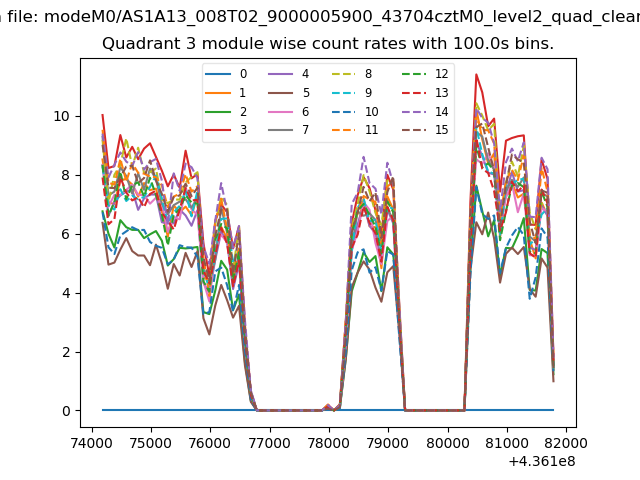
| Module-wise count rates for Quadrant A Data is divided into 100 sec bins |
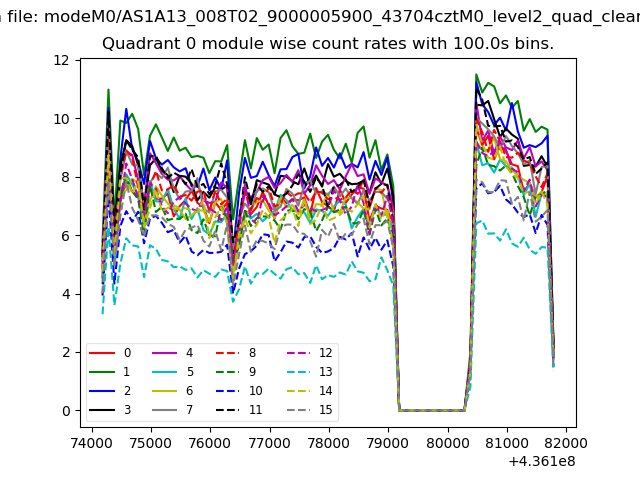 |
 |
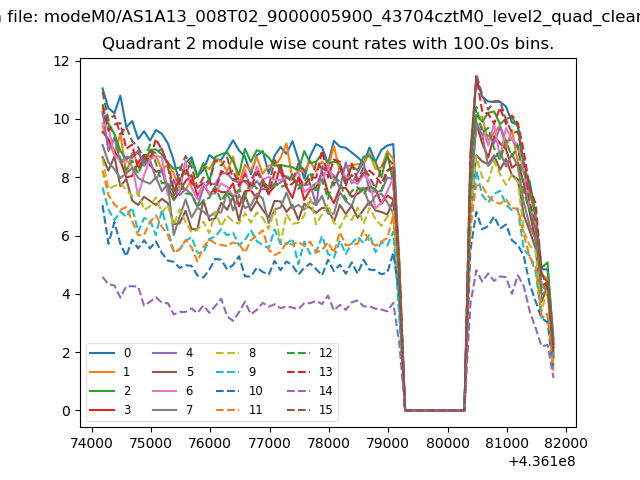
| Module-wise count rates for Quadrant B Data is divided into 100 sec bins |
 |
 |
| Module-wise count rates for Quadrant C Data is divided into 100 sec bins |
 |
 |
| Module-wise count rates for Quadrant D Data is divided into 100 sec bins |
 |
 |
| Parameter | Plot |
|---|---|
| CZT HV Monitor | 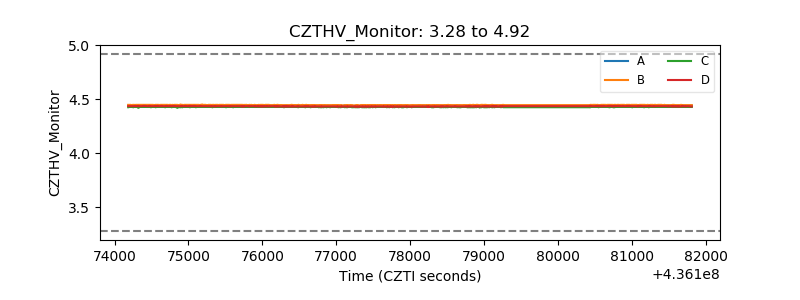 |
| D_VDD | 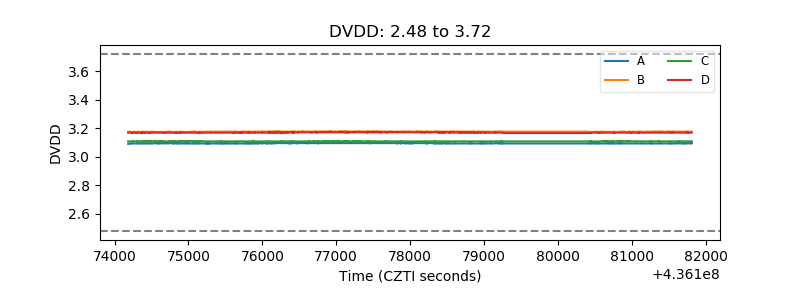 |
| Temperature 1 | 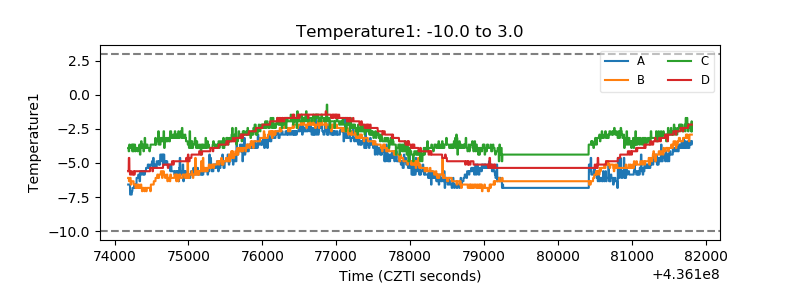 |
| Veto HV Monitor | 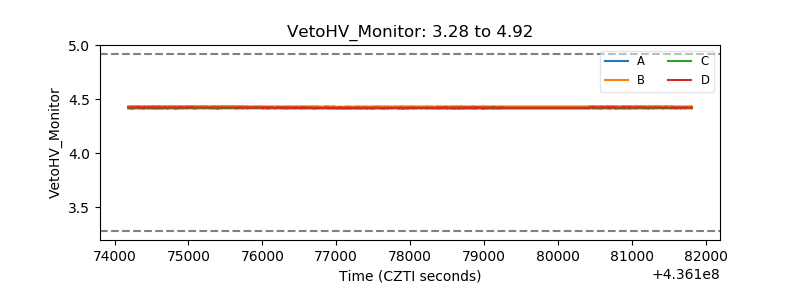 |
| Veto LLD | 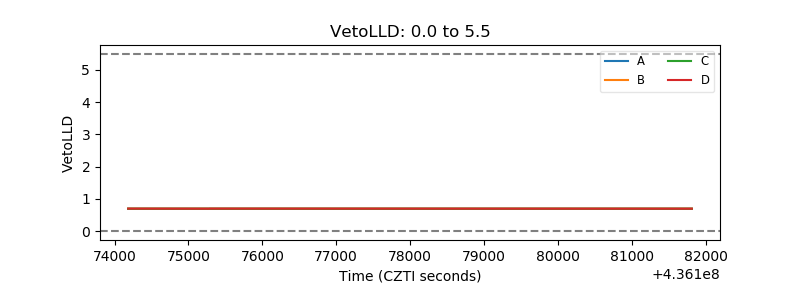 |
| Alpha Counter | 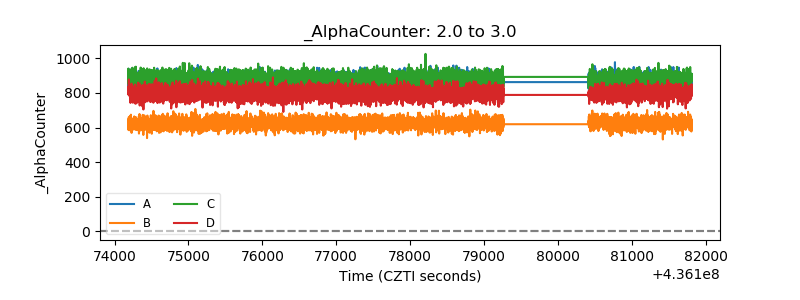 |
| _CPM_Rate | 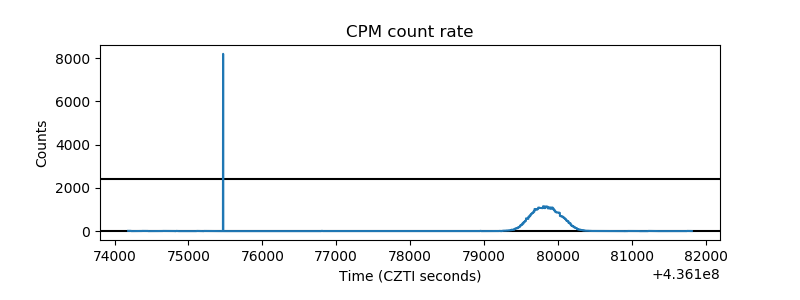 |
| CZT Counter | 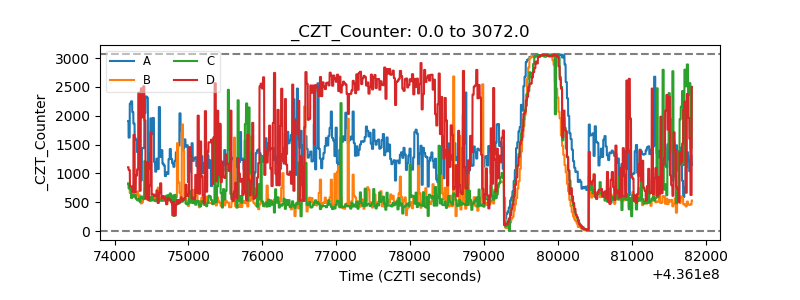 |
| +2.5 Volts monitor | 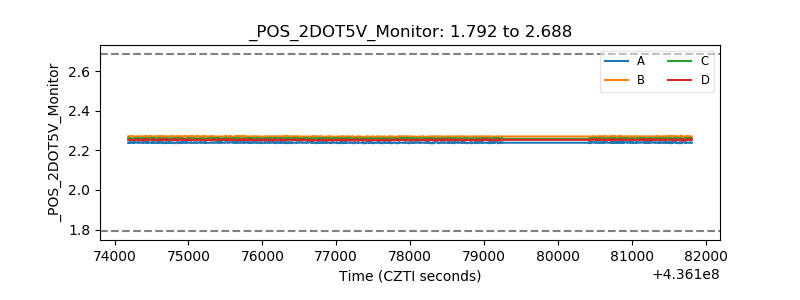 |
| +5 Volts monitor | 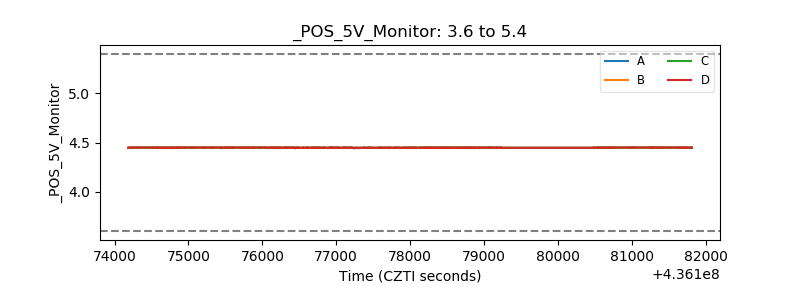 |
| _ROLL_ROT | 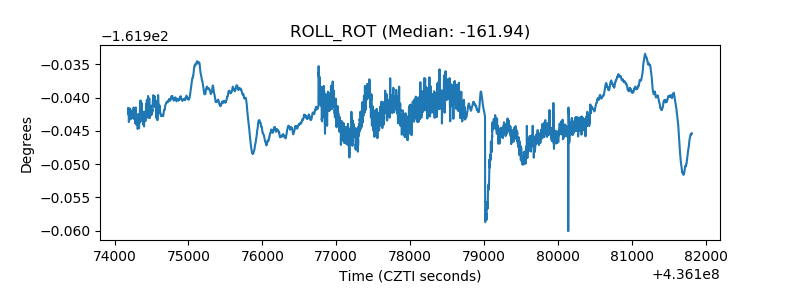 |
| _Roll_DEC | 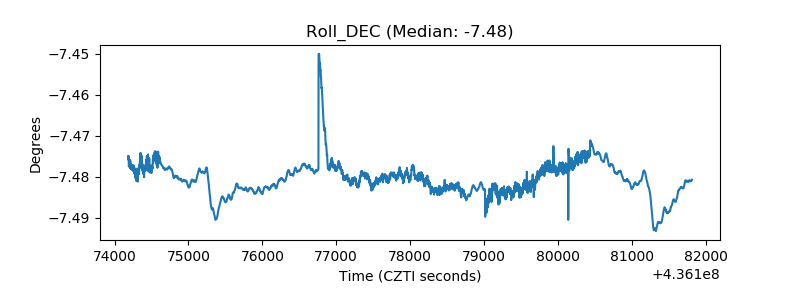 |
| _Roll_RA | 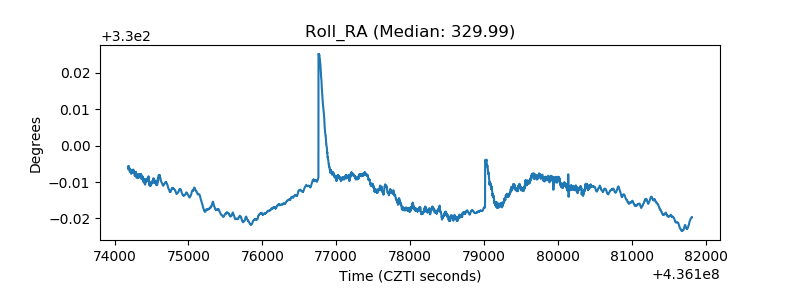 |
| Veto Counter | 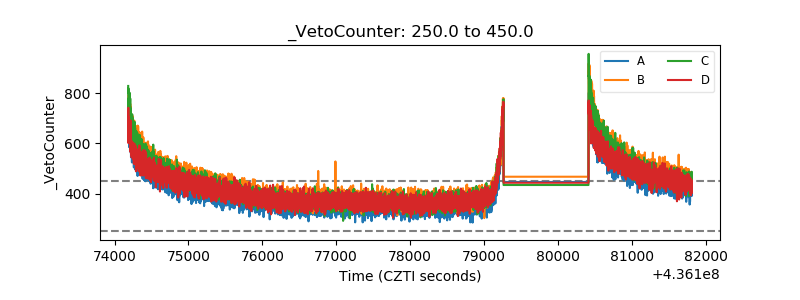 |