| Param | Original file | Final file |
|---|---|---|
| Filename | modeM0/AS1A13_008T02_9000005900_43705cztM0_level2.fits | modeM0/AS1A13_008T02_9000005900_43705cztM0_level2_quad_clean.evt |
| Size (bytes) | 691,735,680 | 98,933,760 |
| Size | 659.7 MB | 94.4 MB |
| Events in quadrant A | 7,957,587 | 694,769 |
| Events in quadrant B | 3,502,388 | 750,691 |
| Events in quadrant C | 5,267,522 | 641,345 |
| Events in quadrant D | 8,421,249 | 495,734 |
| Mode M9 | |||
|---|---|---|---|
| Quadrant | BADHDUFLAG | Total packets | Discarded packets |
| A | 0 | 12 | 0 |
| B | 0 | 12 | 0 |
| C | 0 | 12 | 0 |
| D | 0 | 12 | 0 |
| Mode M0 | |||
|---|---|---|---|
| Quadrant | BADHDUFLAG | Total packets | Discarded packets |
| A | 0 | 27837 | 1 |
| B | 0 | 13988 | 1 |
| C | 0 | 19583 | 1 |
| D | 0 | 29213 | 8 |
| Mode SS | |||
|---|---|---|---|
| Quadrant | BADHDUFLAG | Total packets | Discarded packets |
| A | 0 | 120 | 0 |
| B | 0 | 120 | 0 |
| C | 0 | 120 | 0 |
| D | 0 | 120 | 0 |
| Quadrant | Total seconds | Saturated seconds | Saturation percentage |
|---|---|---|---|
| A | 5914 | 555 | 9.384511% |
| B | 5915 | 158 | 2.671175% |
| C | 5915 | 808 | 13.660186% |
| D | 5914 | 1826 | 30.875888% |
Noise dominated data is calculated using 1-second bins in cleaned event files. If a bin has >2000 counts, and if more than 50% of those come from <1% of pixels, then it is considered to be noise-dominated and hence unusable.
| Quadrant | # 1 sec bins | Bins with >0 counts | Bins with >2000 counts | High rate bins dominated by noise | Noise dominated (total time) | Noise dominated (detector-on time) | Marked lightcurve |
|---|---|---|---|---|---|---|---|
| A | 7099 | 5915 | 175 | 175 | 2.47% | 2.96% | 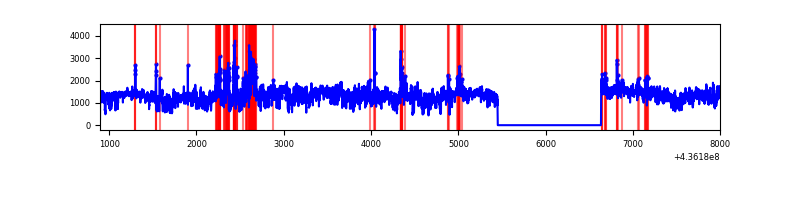 |
| B | 7100 | 5916 | 65 | 65 | 0.92% | 1.10% | 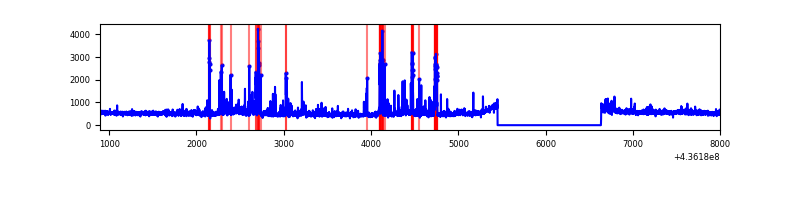 |
| C | 7100 | 5916 | 544 | 544 | 7.66% | 9.20% | 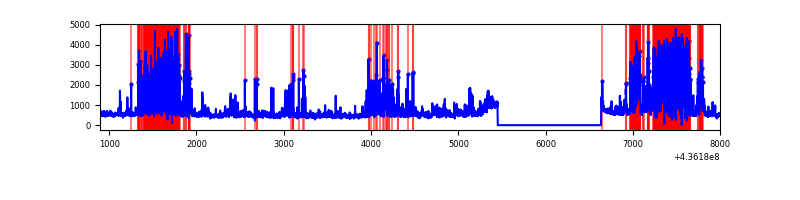 |
| D | 7099 | 5915 | 1390 | 1390 | 19.58% | 23.50% | 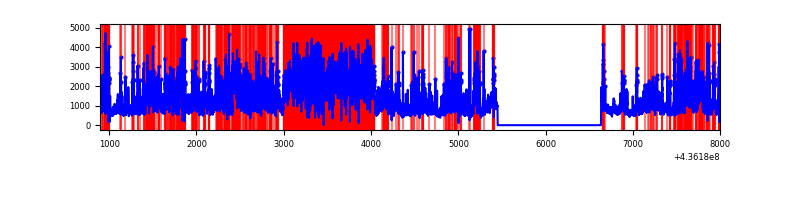 |
Top three noisy pixels from each quadrant. If the there are fewer than three noisy pixels in the level2.evt file, extra rows are filled as -1
| Pixel properties | Quadrant properties | ||||||
|---|---|---|---|---|---|---|---|
| Quadrant | DetID | PixID | Counts | Sigma | Mean | Median | Sigma |
| A | 15 | 222 | 3614181 | 24388.57 | 722 | 710 | 148.2 |
| A | 10 | 83 | 723553 | 4878.72 | 722 | 710 | 148.2 |
| A | 15 | 223 | 382291 | 2575.42 | 722 | 710 | 148.2 |
| B | 5 | 235 | 383863 | 2676.59 | 733 | 713 | 143.1 |
| B | 0 | 199 | 83334 | 577.17 | 733 | 713 | 143.1 |
| B | 4 | 206 | 63520 | 438.75 | 733 | 713 | 143.1 |
| C | 15 | 157 | 2073859 | 13410.03 | 662 | 667 | 154.6 |
| C | 3 | 233 | 335831 | 2167.94 | 662 | 667 | 154.6 |
| C | 15 | 174 | 133061 | 856.36 | 662 | 667 | 154.6 |
| D | 12 | 33 | 2792233 | 16304.22 | 619 | 601 | 171.2 |
| D | 7 | 80 | 659928 | 3850.72 | 619 | 601 | 171.2 |
| D | 13 | 249 | 336570 | 1962.19 | 619 | 601 | 171.2 |
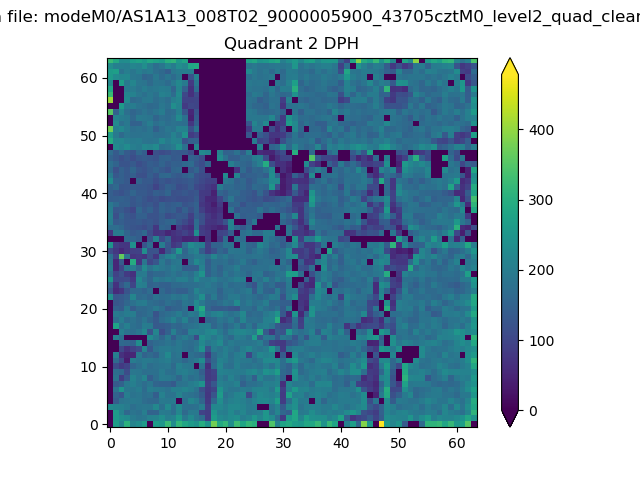
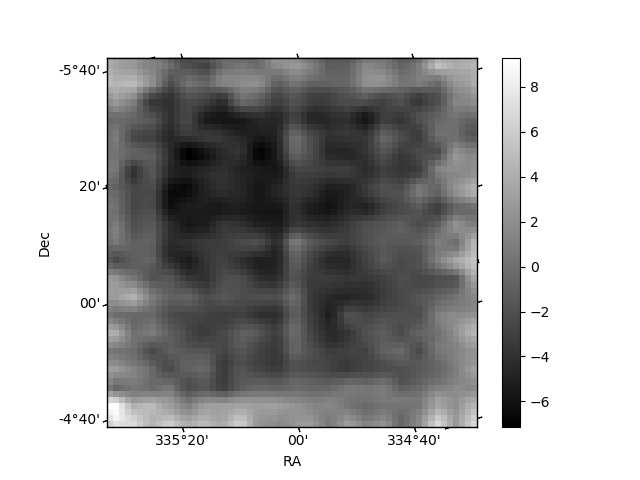
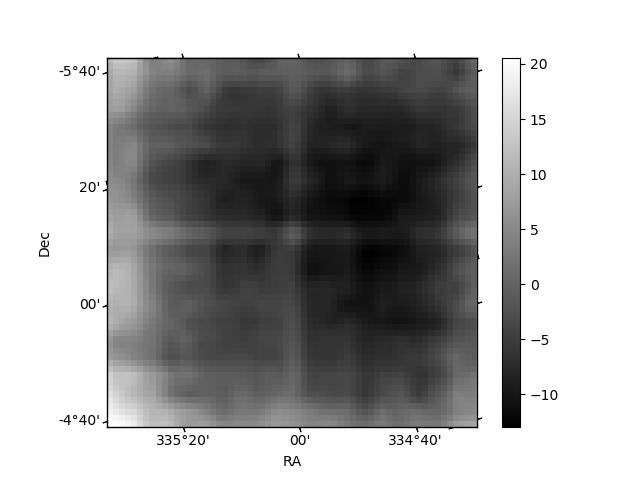
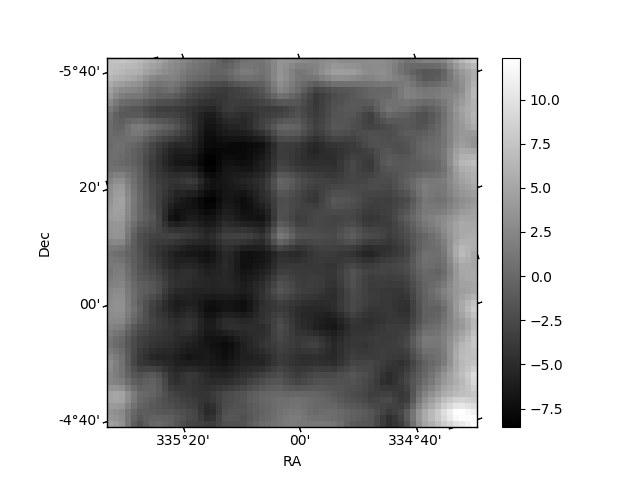
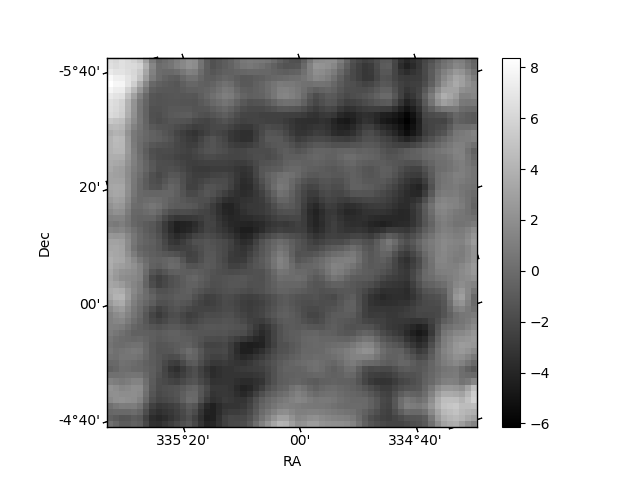
Histogram calculated using DETX and DETY for each event in the final _common_clean file
| Quadrant A | 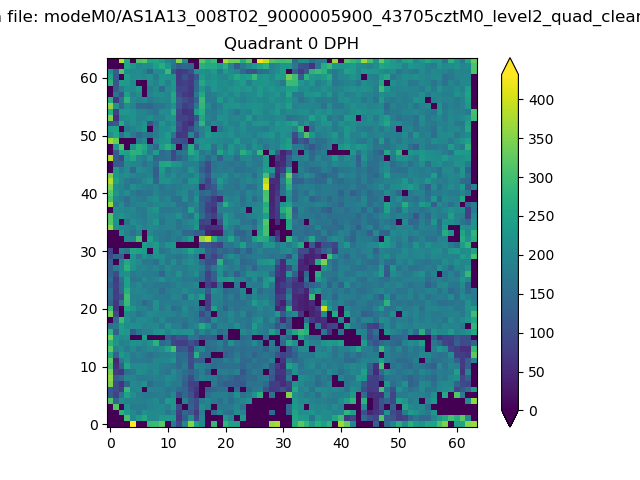 |
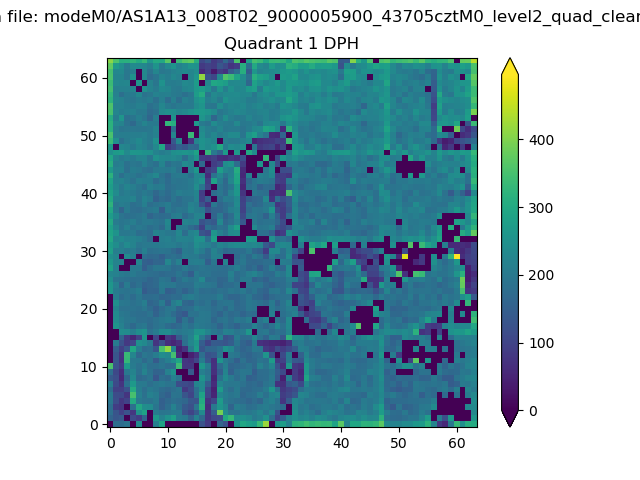 |
Quadrant B |
|---|---|---|---|
| Quadrant D | 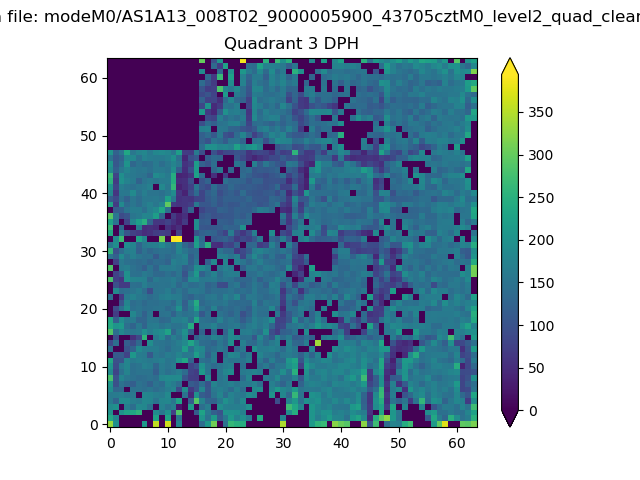 |
 |
Quadrant C |
| Plot type | Count rate plots | Images |
|---|---|---|
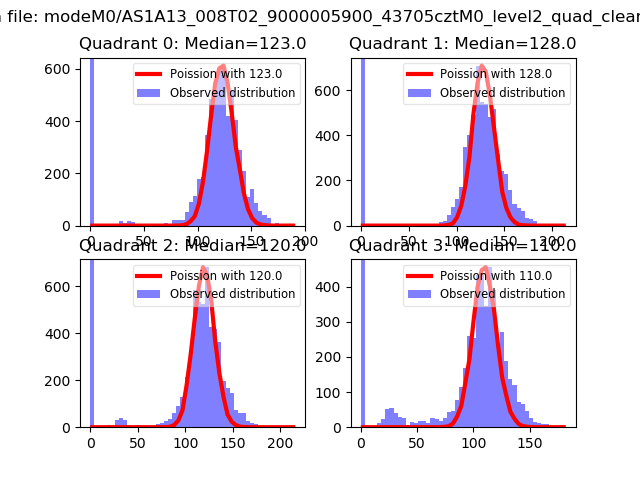
| Comparison with Poisson distribution Blue bars denote a histogram of data divided into 1 sec bins. Red curve is a Poisson curve with rate = median count rate of data. |
 |
 |
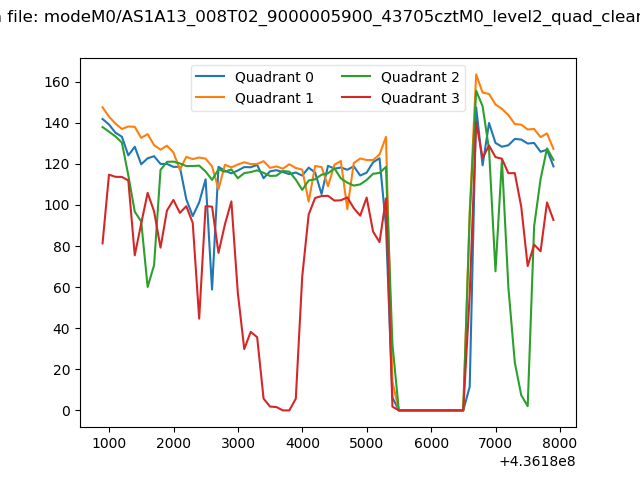
| Quadrant-wise count rates Data is divided into 100 sec bins |
 |
|
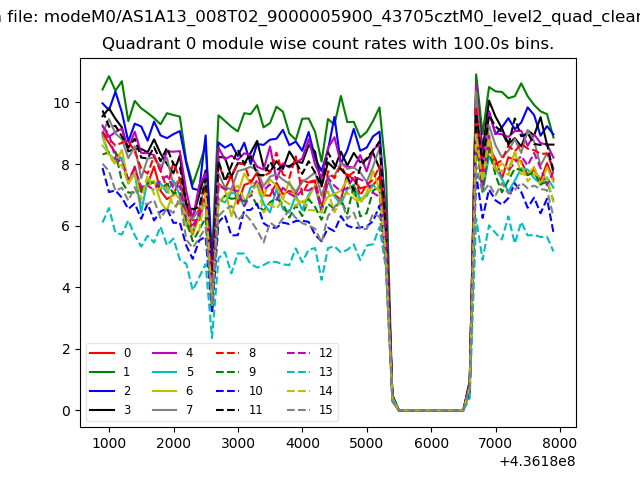
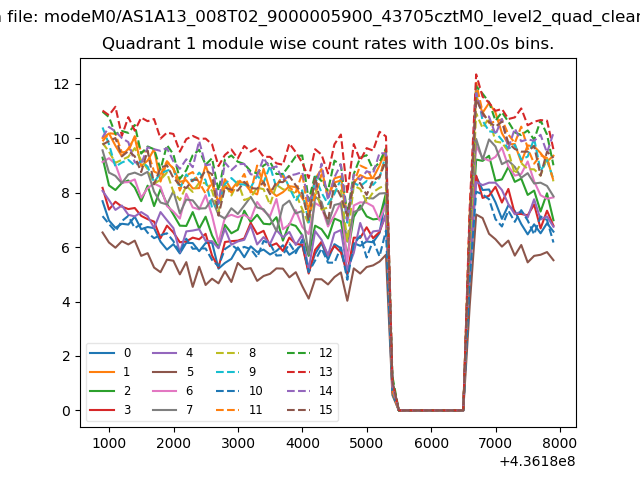
| Module-wise count rates for Quadrant A Data is divided into 100 sec bins |
 |
 |
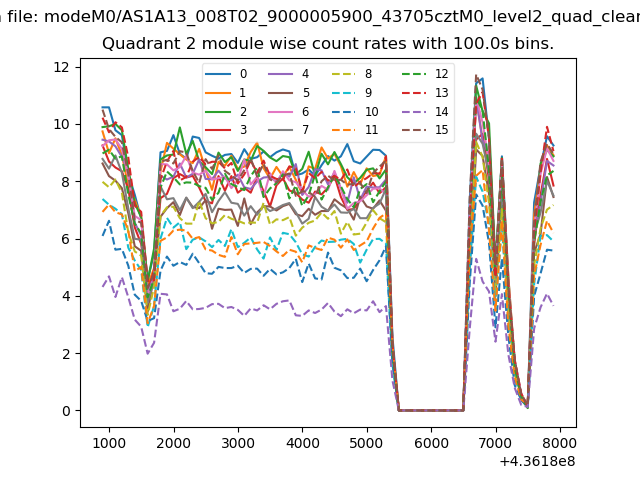
| Module-wise count rates for Quadrant B Data is divided into 100 sec bins |
 |
 |
| Module-wise count rates for Quadrant C Data is divided into 100 sec bins |
 |
 |
| Module-wise count rates for Quadrant D Data is divided into 100 sec bins |
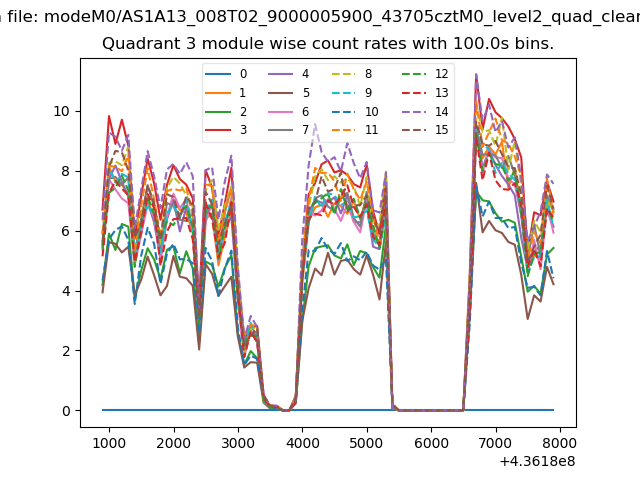 |
 |
| Parameter | Plot |
|---|---|
| CZT HV Monitor | 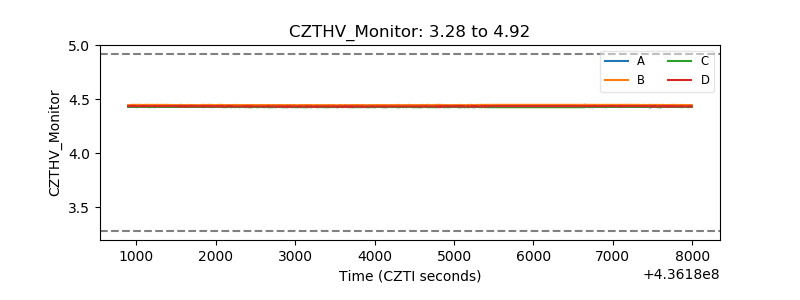 |
| D_VDD | 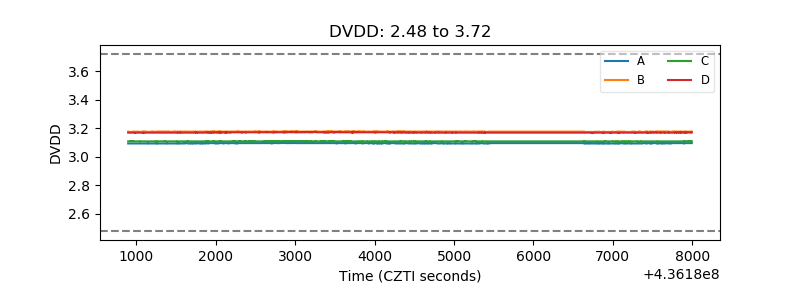 |
| Temperature 1 | 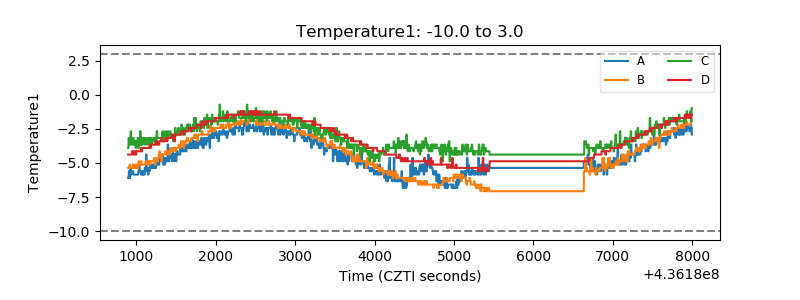 |
| Veto HV Monitor | 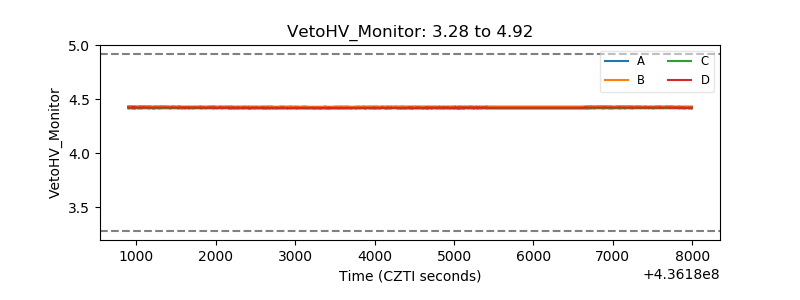 |
| Veto LLD | 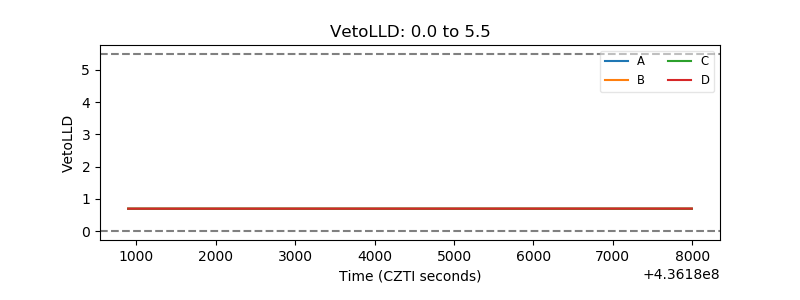 |
| Alpha Counter | 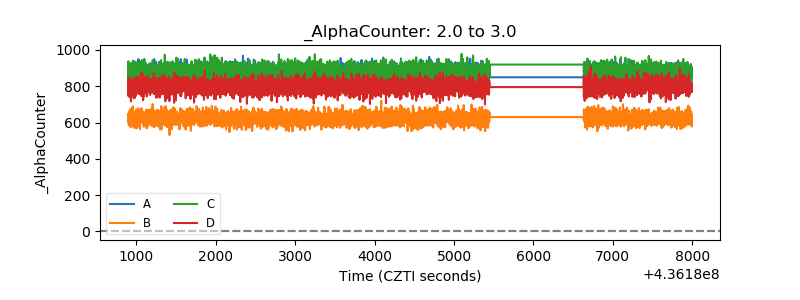 |
| _CPM_Rate | 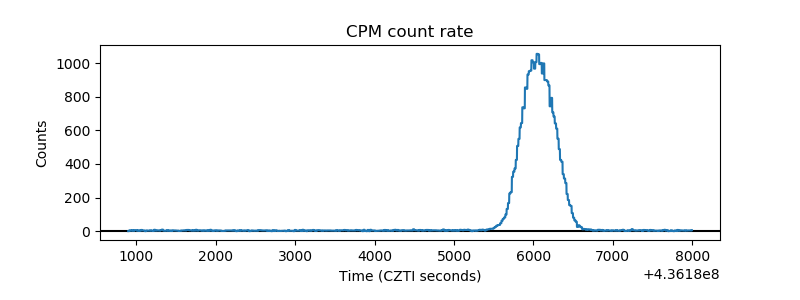 |
| CZT Counter | 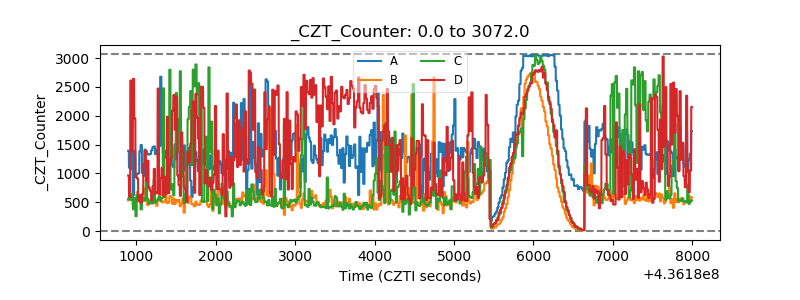 |
| +2.5 Volts monitor | 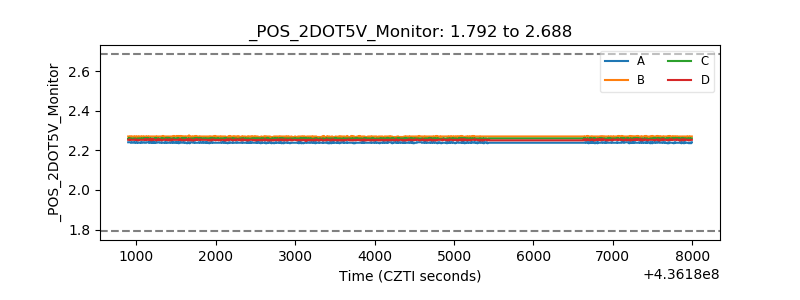 |
| +5 Volts monitor | 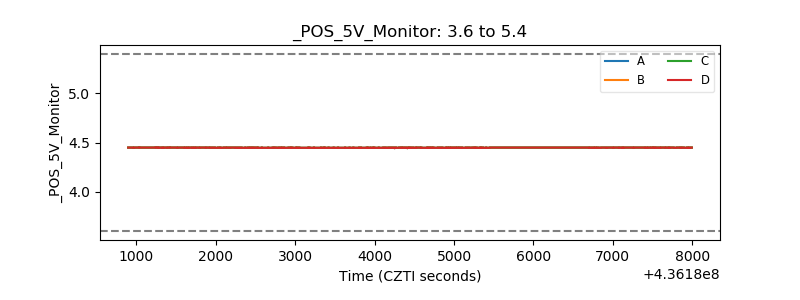 |
| _ROLL_ROT | 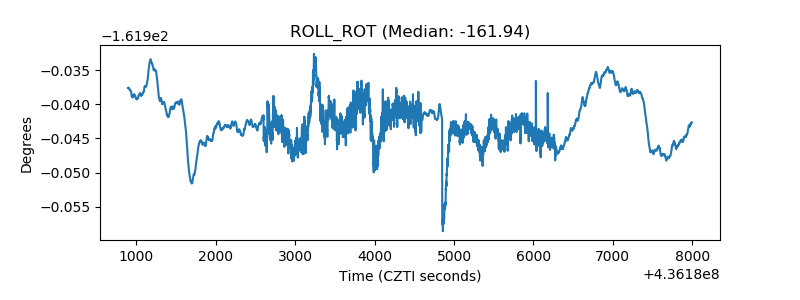 |
| _Roll_DEC | 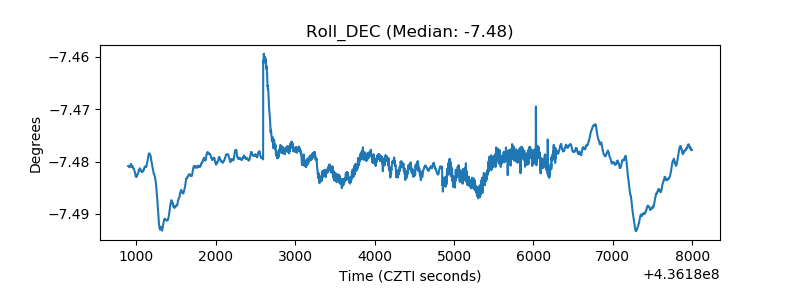 |
| _Roll_RA | 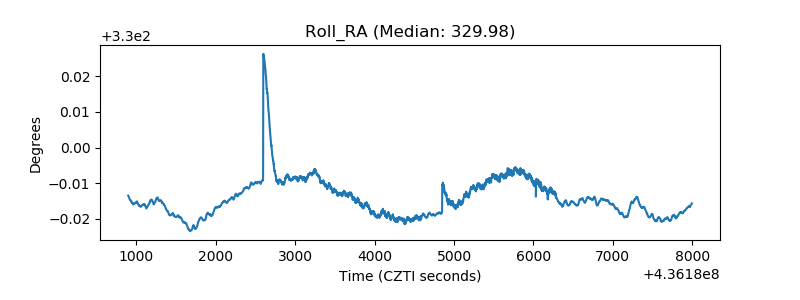 |
| Veto Counter | 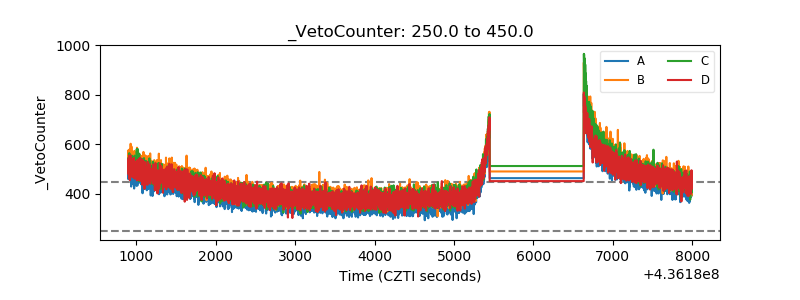 |