| Param | Original file | Final file |
|---|---|---|
| Filename | modeM0/AS1A13_008T02_9000005900_43706cztM0_level2.fits | modeM0/AS1A13_008T02_9000005900_43706cztM0_level2_quad_clean.evt |
| Size (bytes) | 750,706,560 | 108,247,680 |
| Size | 715.9 MB | 103.2 MB |
| Events in quadrant A | 9,297,761 | 747,953 |
| Events in quadrant B | 3,837,372 | 820,545 |
| Events in quadrant C | 5,495,266 | 710,497 |
| Events in quadrant D | 8,656,862 | 545,812 |
| Mode M9 | |||
|---|---|---|---|
| Quadrant | BADHDUFLAG | Total packets | Discarded packets |
| A | 0 | 19 | 0 |
| B | 0 | 20 | 0 |
| C | 0 | 20 | 0 |
| D | 0 | 20 | 0 |
| Mode M0 | |||
|---|---|---|---|
| Quadrant | BADHDUFLAG | Total packets | Discarded packets |
| A | 0 | 32192 | 3 |
| B | 0 | 15421 | 3 |
| C | 0 | 20714 | 3 |
| D | 0 | 30267 | 3 |
| Mode SS | |||
|---|---|---|---|
| Quadrant | BADHDUFLAG | Total packets | Discarded packets |
| A | 0 | 132 | 0 |
| B | 0 | 132 | 0 |
| C | 0 | 132 | 0 |
| D | 0 | 132 | 0 |
| Quadrant | Total seconds | Saturated seconds | Saturation percentage |
|---|---|---|---|
| A | 6489 | 868 | 13.376483% |
| B | 6489 | 234 | 3.606103% |
| C | 6489 | 812 | 12.513484% |
| D | 6489 | 1987 | 30.621051% |
Noise dominated data is calculated using 1-second bins in cleaned event files. If a bin has >2000 counts, and if more than 50% of those come from <1% of pixels, then it is considered to be noise-dominated and hence unusable.
| Quadrant | # 1 sec bins | Bins with >0 counts | Bins with >2000 counts | High rate bins dominated by noise | Noise dominated (total time) | Noise dominated (detector-on time) | Marked lightcurve |
|---|---|---|---|---|---|---|---|
| A | 7619 | 6490 | 128 | 128 | 1.68% | 1.97% | 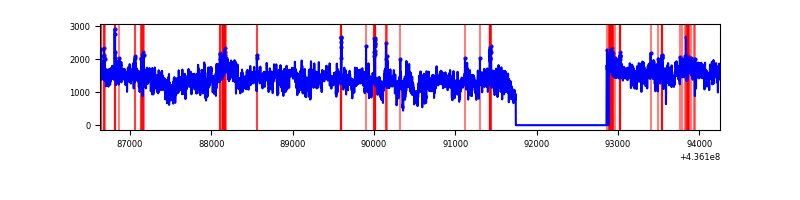 |
| B | 7619 | 6490 | 64 | 64 | 0.84% | 0.99% | 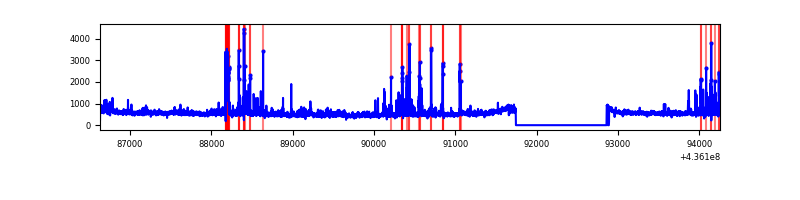 |
| C | 7619 | 6490 | 503 | 503 | 6.60% | 7.75% | 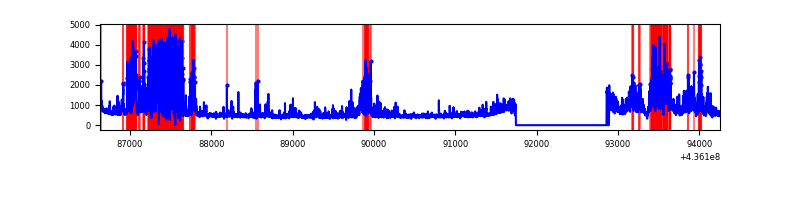 |
| D | 7619 | 6490 | 1361 | 1361 | 17.86% | 20.97% | 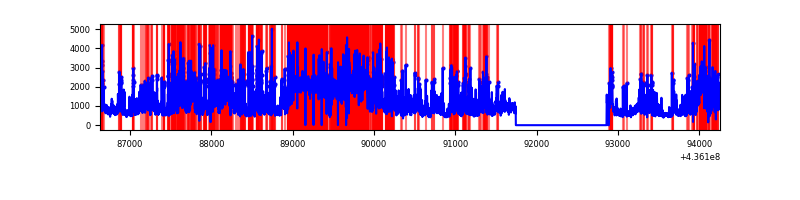 |
Top three noisy pixels from each quadrant. If the there are fewer than three noisy pixels in the level2.evt file, extra rows are filled as -1
| Pixel properties | Quadrant properties | ||||||
|---|---|---|---|---|---|---|---|
| Quadrant | DetID | PixID | Counts | Sigma | Mean | Median | Sigma |
| A | 15 | 222 | 4514841 | 27314.45 | 798 | 783 | 165.3 |
| A | 10 | 83 | 913307 | 5521.66 | 798 | 783 | 165.3 |
| A | 14 | 63 | 536319 | 3240.51 | 798 | 783 | 165.3 |
| B | 5 | 235 | 364191 | 2283.48 | 812 | 788 | 159.1 |
| B | 4 | 206 | 97173 | 605.64 | 812 | 788 | 159.1 |
| B | 0 | 199 | 71802 | 446.22 | 812 | 788 | 159.1 |
| C | 15 | 157 | 1830355 | 10500.96 | 747 | 752 | 174.2 |
| C | 3 | 233 | 656145 | 3761.61 | 747 | 752 | 174.2 |
| C | 15 | 173 | 28863 | 161.34 | 747 | 752 | 174.2 |
| D | 12 | 33 | 3463976 | 17945.15 | 681 | 664 | 193.0 |
| D | 7 | 80 | 498690 | 2580.52 | 681 | 664 | 193.0 |
| D | 13 | 249 | 377258 | 1951.32 | 681 | 664 | 193.0 |
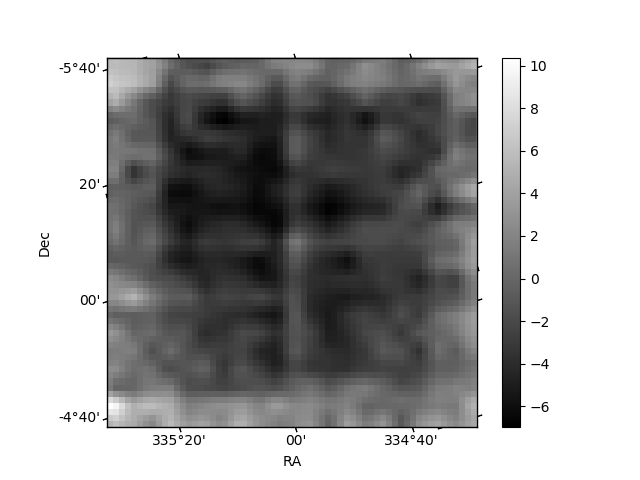
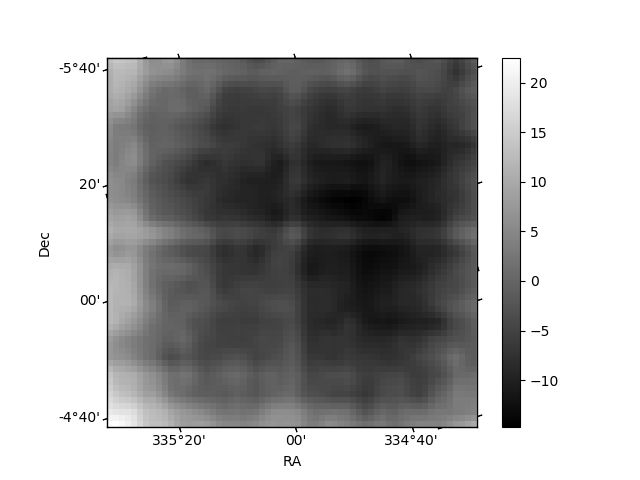
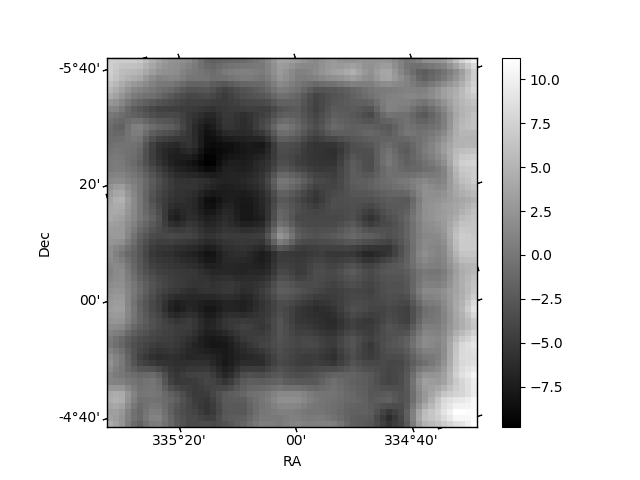
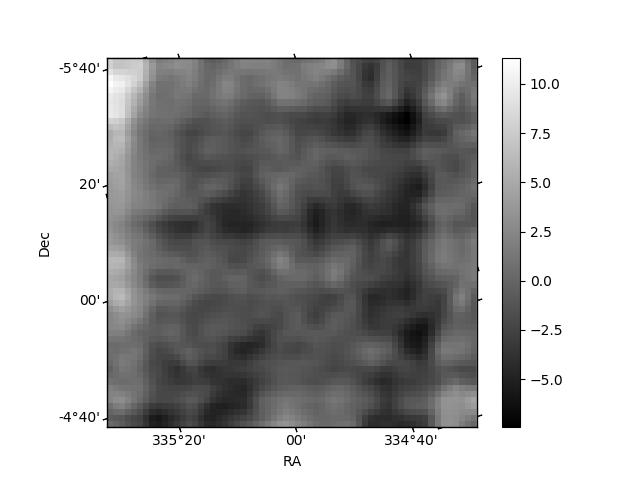
Histogram calculated using DETX and DETY for each event in the final _common_clean file
| Quadrant A | 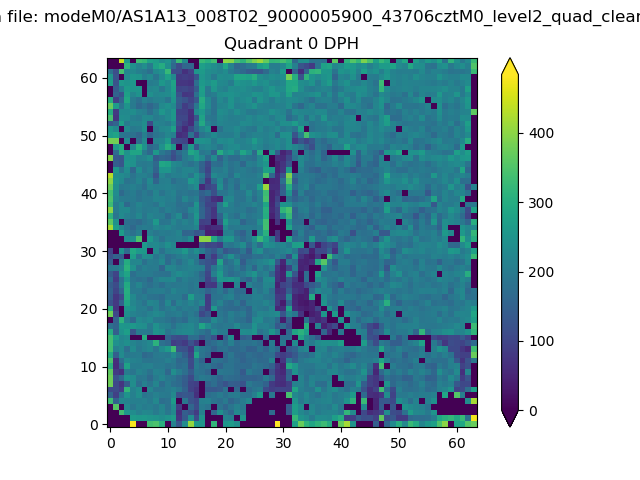 |
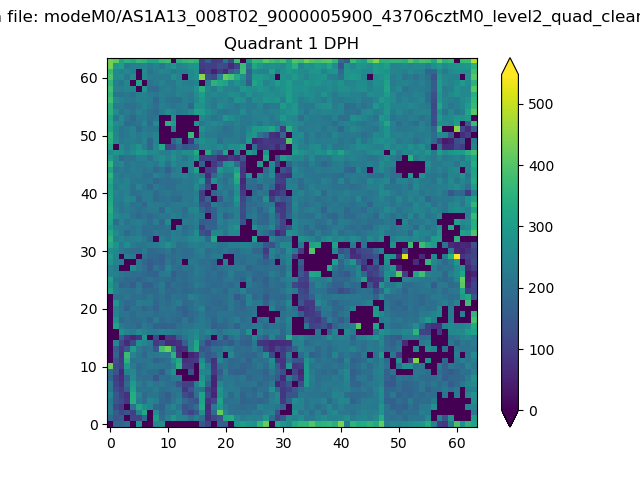 |
Quadrant B |
|---|---|---|---|
| Quadrant D | 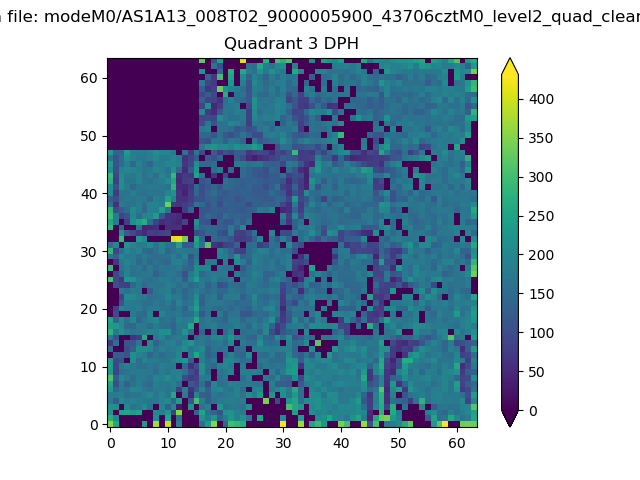 |
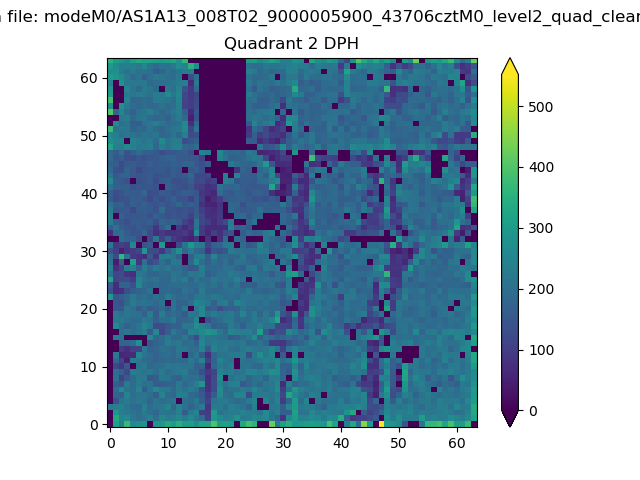 |
Quadrant C |
| Plot type | Count rate plots | Images |
|---|---|---|
| Comparison with Poisson distribution Blue bars denote a histogram of data divided into 1 sec bins. Red curve is a Poisson curve with rate = median count rate of data. |
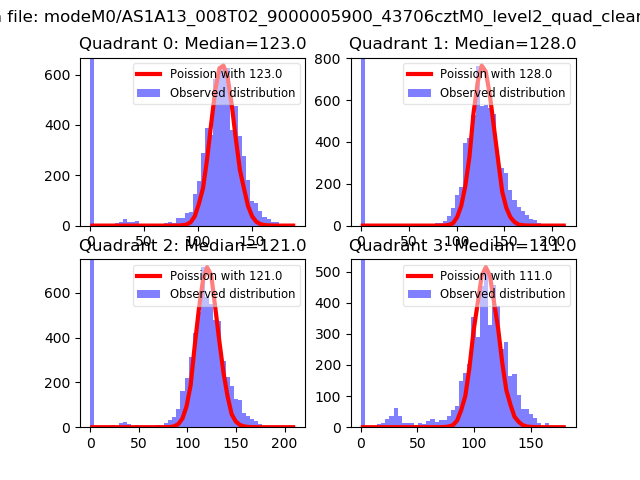 |
 |
| Quadrant-wise count rates Data is divided into 100 sec bins |
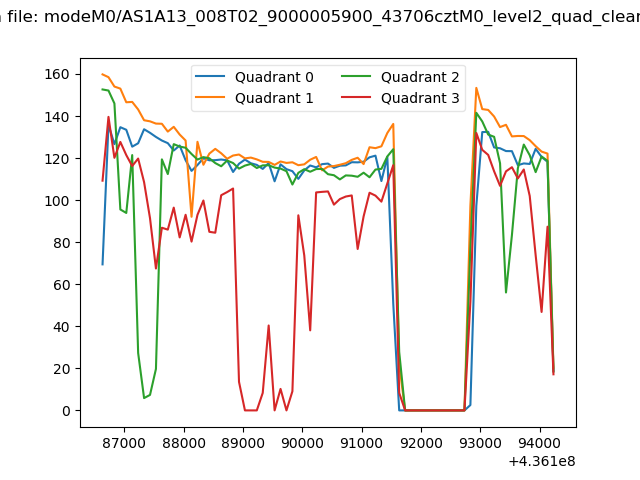 |
|
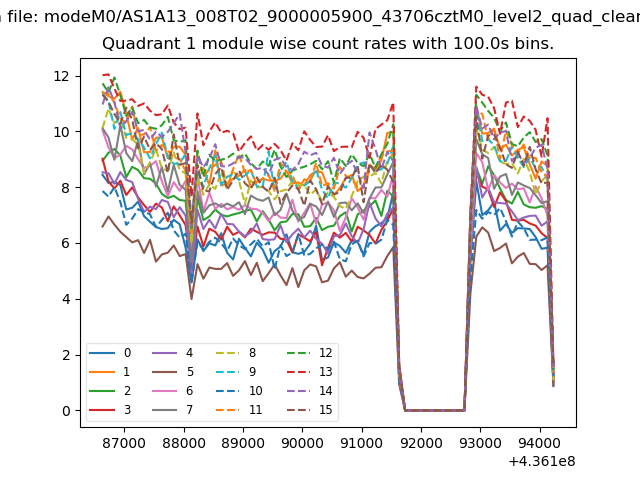
| Module-wise count rates for Quadrant A Data is divided into 100 sec bins |
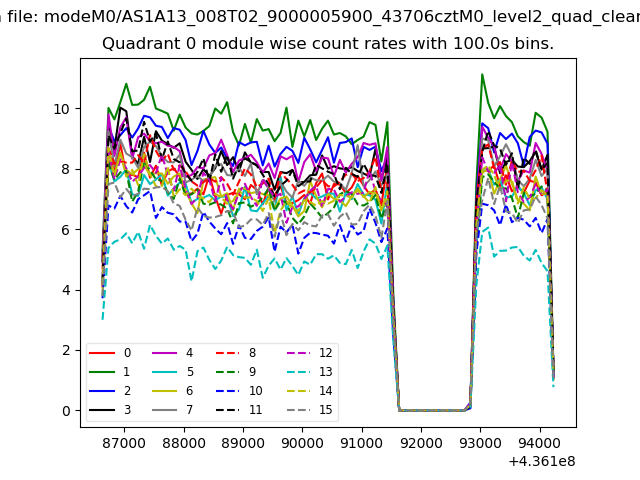 |
 |
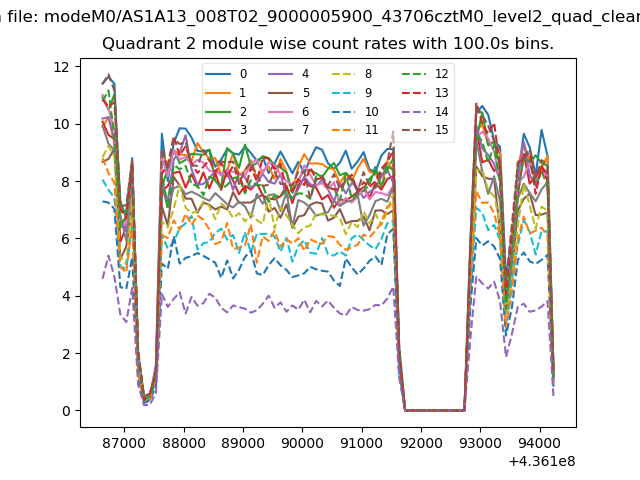
| Module-wise count rates for Quadrant B Data is divided into 100 sec bins |
 |
 |
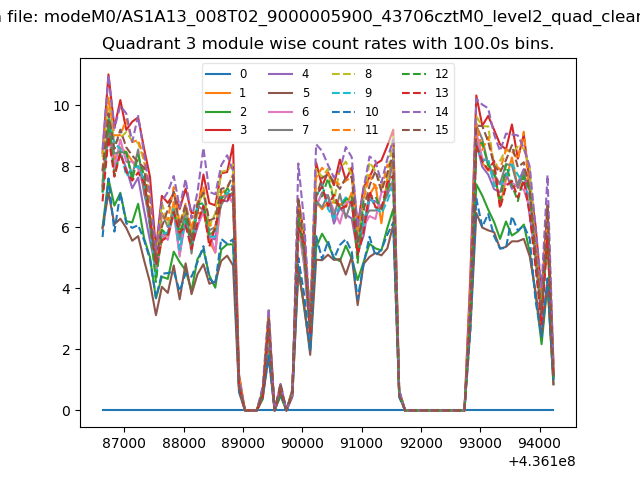
| Module-wise count rates for Quadrant C Data is divided into 100 sec bins |
 |
 |
| Module-wise count rates for Quadrant D Data is divided into 100 sec bins |
 |
 |
| Parameter | Plot |
|---|---|
| CZT HV Monitor | 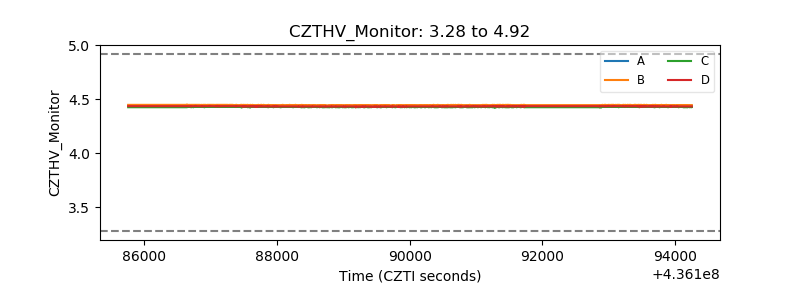 |
| D_VDD | 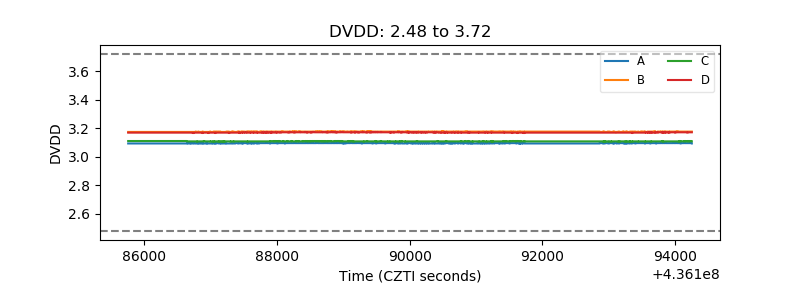 |
| Temperature 1 | 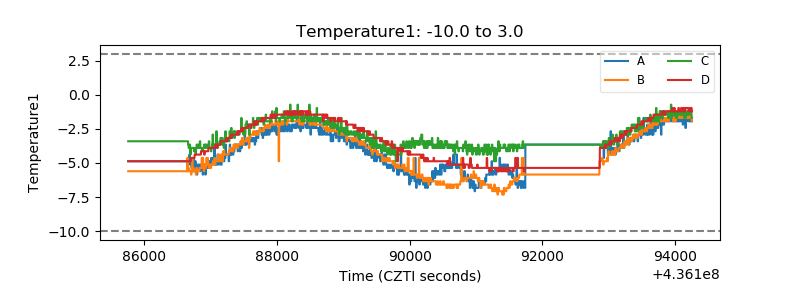 |
| Veto HV Monitor |  |
| Veto LLD | 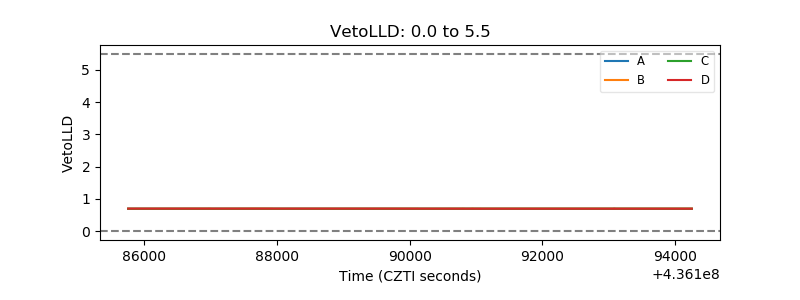 |
| Alpha Counter | 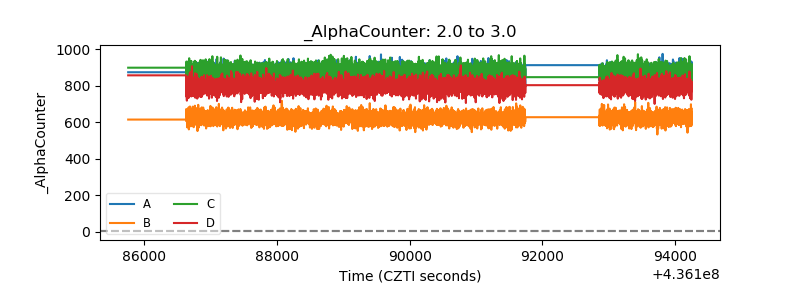 |
| _CPM_Rate | 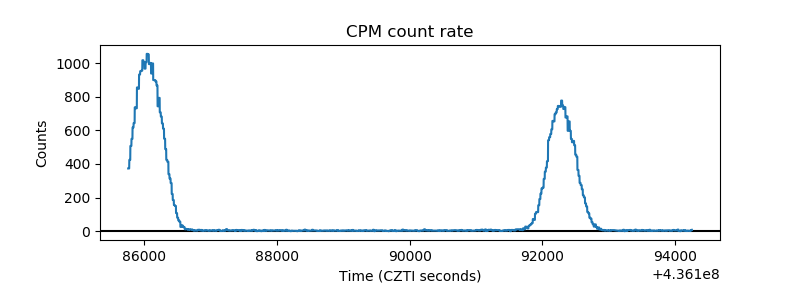 |
| CZT Counter | 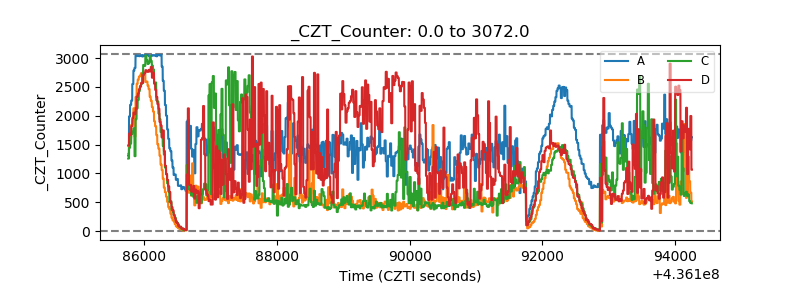 |
| +2.5 Volts monitor | 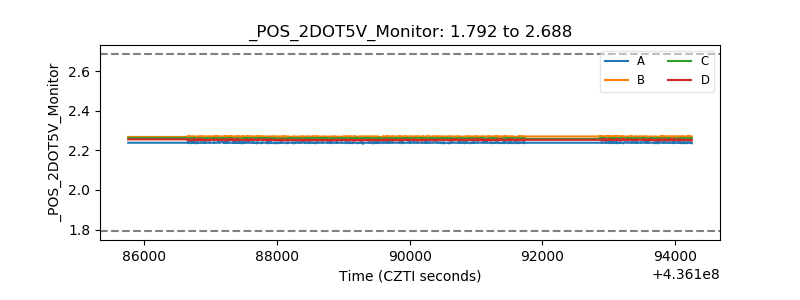 |
| +5 Volts monitor | 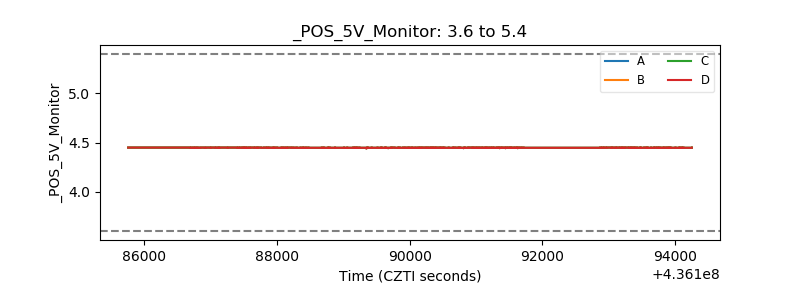 |
| _ROLL_ROT | 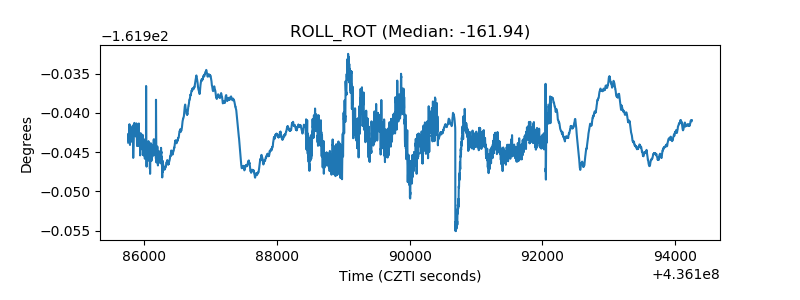 |
| _Roll_DEC | 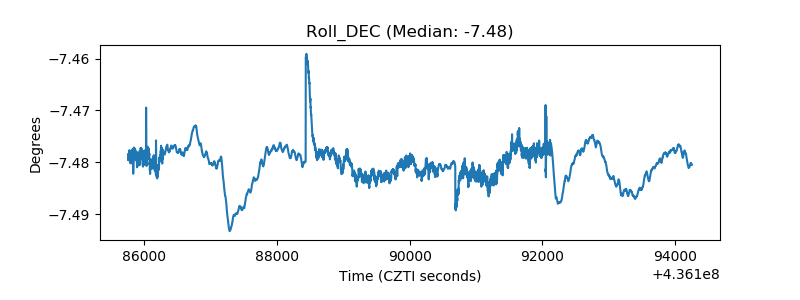 |
| _Roll_RA |  |
| Veto Counter | 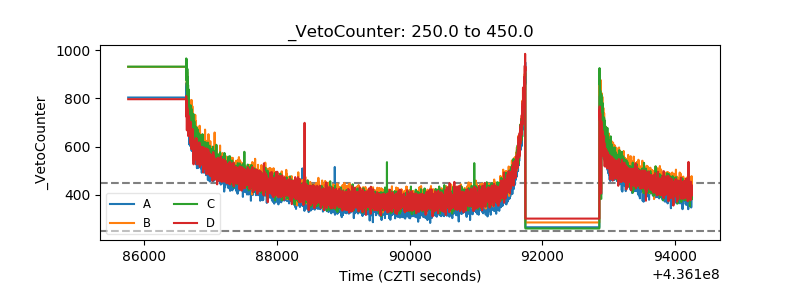 |