| Param | Original file | Final file |
|---|---|---|
| Filename | modeM0/AS1A13_008T02_9000005900_43707cztM0_level2.fits | modeM0/AS1A13_008T02_9000005900_43707cztM0_level2_quad_clean.evt |
| Size (bytes) | 704,568,960 | 110,684,160 |
| Size | 671.9 MB | 105.6 MB |
| Events in quadrant A | 9,287,403 | 736,593 |
| Events in quadrant B | 3,879,762 | 787,310 |
| Events in quadrant C | 5,589,116 | 735,542 |
| Events in quadrant D | 6,819,862 | 635,654 |
| Mode M9 | |||
|---|---|---|---|
| Quadrant | BADHDUFLAG | Total packets | Discarded packets |
| A | 0 | 11 | 0 |
| B | 0 | 11 | 0 |
| C | 0 | 11 | 0 |
| D | 0 | 11 | 0 |
| Mode M0 | |||
|---|---|---|---|
| Quadrant | BADHDUFLAG | Total packets | Discarded packets |
| A | 0 | 32156 | 2 |
| B | 0 | 15696 | 2 |
| C | 0 | 21116 | 2 |
| D | 0 | 24812 | 2 |
| Mode SS | |||
|---|---|---|---|
| Quadrant | BADHDUFLAG | Total packets | Discarded packets |
| A | 0 | 132 | 0 |
| B | 0 | 132 | 0 |
| C | 0 | 132 | 0 |
| D | 0 | 132 | 0 |
| Quadrant | Total seconds | Saturated seconds | Saturation percentage |
|---|---|---|---|
| A | 6543 | 716 | 10.942993% |
| B | 6544 | 235 | 3.591076% |
| C | 6544 | 434 | 6.632029% |
| D | 6544 | 872 | 13.325183% |
Noise dominated data is calculated using 1-second bins in cleaned event files. If a bin has >2000 counts, and if more than 50% of those come from <1% of pixels, then it is considered to be noise-dominated and hence unusable.
| Quadrant | # 1 sec bins | Bins with >0 counts | Bins with >2000 counts | High rate bins dominated by noise | Noise dominated (total time) | Noise dominated (detector-on time) | Marked lightcurve |
|---|---|---|---|---|---|---|---|
| A | 7603 | 6544 | 146 | 146 | 1.92% | 2.23% | 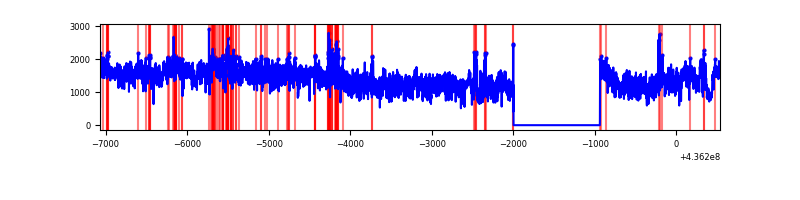 |
| B | 7604 | 6545 | 70 | 70 | 0.92% | 1.07% | 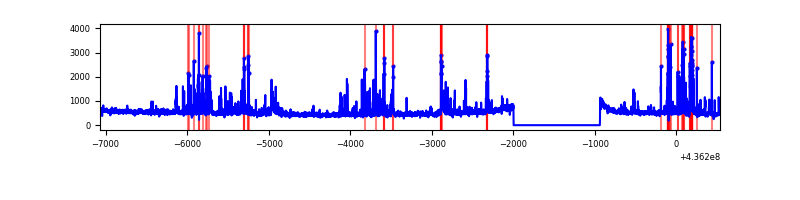 |
| C | 7604 | 6545 | 301 | 301 | 3.96% | 4.60% | 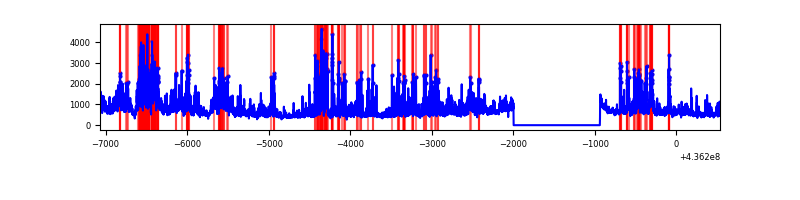 |
| D | 7604 | 6545 | 589 | 589 | 7.75% | 9.00% | 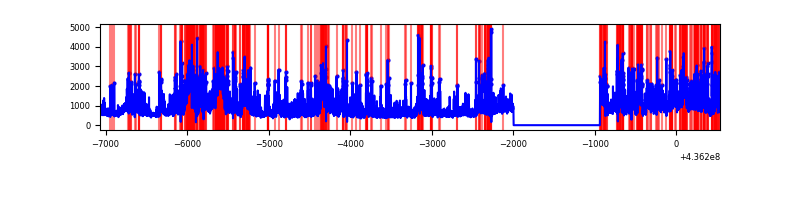 |
Top three noisy pixels from each quadrant. If the there are fewer than three noisy pixels in the level2.evt file, extra rows are filled as -1
| Pixel properties | Quadrant properties | ||||||
|---|---|---|---|---|---|---|---|
| Quadrant | DetID | PixID | Counts | Sigma | Mean | Median | Sigma |
| A | 15 | 222 | 4289632 | 26463.89 | 782 | 767 | 162.1 |
| A | 10 | 83 | 917108 | 5654.16 | 782 | 767 | 162.1 |
| A | 14 | 63 | 832801 | 5133.96 | 782 | 767 | 162.1 |
| B | 5 | 235 | 405093 | 2601.08 | 793 | 771 | 155.4 |
| B | 4 | 206 | 78413 | 499.49 | 793 | 771 | 155.4 |
| B | 5 | 255 | 69930 | 444.91 | 793 | 771 | 155.4 |
| C | 3 | 233 | 1273497 | 7115.47 | 760 | 766 | 178.9 |
| C | 15 | 157 | 1142738 | 6384.43 | 760 | 766 | 178.9 |
| C | 15 | 158 | 146620 | 815.43 | 760 | 766 | 178.9 |
| D | 12 | 33 | 936836 | 4846.33 | 751 | 728 | 193.2 |
| D | 1 | 52 | 423968 | 2191.16 | 751 | 728 | 193.2 |
| D | 5 | 235 | 341810 | 1765.82 | 751 | 728 | 193.2 |
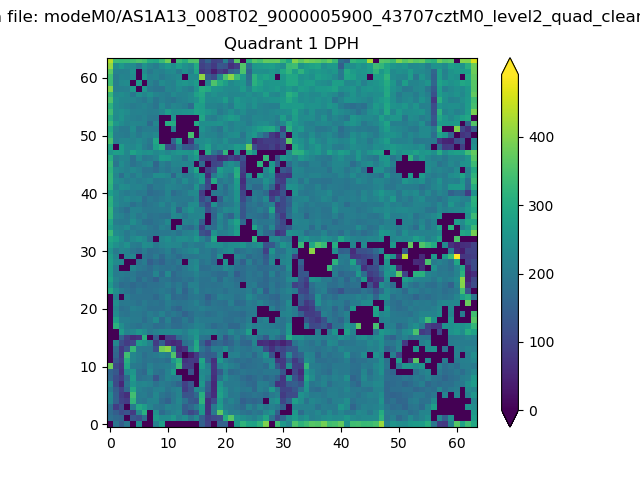
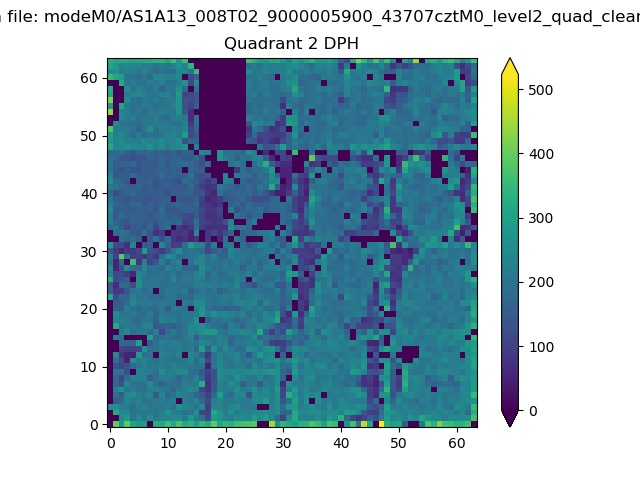
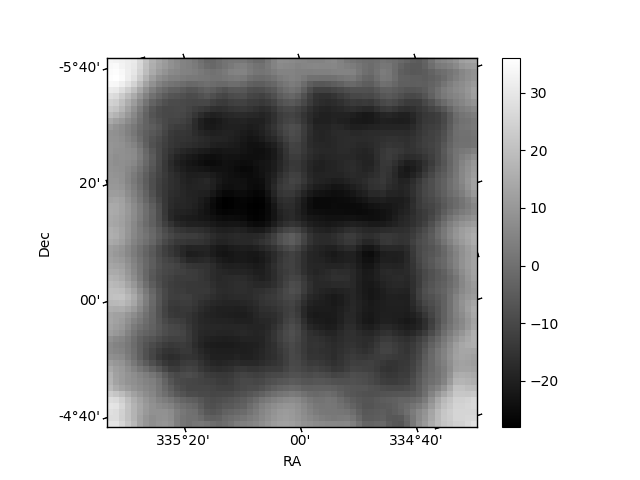
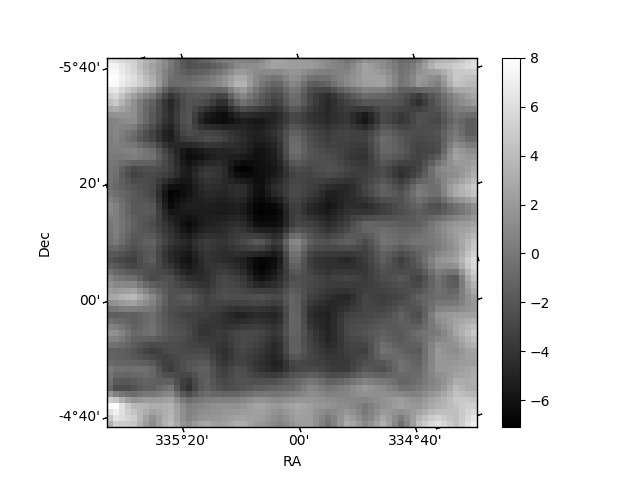
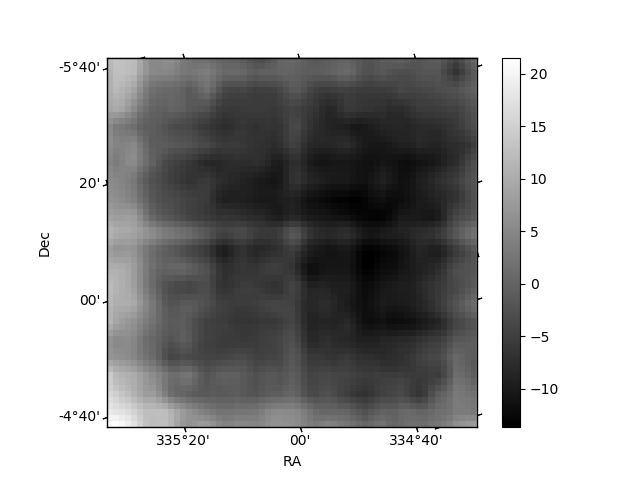
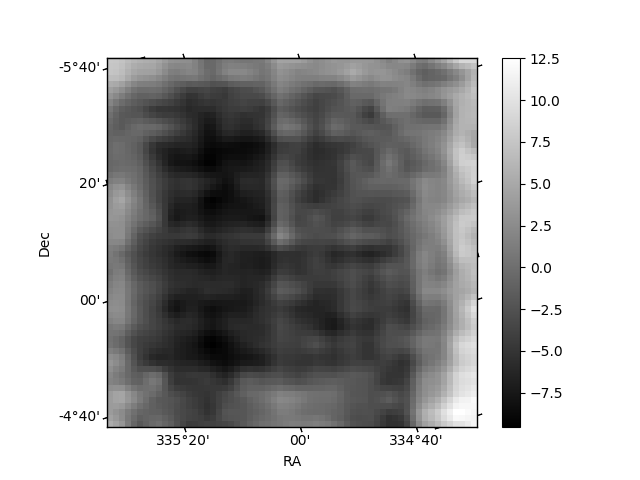
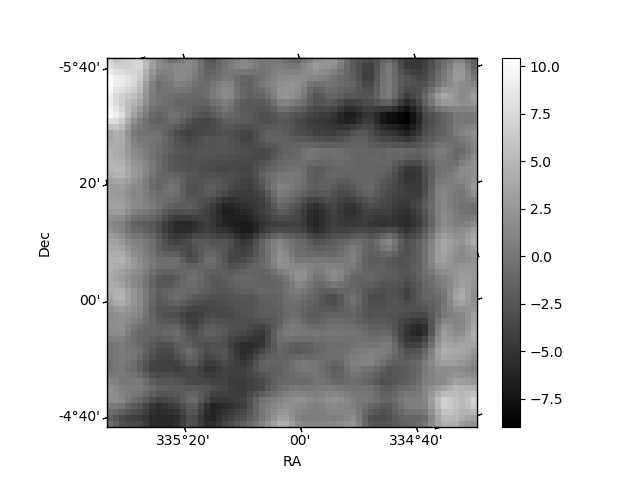
Histogram calculated using DETX and DETY for each event in the final _common_clean file
| Quadrant A |  |
 |
Quadrant B |
|---|---|---|---|
| Quadrant D | 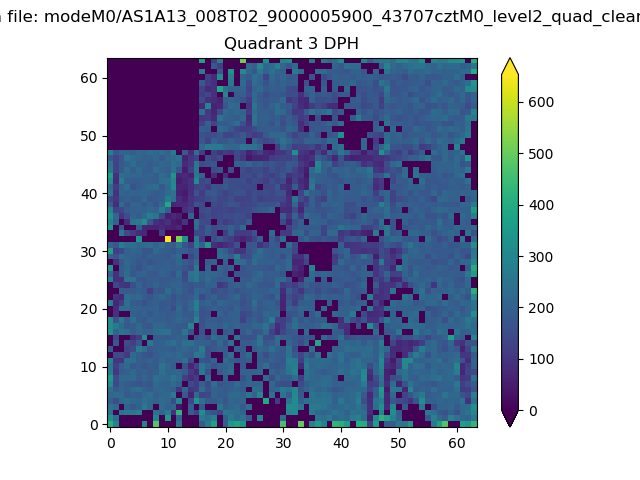 |
 |
Quadrant C |
| Plot type | Count rate plots | Images |
|---|---|---|
| Comparison with Poisson distribution Blue bars denote a histogram of data divided into 1 sec bins. Red curve is a Poisson curve with rate = median count rate of data. |
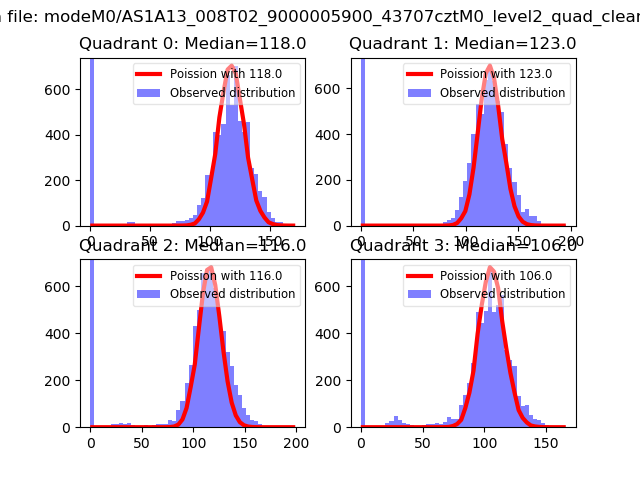 |
 |
| Quadrant-wise count rates Data is divided into 100 sec bins |
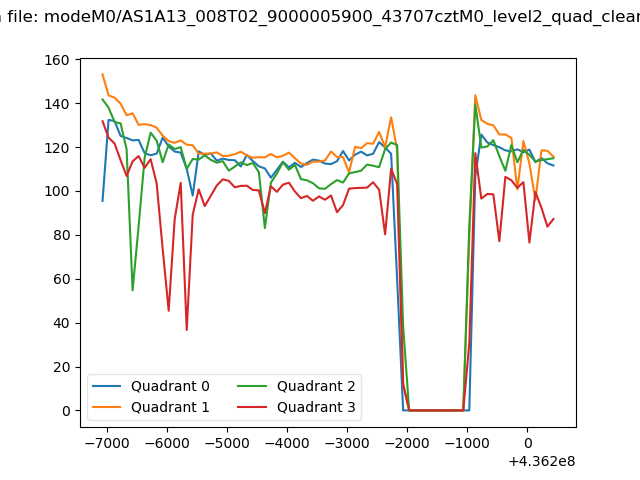 |
|
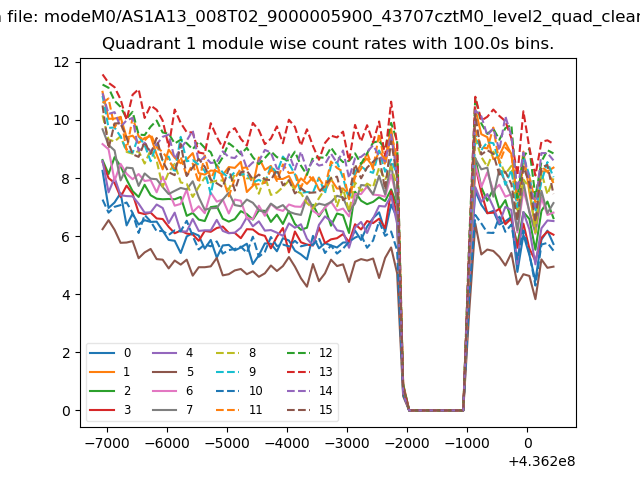
| Module-wise count rates for Quadrant A Data is divided into 100 sec bins |
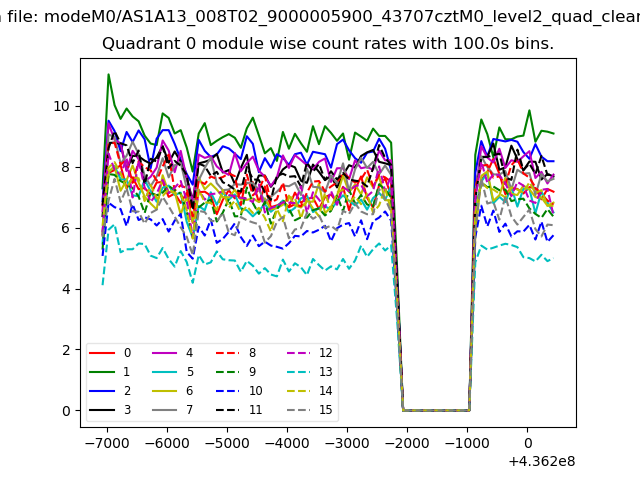 |
 |
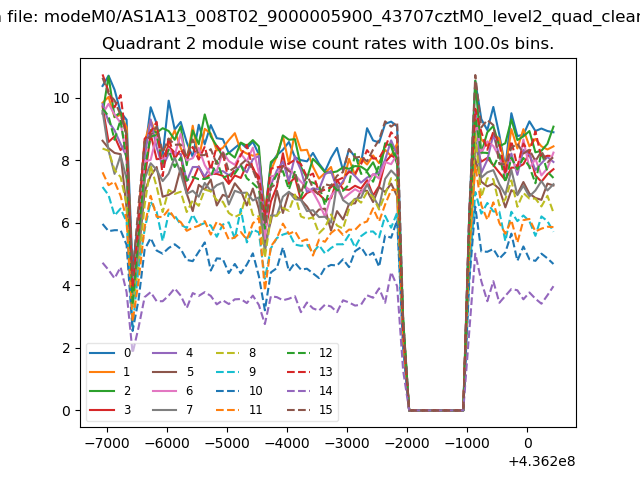
| Module-wise count rates for Quadrant B Data is divided into 100 sec bins |
 |
 |
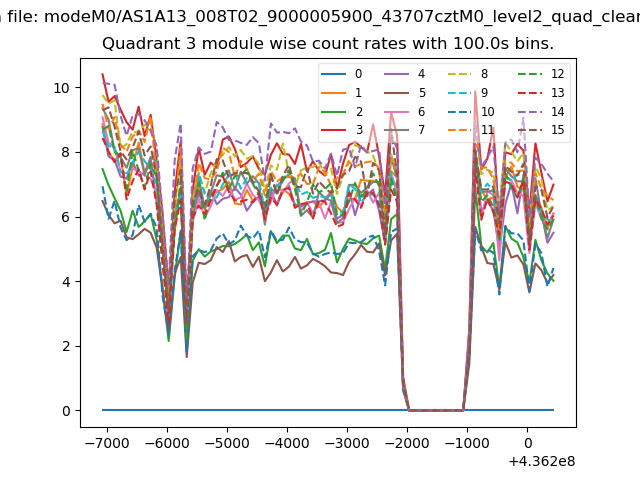
| Module-wise count rates for Quadrant C Data is divided into 100 sec bins |
 |
 |
| Module-wise count rates for Quadrant D Data is divided into 100 sec bins |
 |
 |
| Parameter | Plot |
|---|---|
| CZT HV Monitor | 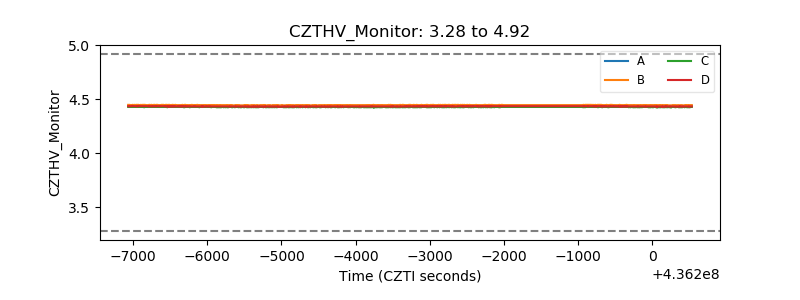 |
| D_VDD | 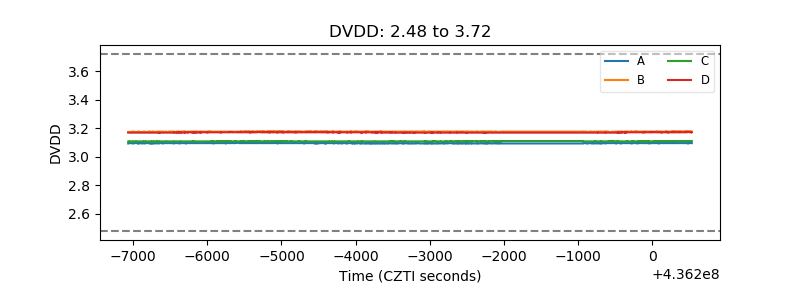 |
| Temperature 1 | 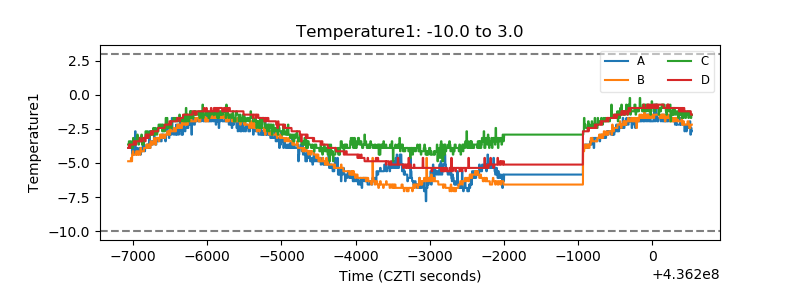 |
| Veto HV Monitor | 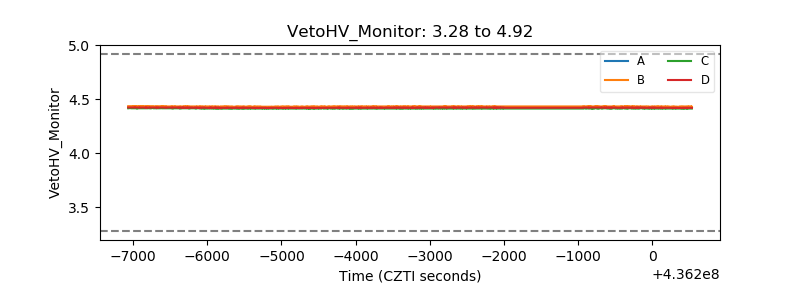 |
| Veto LLD | 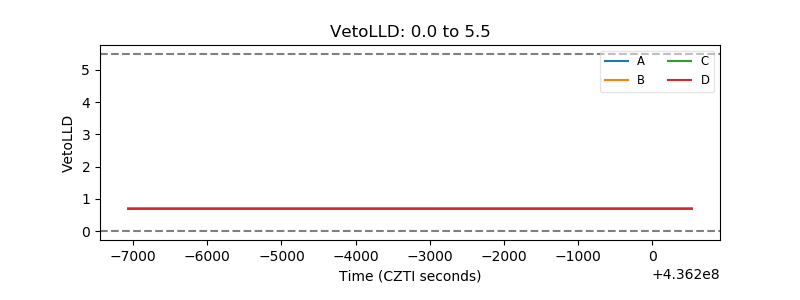 |
| Alpha Counter | 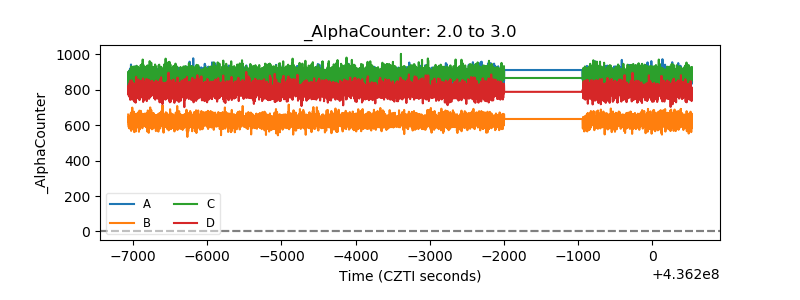 |
| _CPM_Rate | 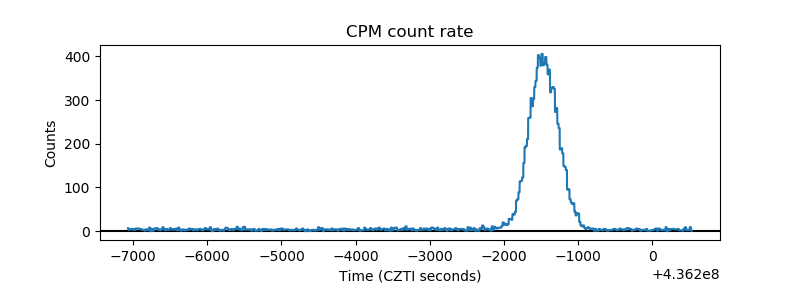 |
| CZT Counter | 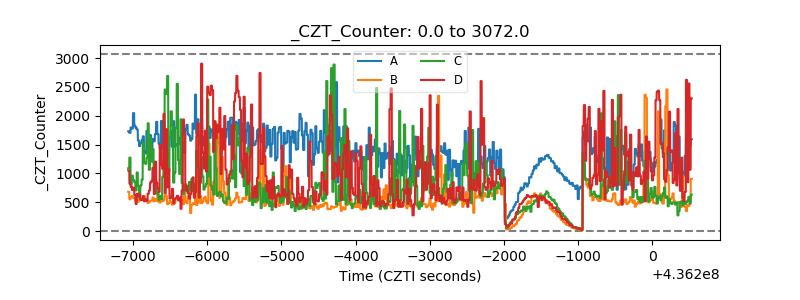 |
| +2.5 Volts monitor | 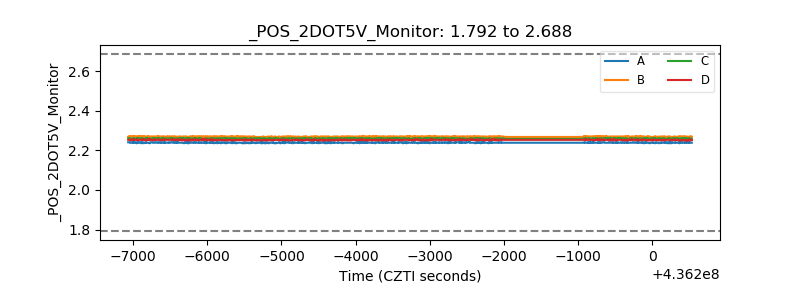 |
| +5 Volts monitor | 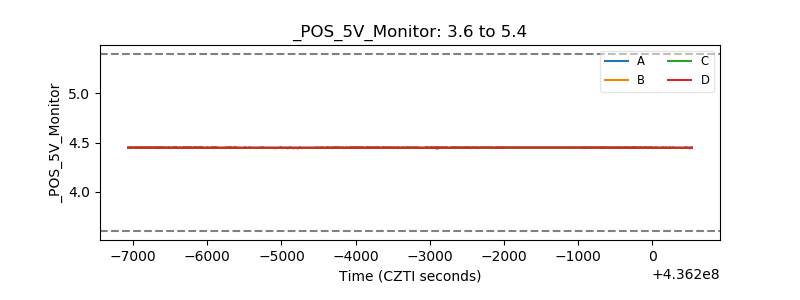 |
| _ROLL_ROT | 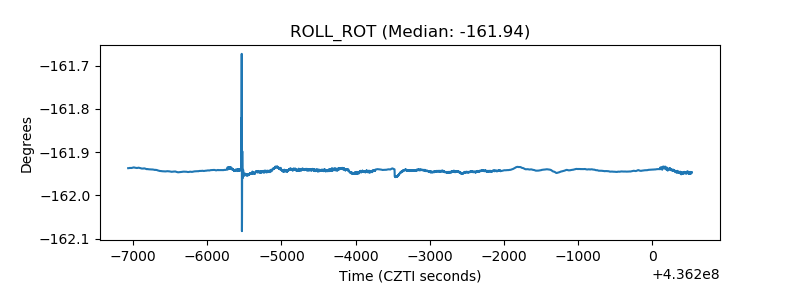 |
| _Roll_DEC | 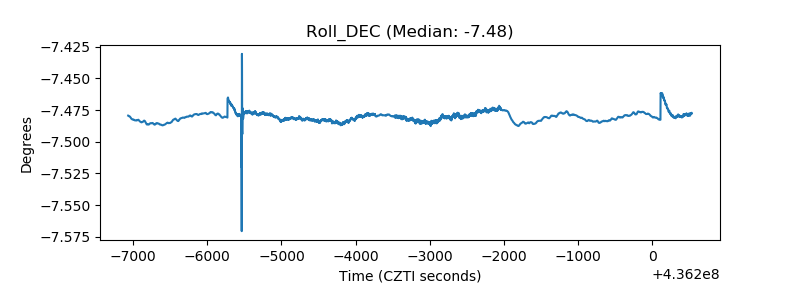 |
| _Roll_RA | 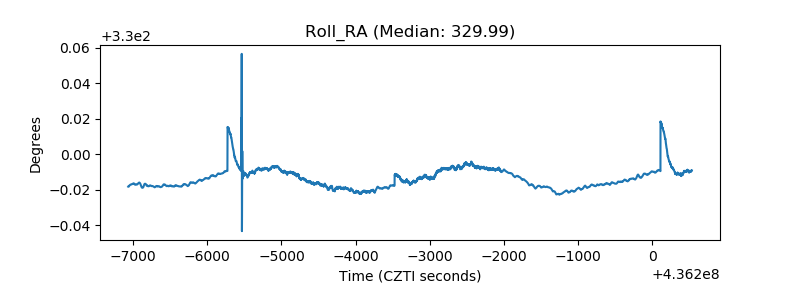 |
| Veto Counter | 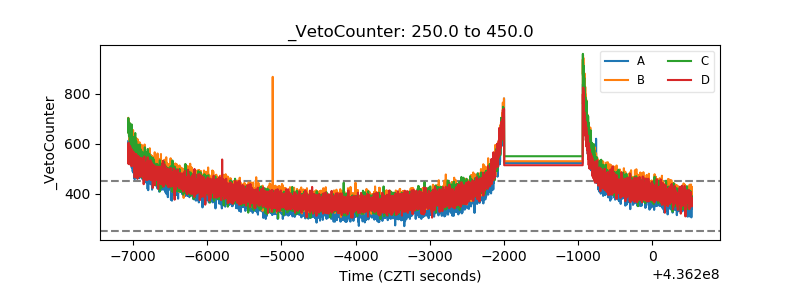 |