| Param | Original file | Final file |
|---|---|---|
| Filename | modeM0/AS1A13_008T02_9000005900_43709cztM0_level2.fits | modeM0/AS1A13_008T02_9000005900_43709cztM0_level2_quad_clean.evt |
| Size (bytes) | 172,848,960 | 24,436,800 |
| Size | 164.8 MB | 23.3 MB |
| Events in quadrant A | 2,133,276 | 162,121 |
| Events in quadrant B | 866,818 | 172,336 |
| Events in quadrant C | 988,326 | 162,679 |
| Events in quadrant D | 2,290,700 | 131,134 |
| Mode M0 | |||
|---|---|---|---|
| Quadrant | BADHDUFLAG | Total packets | Discarded packets |
| A | 0 | 7418 | 0 |
| B | 0 | 3554 | 0 |
| C | 0 | 3949 | 0 |
| D | 0 | 7861 | 0 |
| Mode SS | |||
|---|---|---|---|
| Quadrant | BADHDUFLAG | Total packets | Discarded packets |
| A | 0 | 30 | 0 |
| B | 0 | 30 | 0 |
| C | 0 | 30 | 0 |
| D | 0 | 30 | 0 |
| Quadrant | Total seconds | Saturated seconds | Saturation percentage |
|---|---|---|---|
| A | 1509 | 139 | 9.211398% |
| B | 1510 | 24 | 1.589404% |
| C | 1510 | 64 | 4.238411% |
| D | 1510 | 333 | 22.052980% |
Noise dominated data is calculated using 1-second bins in cleaned event files. If a bin has >2000 counts, and if more than 50% of those come from <1% of pixels, then it is considered to be noise-dominated and hence unusable.
| Quadrant | # 1 sec bins | Bins with >0 counts | Bins with >2000 counts | High rate bins dominated by noise | Noise dominated (total time) | Noise dominated (detector-on time) | Marked lightcurve |
|---|---|---|---|---|---|---|---|
| A | 1509 | 1509 | 85 | 85 | 5.63% | 5.63% | 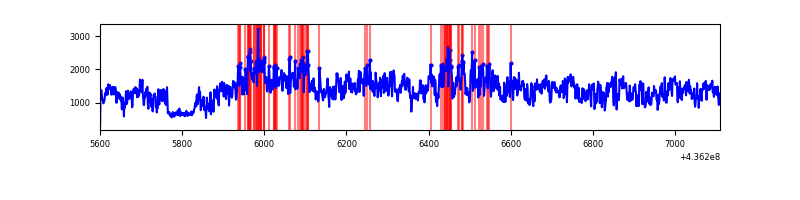 |
| B | 1510 | 1510 | 19 | 19 | 1.26% | 1.26% | 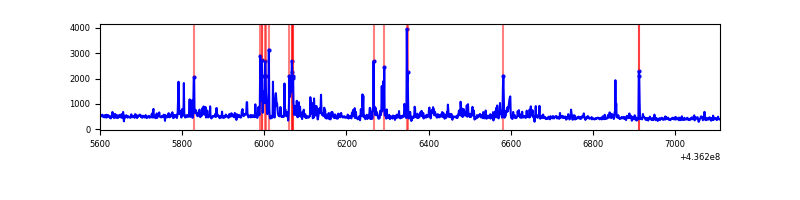 |
| C | 1510 | 1510 | 48 | 48 | 3.18% | 3.18% | 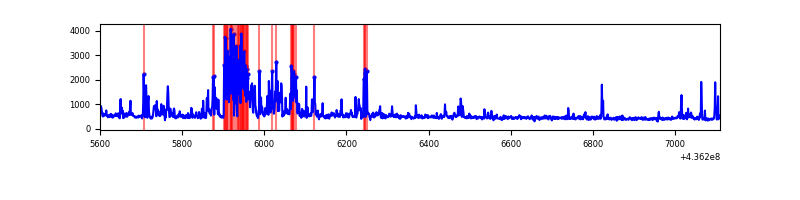 |
| D | 1510 | 1510 | 337 | 337 | 22.32% | 22.32% | 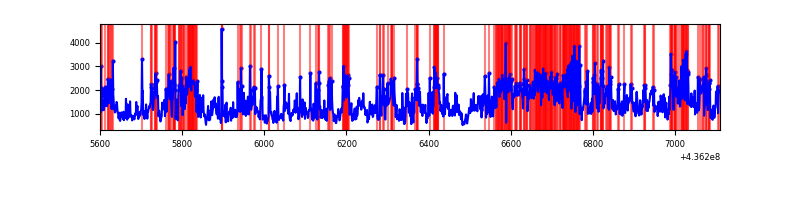 |
Top three noisy pixels from each quadrant. If the there are fewer than three noisy pixels in the level2.evt file, extra rows are filled as -1
| Pixel properties | Quadrant properties | ||||||
|---|---|---|---|---|---|---|---|
| Quadrant | DetID | PixID | Counts | Sigma | Mean | Median | Sigma |
| A | 15 | 222 | 801911 | 21500.49 | 170 | 166 | 37.3 |
| A | 14 | 63 | 261336 | 7003.83 | 170 | 166 | 37.3 |
| A | 15 | 223 | 207046 | 5547.92 | 170 | 166 | 37.3 |
| B | 5 | 235 | 128167 | 3628.92 | 169 | 165 | 35.3 |
| B | 4 | 67 | 46761 | 1321.02 | 169 | 165 | 35.3 |
| B | 5 | 255 | 8385 | 233.04 | 169 | 165 | 35.3 |
| C | 15 | 157 | 237145 | 5908.68 | 162 | 163 | 40.1 |
| C | 3 | 233 | 48492 | 1204.99 | 162 | 163 | 40.1 |
| C | 15 | 158 | 35569 | 882.78 | 162 | 163 | 40.1 |
| D | 12 | 34 | 486453 | 11671.86 | 157 | 152 | 41.7 |
| D | 8 | 48 | 319038 | 7653.68 | 157 | 152 | 41.7 |
| D | 5 | 235 | 269678 | 6468.98 | 157 | 152 | 41.7 |
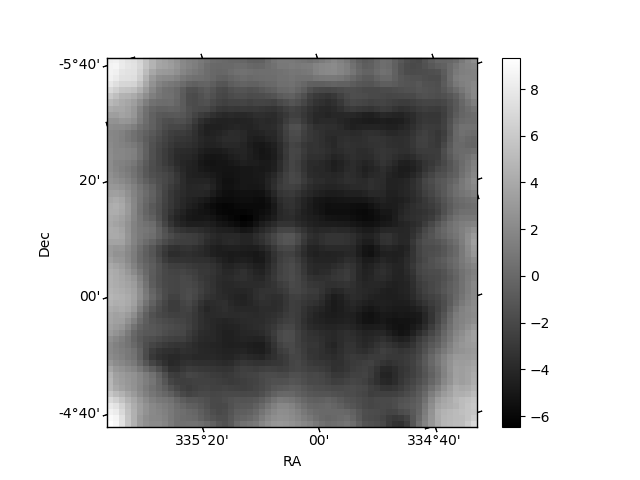
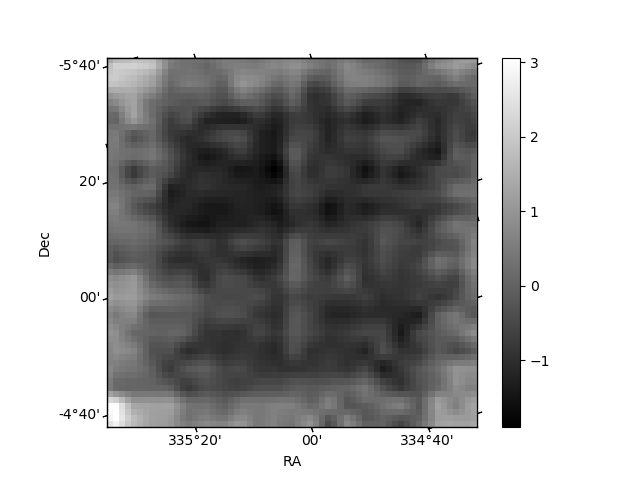
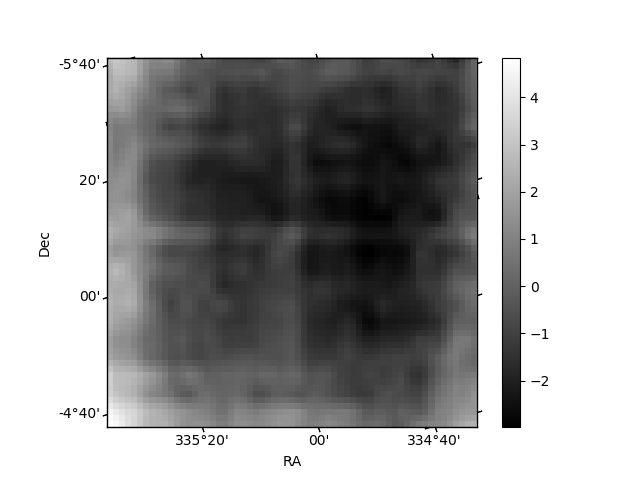
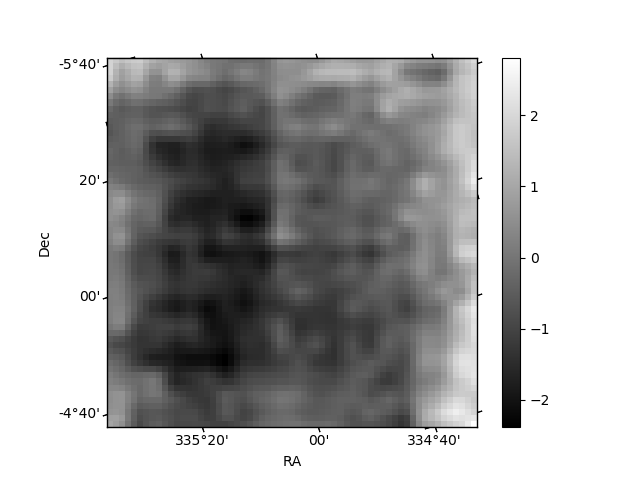
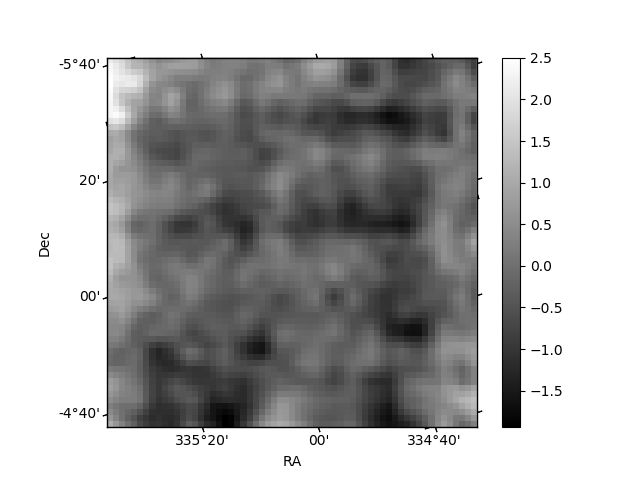
Histogram calculated using DETX and DETY for each event in the final _common_clean file
| Quadrant A | 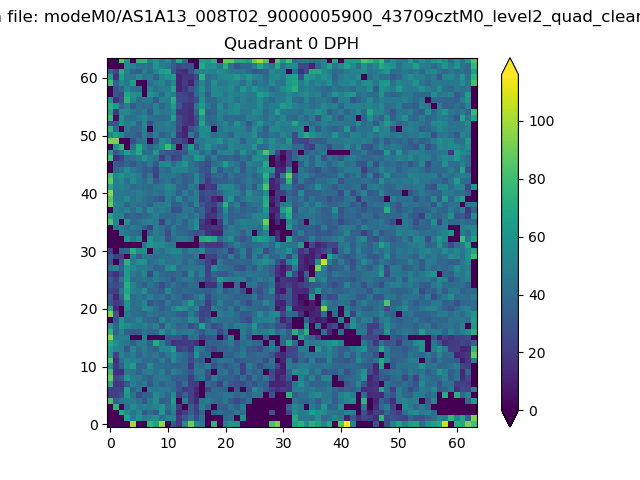 |
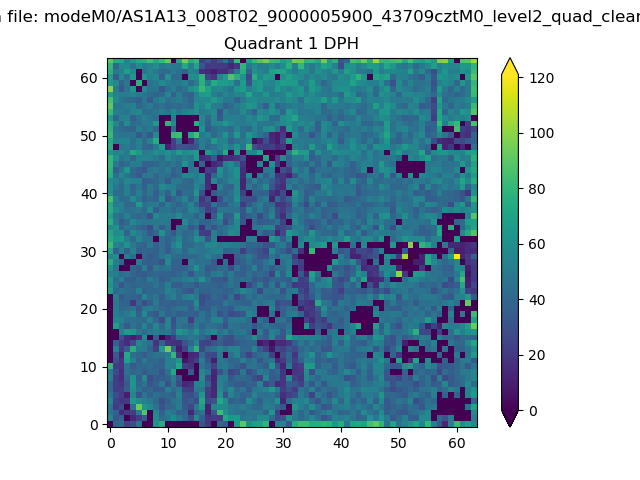 |
Quadrant B |
|---|---|---|---|
| Quadrant D | 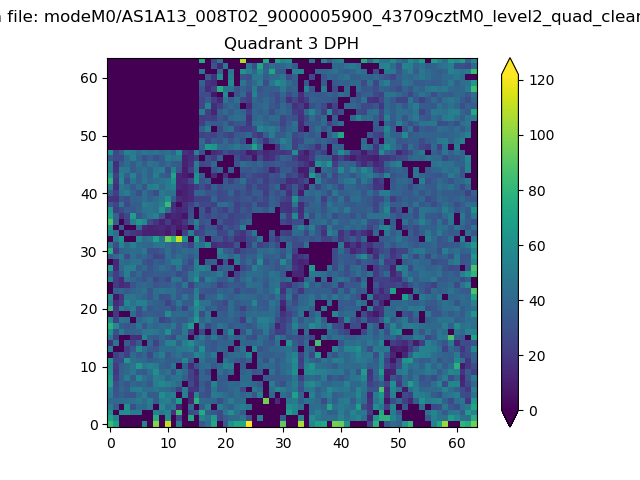 |
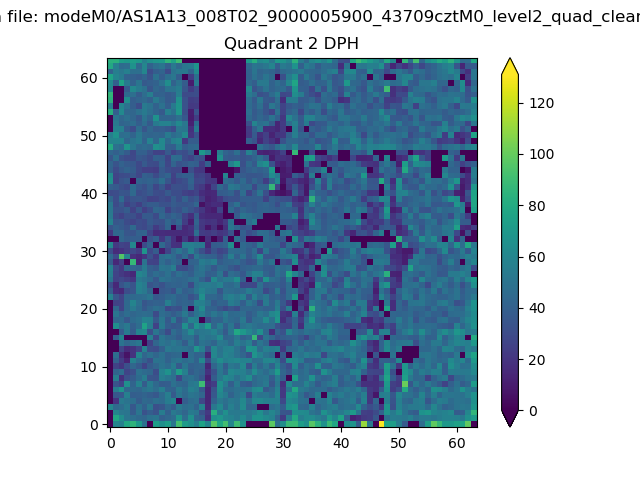 |
Quadrant C |
| Plot type | Count rate plots | Images |
|---|---|---|
| Comparison with Poisson distribution Blue bars denote a histogram of data divided into 1 sec bins. Red curve is a Poisson curve with rate = median count rate of data. |
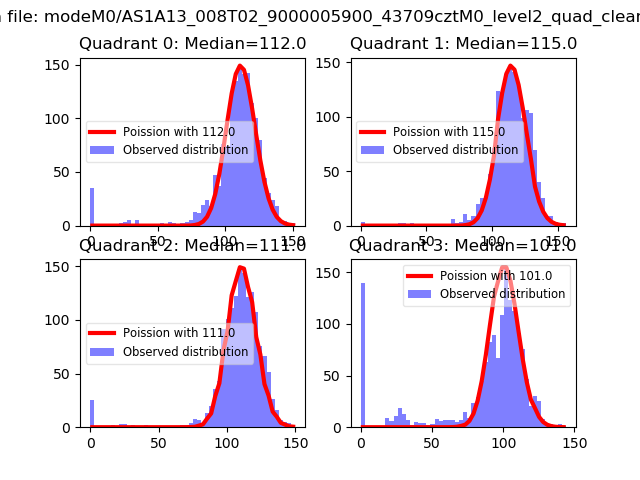 |
 |
| Quadrant-wise count rates Data is divided into 100 sec bins |
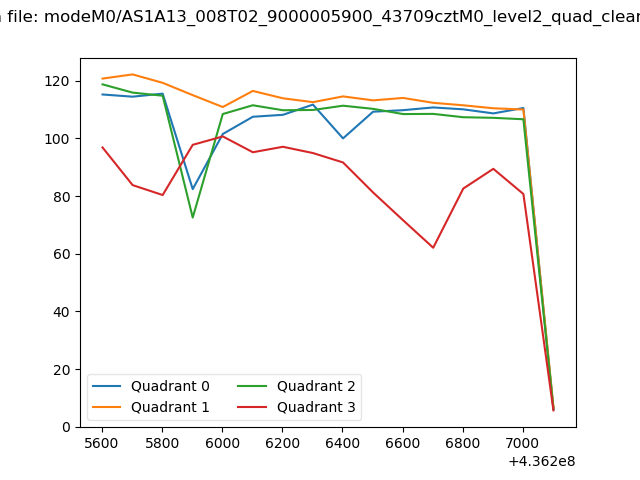 |
|
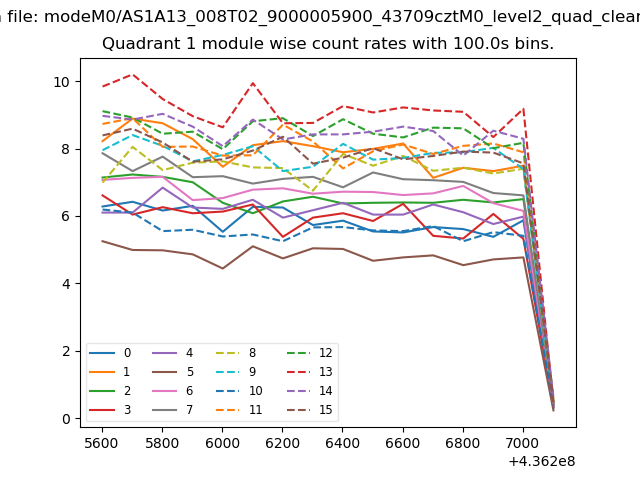
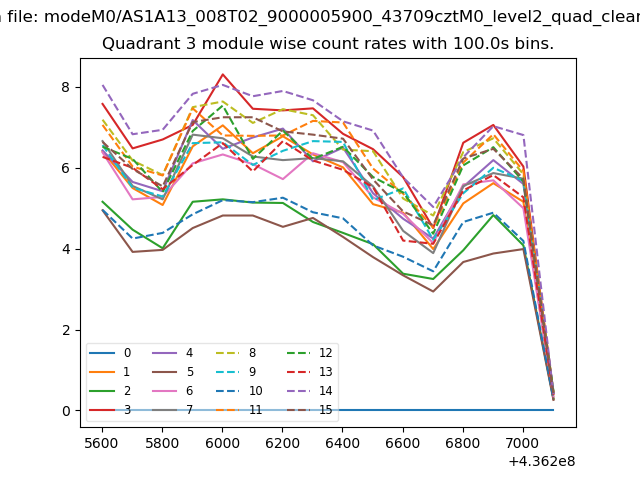
| Module-wise count rates for Quadrant A Data is divided into 100 sec bins |
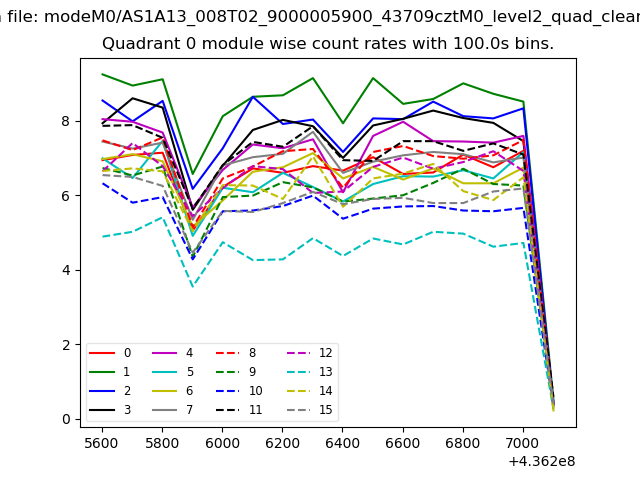 |
 |
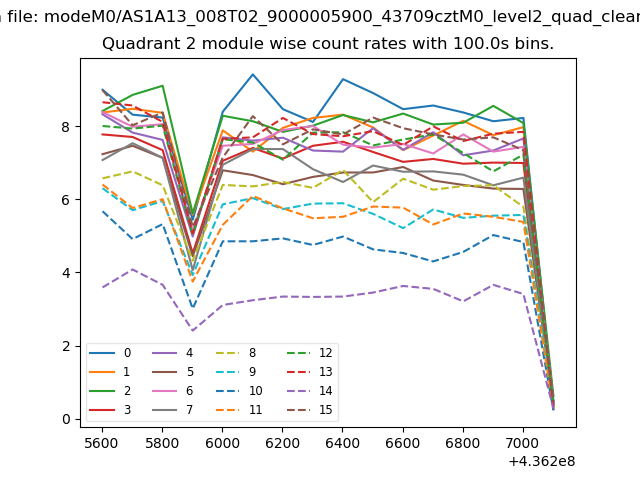
| Module-wise count rates for Quadrant B Data is divided into 100 sec bins |
 |
 |
| Module-wise count rates for Quadrant C Data is divided into 100 sec bins |
 |
 |
| Module-wise count rates for Quadrant D Data is divided into 100 sec bins |
 |
 |
| Parameter | Plot |
|---|---|
| CZT HV Monitor | 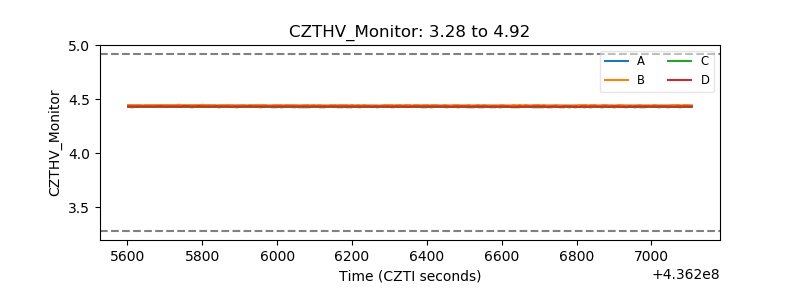 |
| D_VDD | 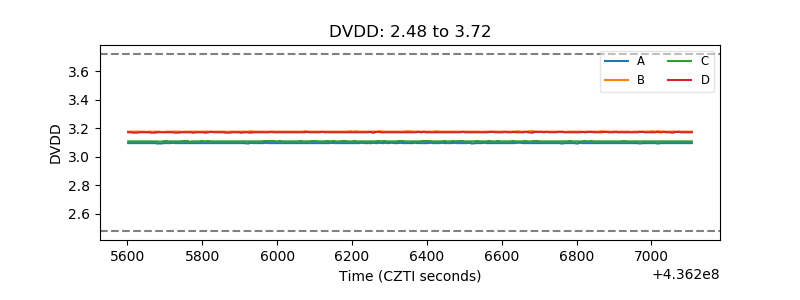 |
| Temperature 1 | 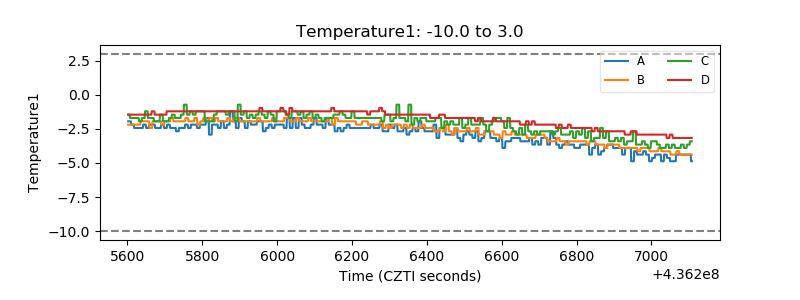 |
| Veto HV Monitor | 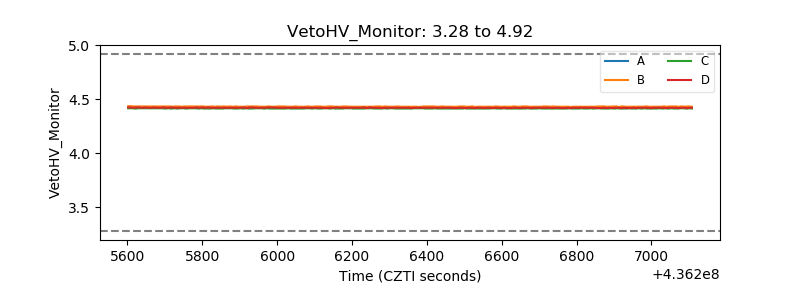 |
| Veto LLD | 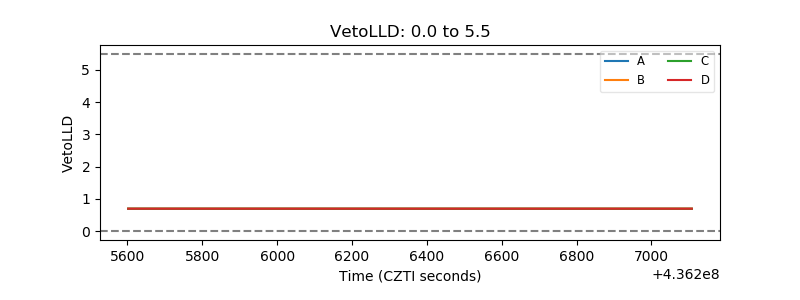 |
| Alpha Counter | 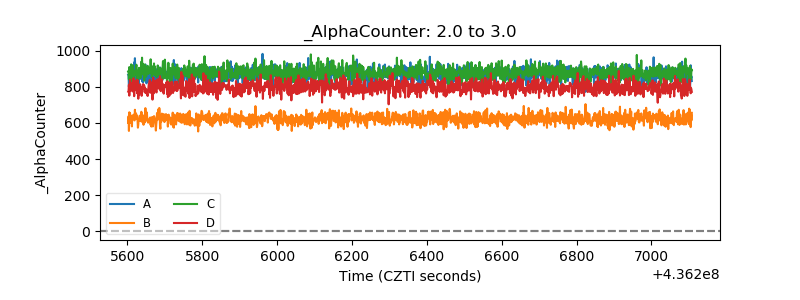 |
| _CPM_Rate | 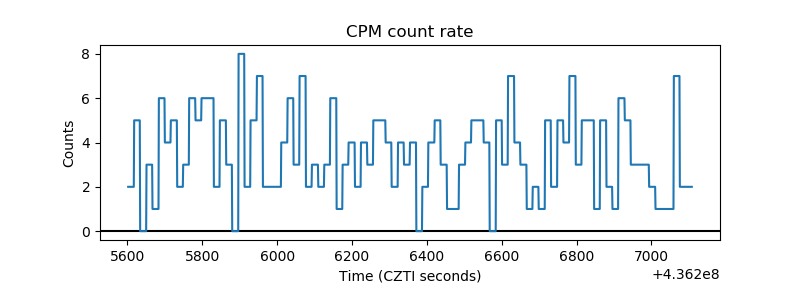 |
| CZT Counter | 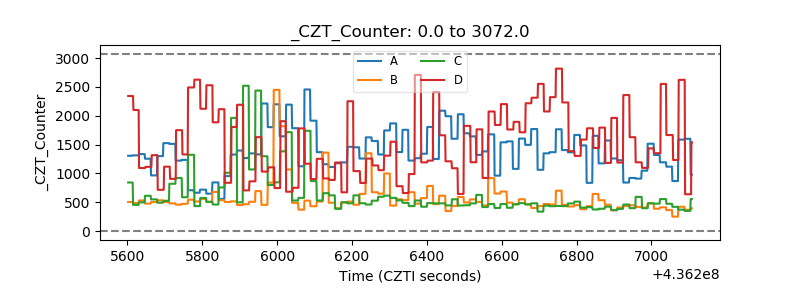 |
| +2.5 Volts monitor | 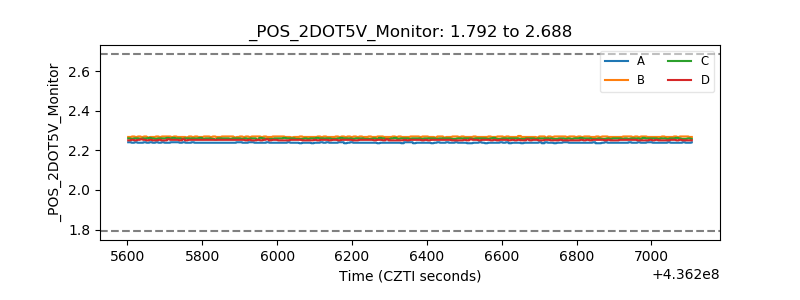 |
| +5 Volts monitor | 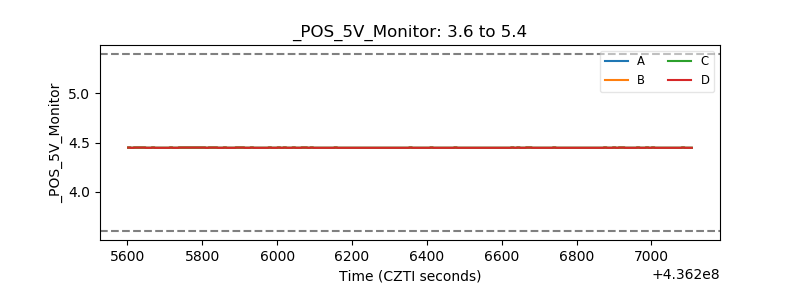 |
| _ROLL_ROT | 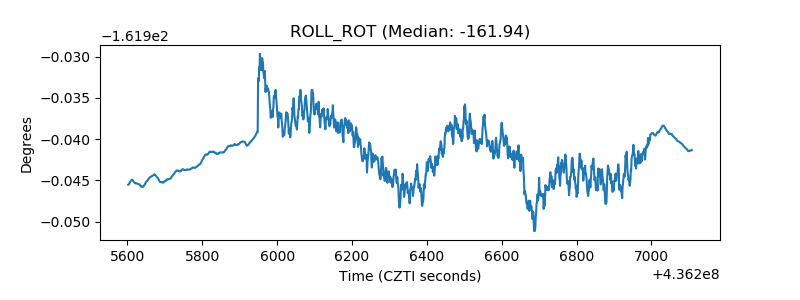 |
| _Roll_DEC |  |
| _Roll_RA | 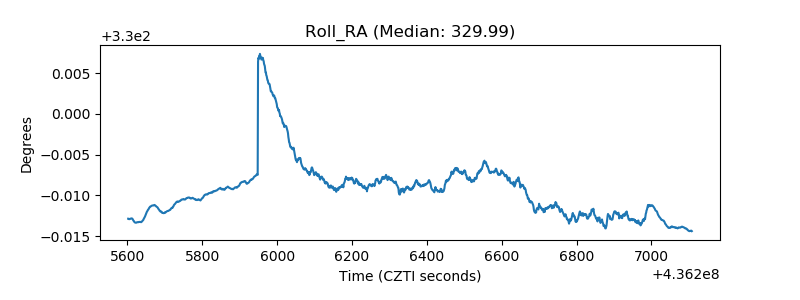 |
| Veto Counter | 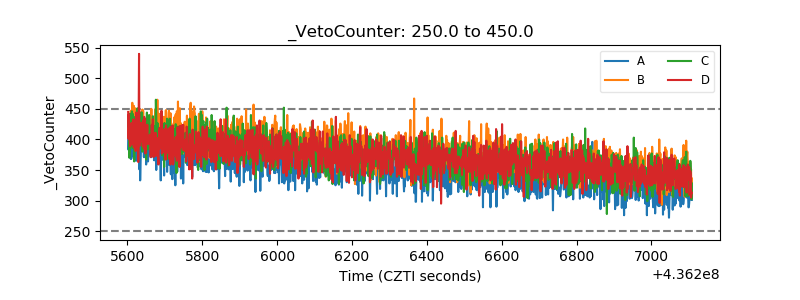 |