| Param | Original file | Final file |
|---|---|---|
| Filename | modeM0/AS1A13_003T01_9000005902_43709cztM0_level2.fits | modeM0/AS1A13_003T01_9000005902_43709cztM0_level2_quad_clean.evt |
| Size (bytes) | 453,519,360 | 72,311,040 |
| Size | 432.5 MB | 69.0 MB |
| Events in quadrant A | 5,633,180 | 454,892 |
| Events in quadrant B | 2,490,534 | 519,895 |
| Events in quadrant C | 3,274,044 | 484,331 |
| Events in quadrant D | 5,033,880 | 407,630 |
| Mode SS | |||
|---|---|---|---|
| Quadrant | BADHDUFLAG | Total packets | Discarded packets |
| A | 0 | 92 | 0 |
| B | 0 | 92 | 0 |
| C | 0 | 92 | 0 |
| D | 0 | 92 | 0 |
| Mode M0 | |||
|---|---|---|---|
| Quadrant | BADHDUFLAG | Total packets | Discarded packets |
| A | 0 | 19945 | 1 |
| B | 0 | 10436 | 1 |
| C | 0 | 12913 | 1 |
| D | 0 | 18162 | 1 |
| Mode M9 | |||
|---|---|---|---|
| Quadrant | BADHDUFLAG | Total packets | Discarded packets |
| A | 0 | 4 | 0 |
| B | 0 | 4 | 0 |
| C | 0 | 4 | 0 |
| D | 0 | 4 | 0 |
| Quadrant | Total seconds | Saturated seconds | Saturation percentage |
|---|---|---|---|
| A | 4587 | 619 | 13.494659% |
| B | 4587 | 143 | 3.117506% |
| C | 4587 | 328 | 7.150643% |
| D | 4587 | 718 | 15.652932% |
Noise dominated data is calculated using 1-second bins in cleaned event files. If a bin has >2000 counts, and if more than 50% of those come from <1% of pixels, then it is considered to be noise-dominated and hence unusable.
| Quadrant | # 1 sec bins | Bins with >0 counts | Bins with >2000 counts | High rate bins dominated by noise | Noise dominated (total time) | Noise dominated (detector-on time) | Marked lightcurve |
|---|---|---|---|---|---|---|---|
| A | 4992 | 4588 | 256 | 256 | 5.13% | 5.58% | 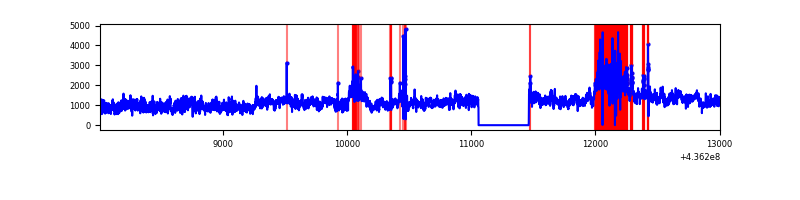 |
| B | 4992 | 4588 | 23 | 23 | 0.46% | 0.50% | 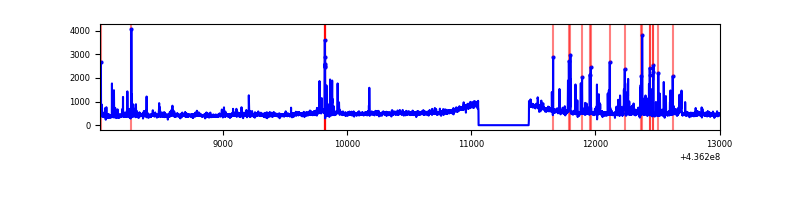 |
| C | 4992 | 4588 | 211 | 211 | 4.23% | 4.60% | 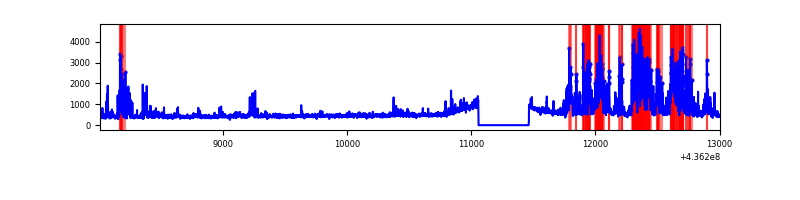 |
| D | 4992 | 4588 | 460 | 460 | 9.21% | 10.03% | 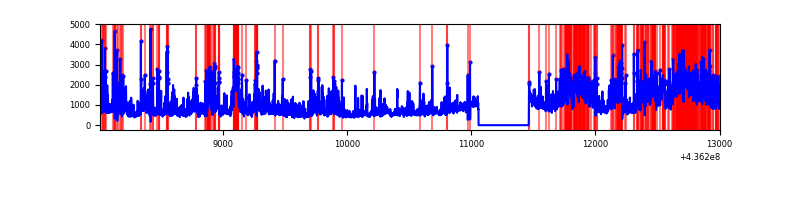 |
Top three noisy pixels from each quadrant. If the there are fewer than three noisy pixels in the level2.evt file, extra rows are filled as -1
| Pixel properties | Quadrant properties | ||||||
|---|---|---|---|---|---|---|---|
| Quadrant | DetID | PixID | Counts | Sigma | Mean | Median | Sigma |
| A | 15 | 222 | 2191693 | 19817.49 | 522 | 510 | 110.6 |
| A | 10 | 83 | 512529 | 4630.8 | 522 | 510 | 110.6 |
| A | 15 | 192 | 465707 | 4207.33 | 522 | 510 | 110.6 |
| B | 5 | 235 | 198682 | 1814.73 | 543 | 527 | 109.2 |
| B | 12 | 3 | 41677 | 376.86 | 543 | 527 | 109.2 |
| B | 10 | 245 | 25250 | 226.42 | 543 | 527 | 109.2 |
| C | 15 | 157 | 1121464 | 8881.35 | 526 | 528 | 126.2 |
| C | 3 | 233 | 26797 | 208.13 | 526 | 528 | 126.2 |
| C | 14 | 254 | 21293 | 164.52 | 526 | 528 | 126.2 |
| D | 8 | 48 | 500173 | 3738.48 | 514 | 496 | 133.7 |
| D | 12 | 33 | 485817 | 3631.07 | 514 | 496 | 133.7 |
| D | 1 | 52 | 409354 | 3058.99 | 514 | 496 | 133.7 |
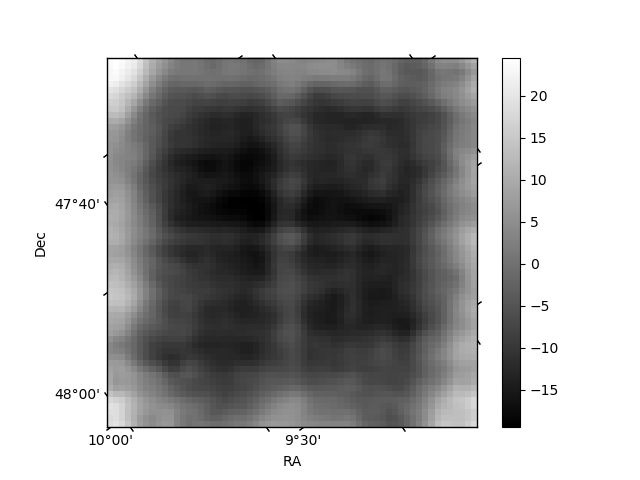
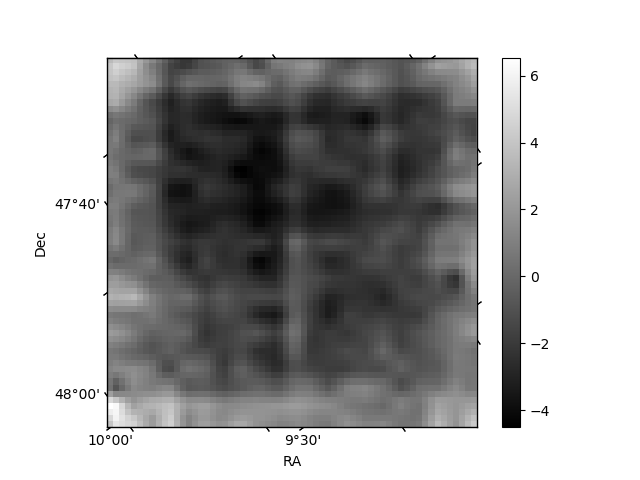
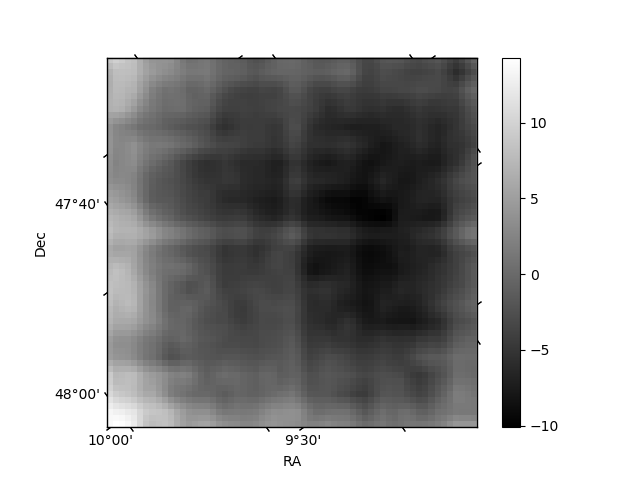
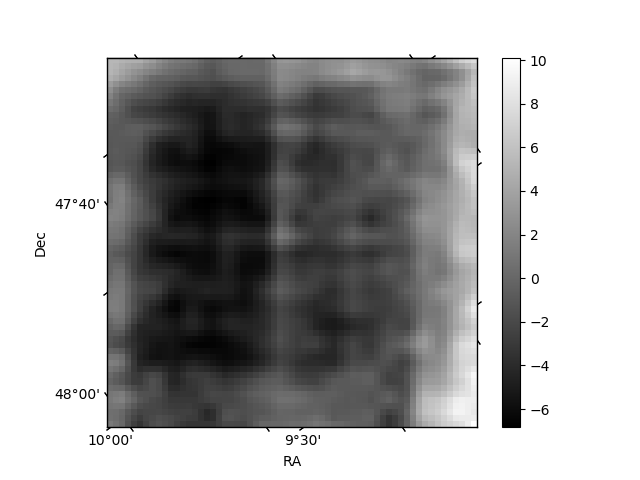
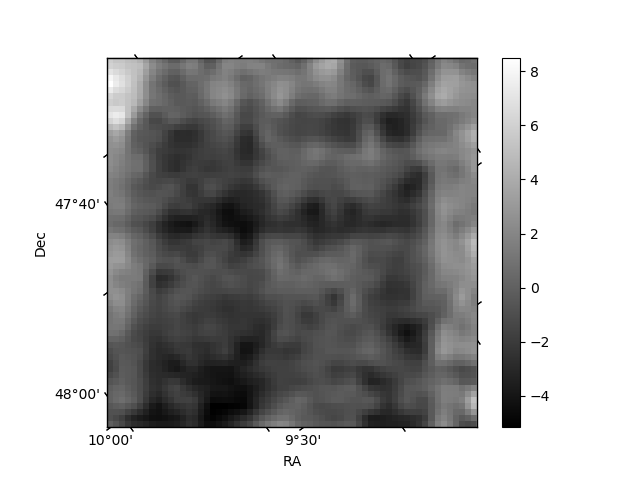
Histogram calculated using DETX and DETY for each event in the final _common_clean file
| Quadrant A | 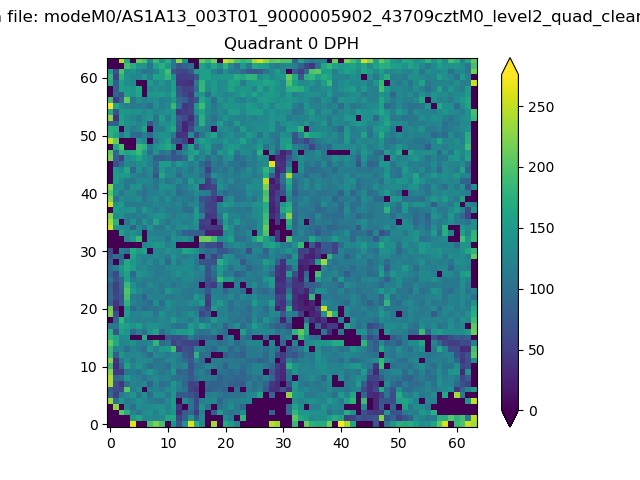 |
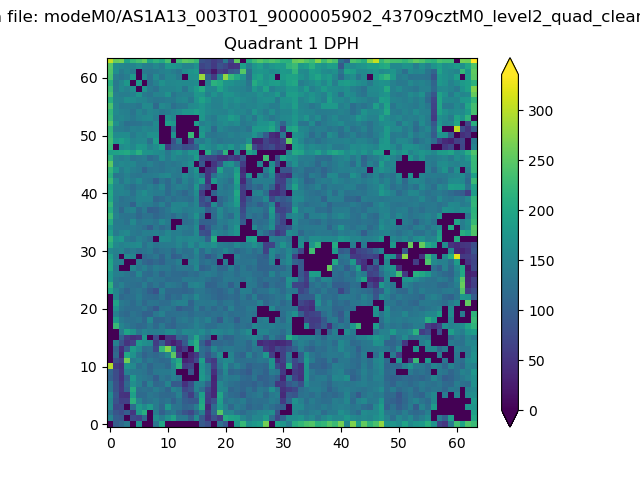 |
Quadrant B |
|---|---|---|---|
| Quadrant D | 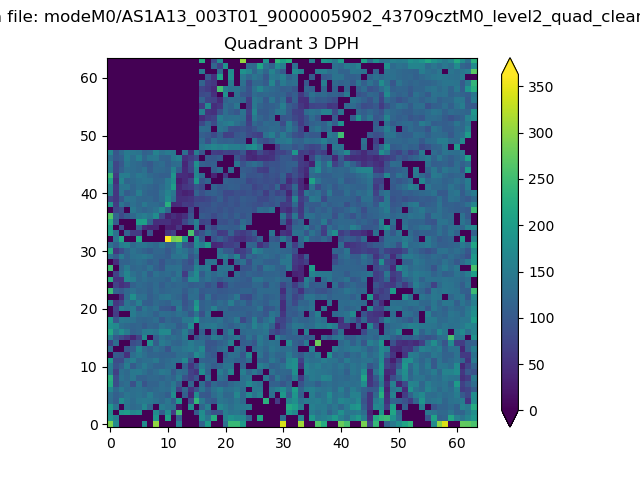 |
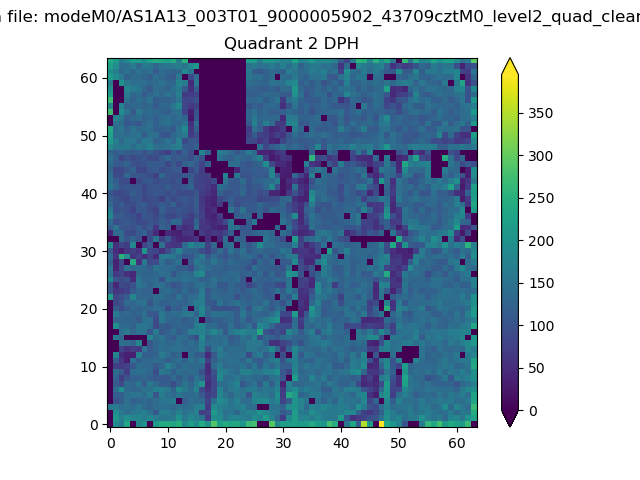 |
Quadrant C |
| Plot type | Count rate plots | Images |
|---|---|---|
| Comparison with Poisson distribution Blue bars denote a histogram of data divided into 1 sec bins. Red curve is a Poisson curve with rate = median count rate of data. |
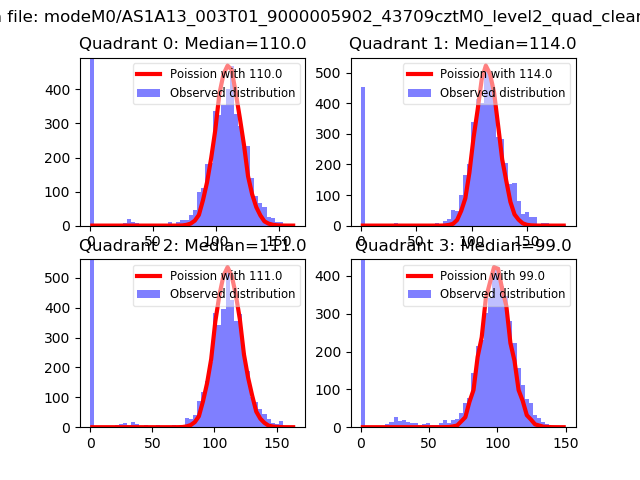 |
 |
| Quadrant-wise count rates Data is divided into 100 sec bins |
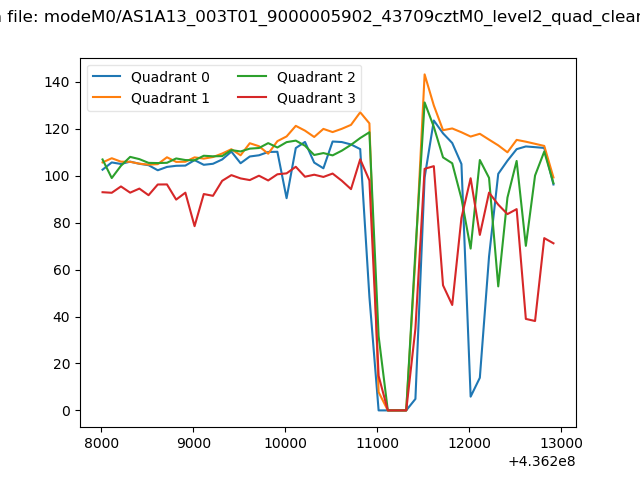 |
|
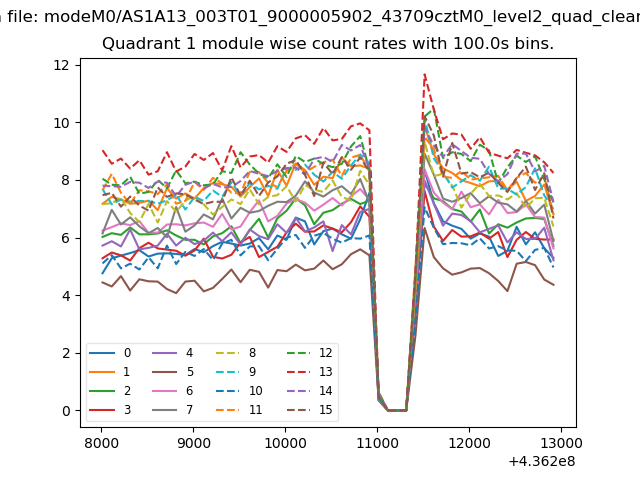
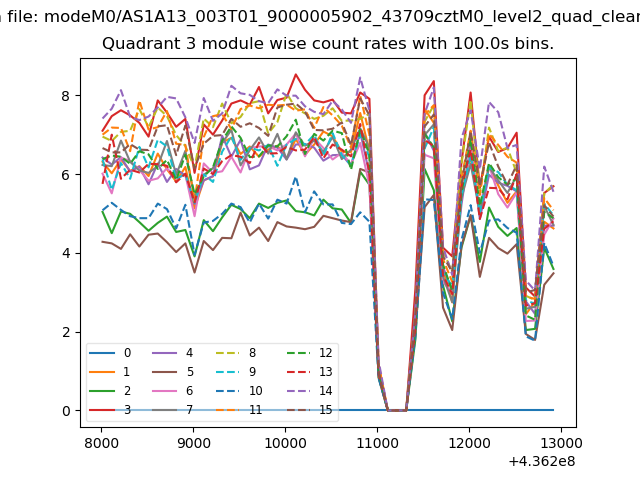
| Module-wise count rates for Quadrant A Data is divided into 100 sec bins |
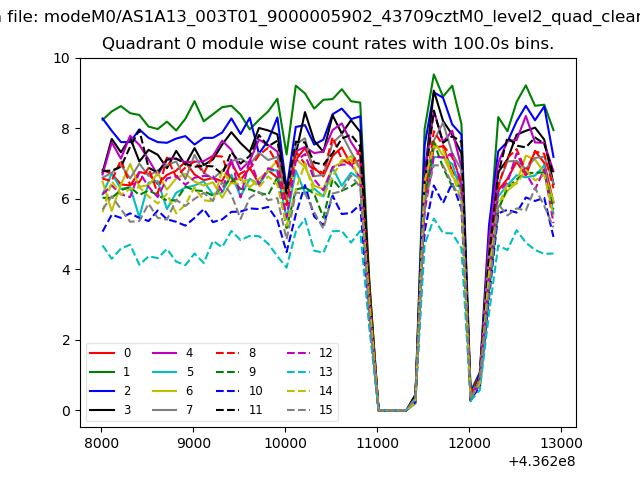 |
 |
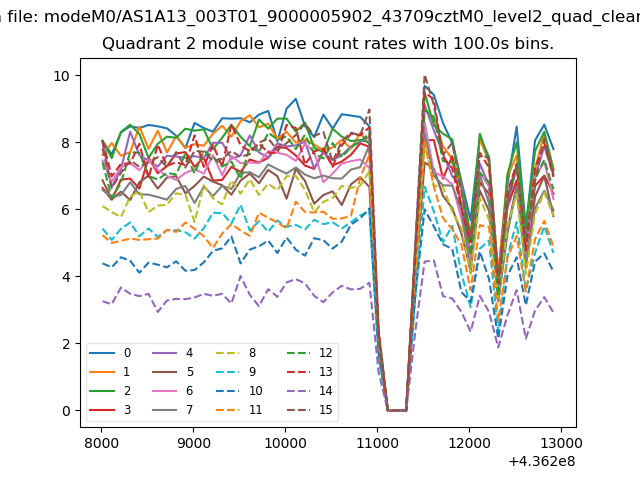
| Module-wise count rates for Quadrant B Data is divided into 100 sec bins |
 |
 |
| Module-wise count rates for Quadrant C Data is divided into 100 sec bins |
 |
 |
| Module-wise count rates for Quadrant D Data is divided into 100 sec bins |
 |
 |
| Parameter | Plot |
|---|---|
| CZT HV Monitor | 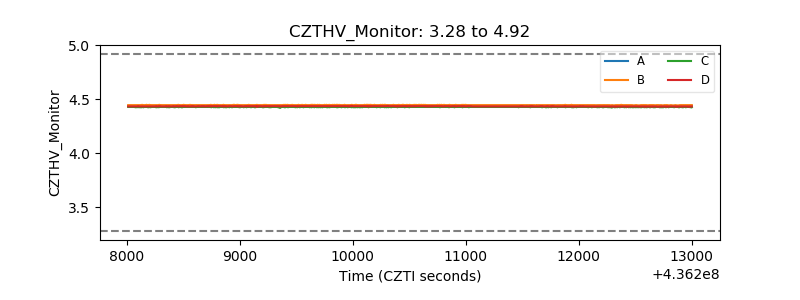 |
| D_VDD | 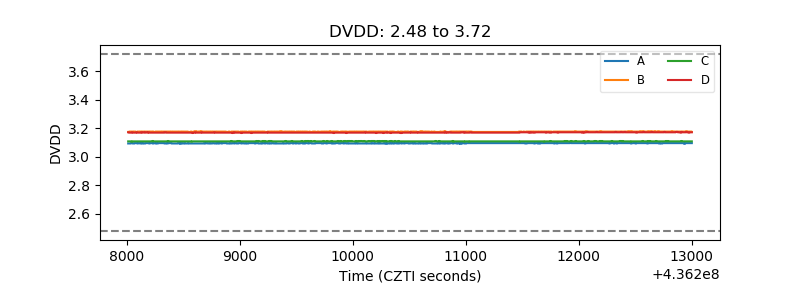 |
| Temperature 1 | 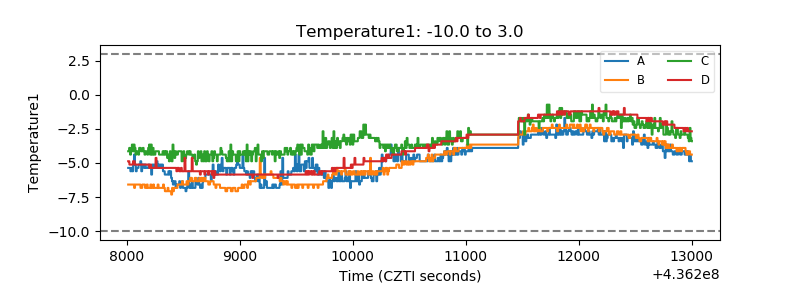 |
| Veto HV Monitor | 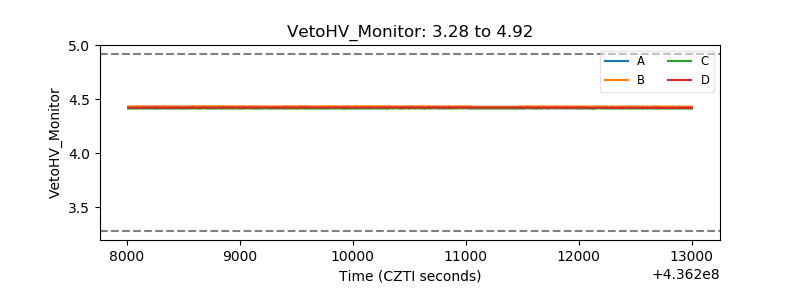 |
| Veto LLD | 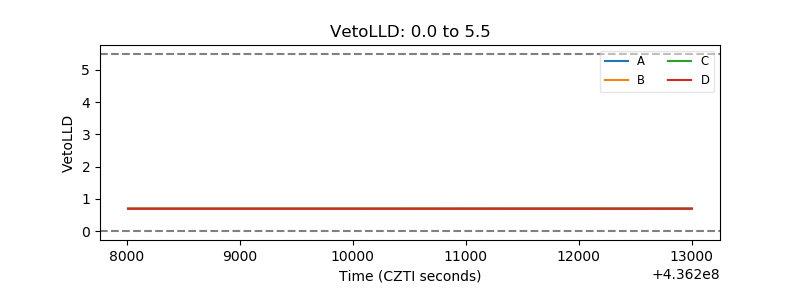 |
| Alpha Counter | 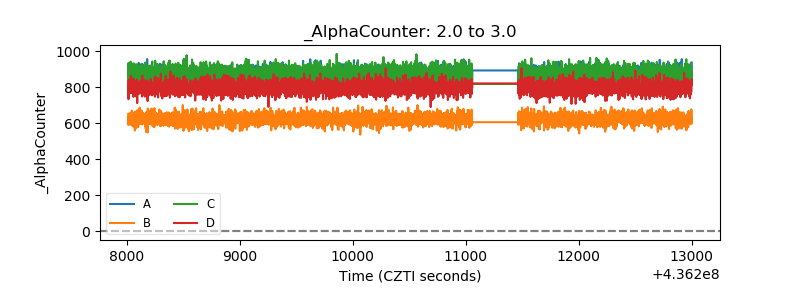 |
| _CPM_Rate | 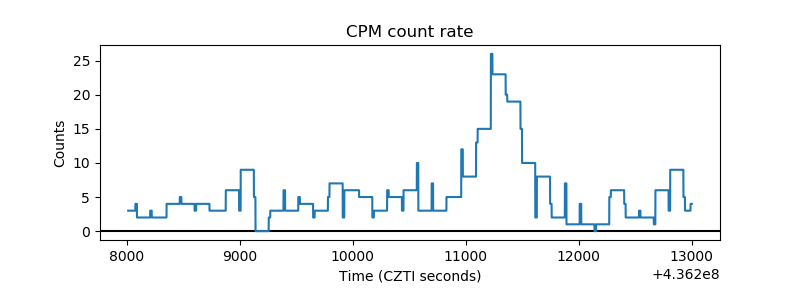 |
| CZT Counter | 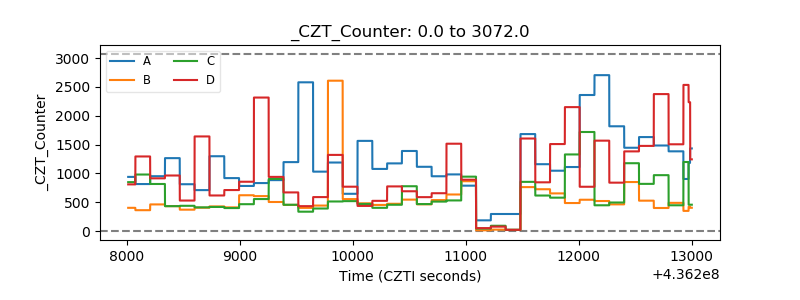 |
| +2.5 Volts monitor | 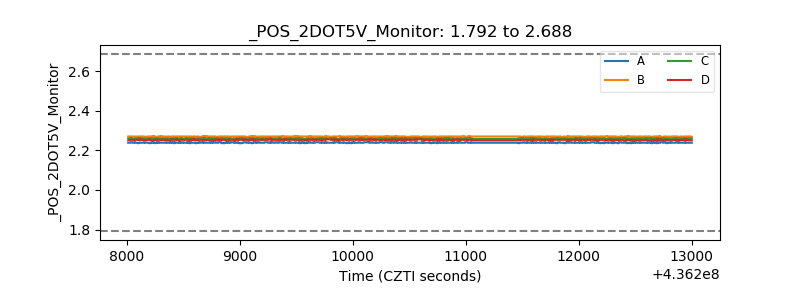 |
| +5 Volts monitor | 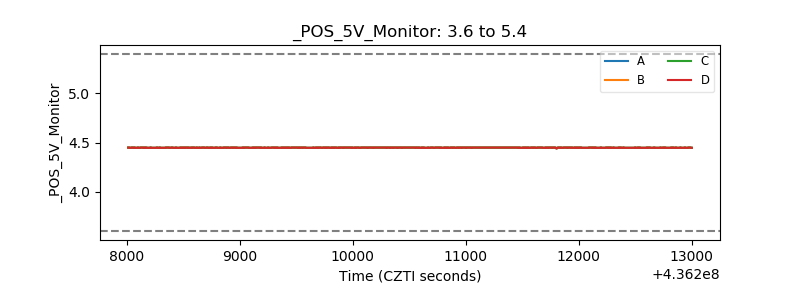 |
| _ROLL_ROT | 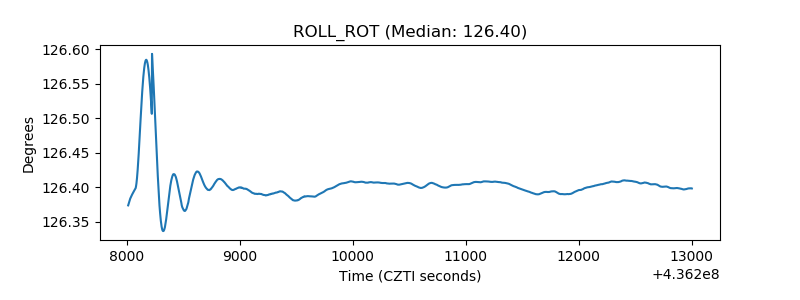 |
| _Roll_DEC | 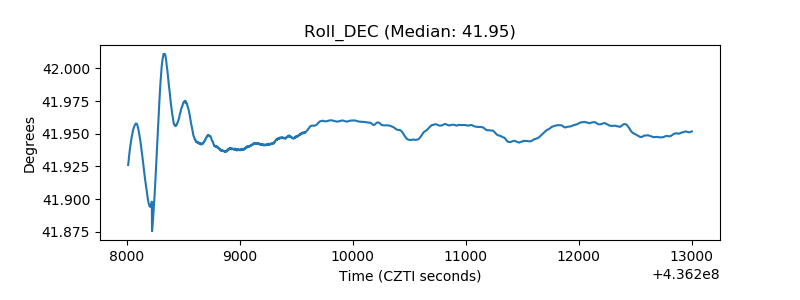 |
| _Roll_RA | 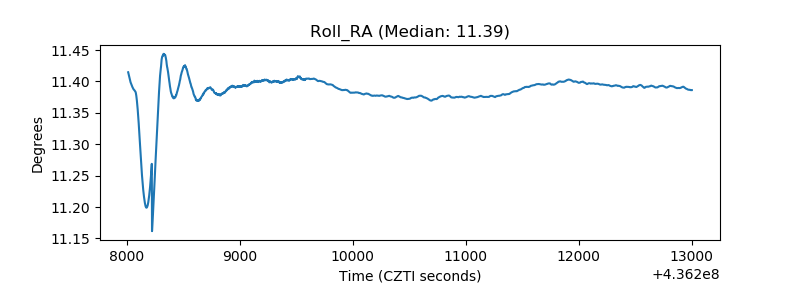 |
| Veto Counter | 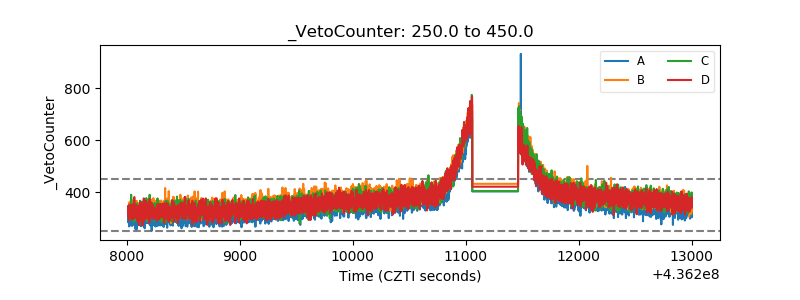 |