| Param | Original file | Final file |
|---|---|---|
| Filename | modeM0/AS1A13_003T01_9000005902_43710cztM0_level2.fits | modeM0/AS1A13_003T01_9000005902_43710cztM0_level2_quad_clean.evt |
| Size (bytes) | 836,602,560 | 119,943,360 |
| Size | 797.8 MB | 114.4 MB |
| Events in quadrant A | 9,862,366 | 793,372 |
| Events in quadrant B | 4,239,483 | 874,501 |
| Events in quadrant C | 6,899,584 | 764,024 |
| Events in quadrant D | 9,367,419 | 659,329 |
| Mode SS | |||
|---|---|---|---|
| Quadrant | BADHDUFLAG | Total packets | Discarded packets |
| A | 0 | 154 | 0 |
| B | 0 | 154 | 0 |
| C | 0 | 154 | 0 |
| D | 0 | 154 | 0 |
| Mode M0 | |||
|---|---|---|---|
| Quadrant | BADHDUFLAG | Total packets | Discarded packets |
| A | 0 | 34799 | 0 |
| B | 0 | 17933 | 0 |
| C | 0 | 25835 | 0 |
| D | 0 | 33191 | 0 |
| Quadrant | Total seconds | Saturated seconds | Saturation percentage |
|---|---|---|---|
| A | 7769 | 807 | 10.387437% |
| B | 7769 | 172 | 2.213927% |
| C | 7770 | 871 | 11.209781% |
| D | 7769 | 1471 | 18.934226% |
Noise dominated data is calculated using 1-second bins in cleaned event files. If a bin has >2000 counts, and if more than 50% of those come from <1% of pixels, then it is considered to be noise-dominated and hence unusable.
| Quadrant | # 1 sec bins | Bins with >0 counts | Bins with >2000 counts | High rate bins dominated by noise | Noise dominated (total time) | Noise dominated (detector-on time) | Marked lightcurve |
|---|---|---|---|---|---|---|---|
| A | 7769 | 7769 | 290 | 290 | 3.73% | 3.73% | 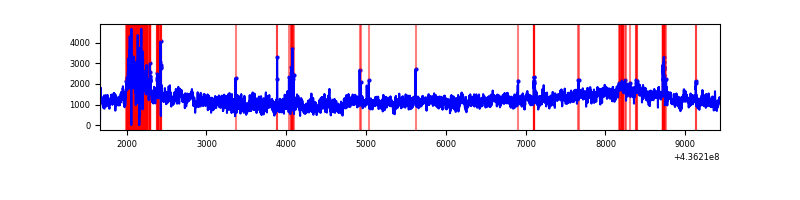 |
| B | 7769 | 7769 | 85 | 85 | 1.09% | 1.09% | 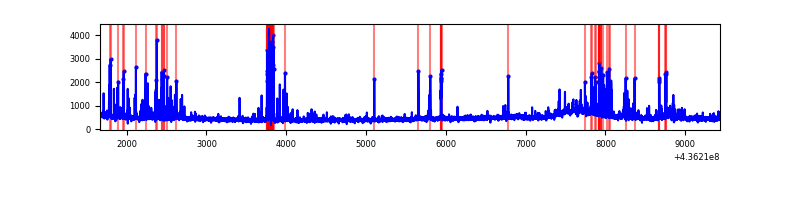 |
| C | 7770 | 7770 | 621 | 621 | 7.99% | 7.99% | 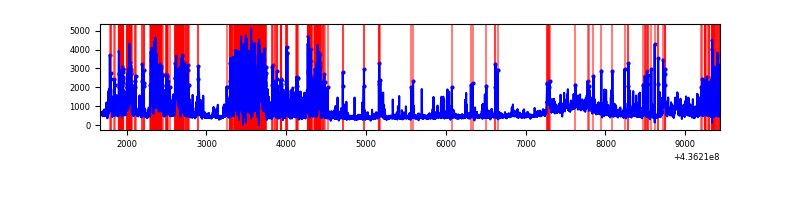 |
| D | 7769 | 7769 | 1028 | 1028 | 13.23% | 13.23% | 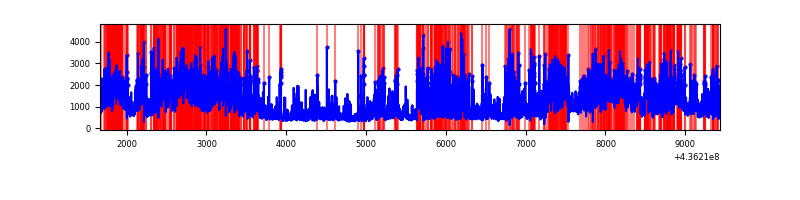 |
Top three noisy pixels from each quadrant. If the there are fewer than three noisy pixels in the level2.evt file, extra rows are filled as -1
| Pixel properties | Quadrant properties | ||||||
|---|---|---|---|---|---|---|---|
| Quadrant | DetID | PixID | Counts | Sigma | Mean | Median | Sigma |
| A | 15 | 222 | 4365074 | 24157.83 | 869 | 851 | 180.7 |
| A | 10 | 83 | 846883 | 4683.15 | 869 | 851 | 180.7 |
| A | 14 | 63 | 653144 | 3610.72 | 869 | 851 | 180.7 |
| B | 5 | 235 | 498892 | 2824.02 | 892 | 864 | 176.4 |
| B | 0 | 199 | 81799 | 458.93 | 892 | 864 | 176.4 |
| B | 4 | 206 | 46485 | 258.69 | 892 | 864 | 176.4 |
| C | 15 | 157 | 2628111 | 13005.06 | 847 | 851 | 202.0 |
| C | 3 | 233 | 562776 | 2781.56 | 847 | 851 | 202.0 |
| C | 15 | 158 | 196017 | 966.08 | 847 | 851 | 202.0 |
| D | 12 | 33 | 1112629 | 5205.79 | 832 | 806 | 213.6 |
| D | 8 | 48 | 775490 | 3627.23 | 832 | 806 | 213.6 |
| D | 5 | 235 | 695803 | 3254.12 | 832 | 806 | 213.6 |
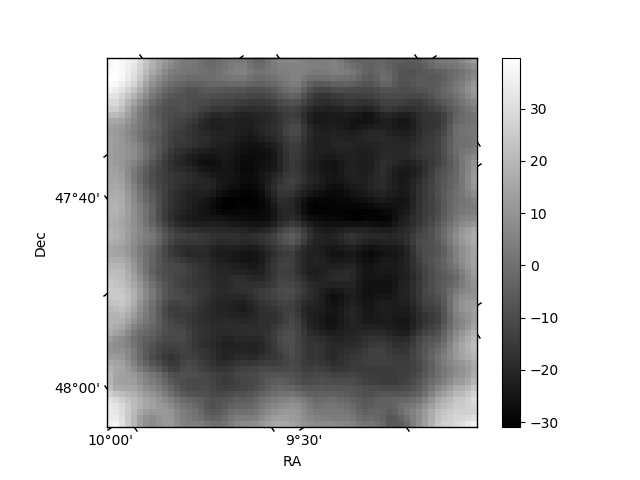
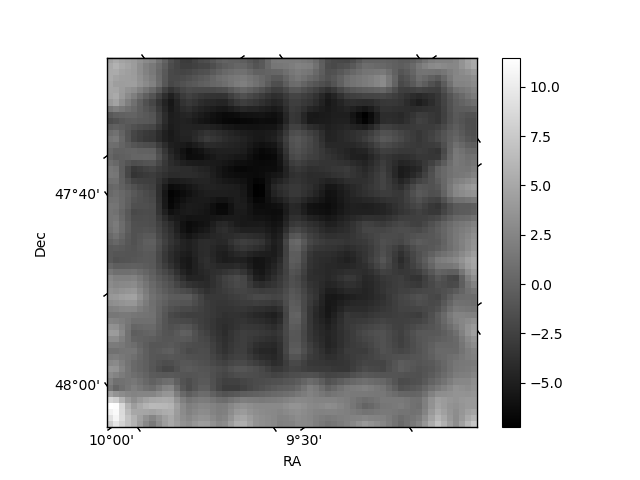
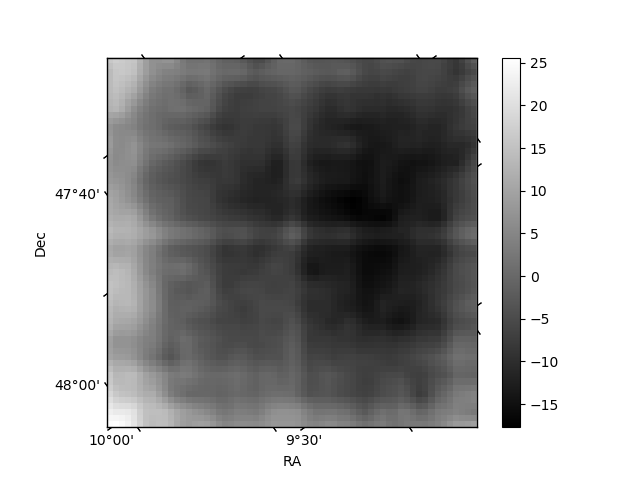
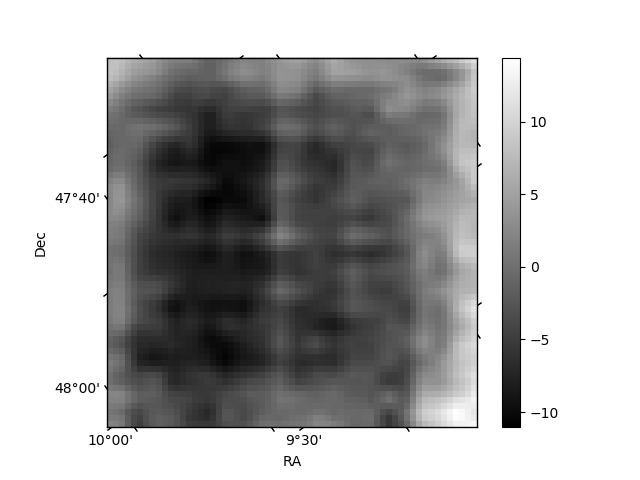
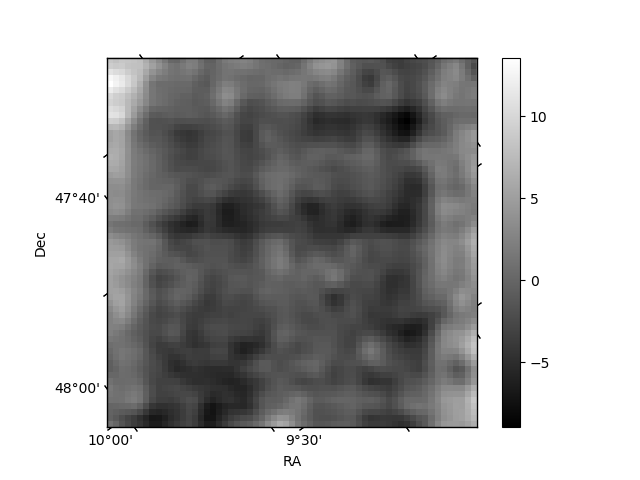
Histogram calculated using DETX and DETY for each event in the final _common_clean file
| Quadrant A | 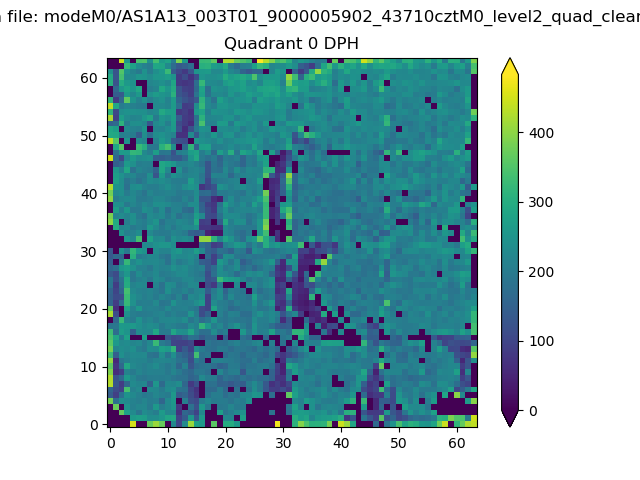 |
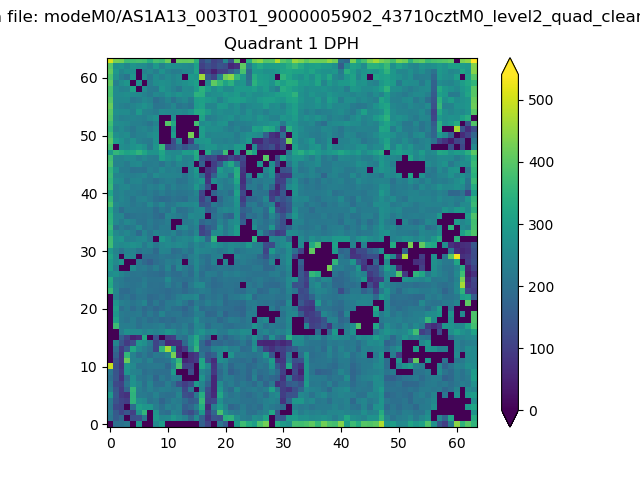 |
Quadrant B |
|---|---|---|---|
| Quadrant D | 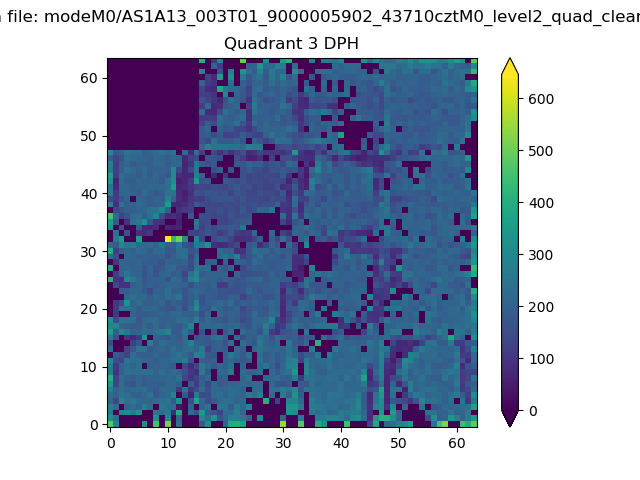 |
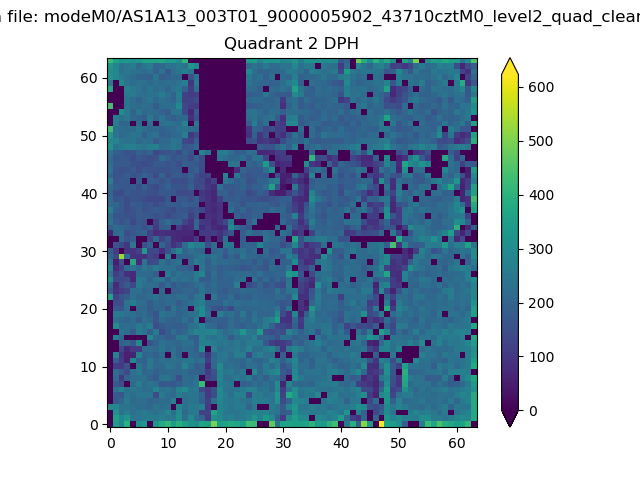 |
Quadrant C |
| Plot type | Count rate plots | Images |
|---|---|---|
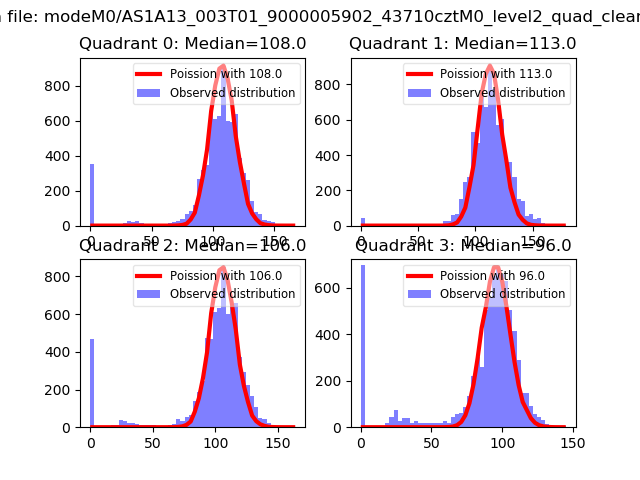
| Comparison with Poisson distribution Blue bars denote a histogram of data divided into 1 sec bins. Red curve is a Poisson curve with rate = median count rate of data. |
 |
 |
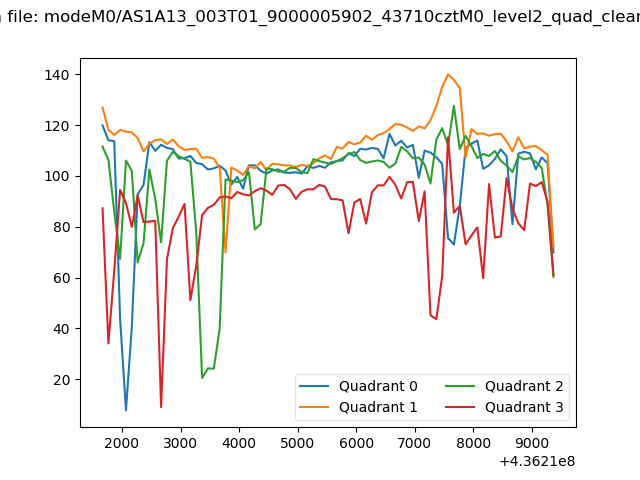
| Quadrant-wise count rates Data is divided into 100 sec bins |
 |
|
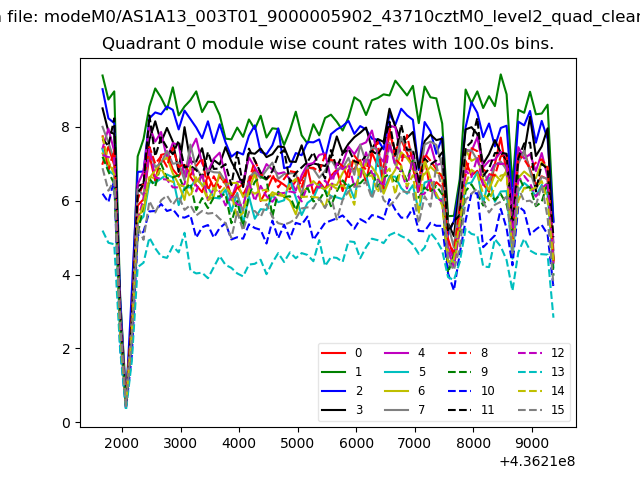
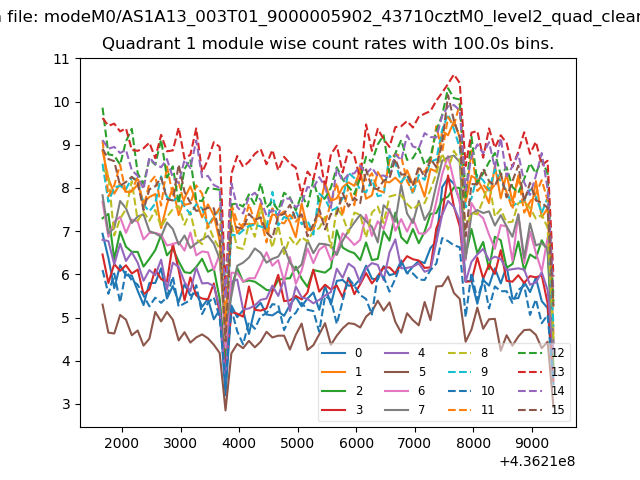
| Module-wise count rates for Quadrant A Data is divided into 100 sec bins |
 |
 |
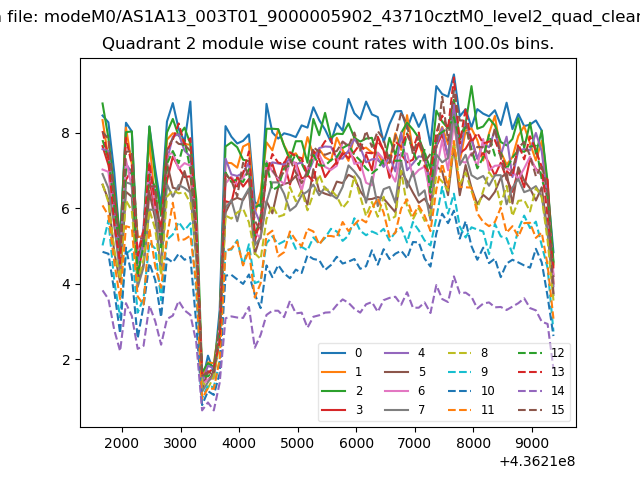
| Module-wise count rates for Quadrant B Data is divided into 100 sec bins |
 |
 |
| Module-wise count rates for Quadrant C Data is divided into 100 sec bins |
 |
 |
| Module-wise count rates for Quadrant D Data is divided into 100 sec bins |
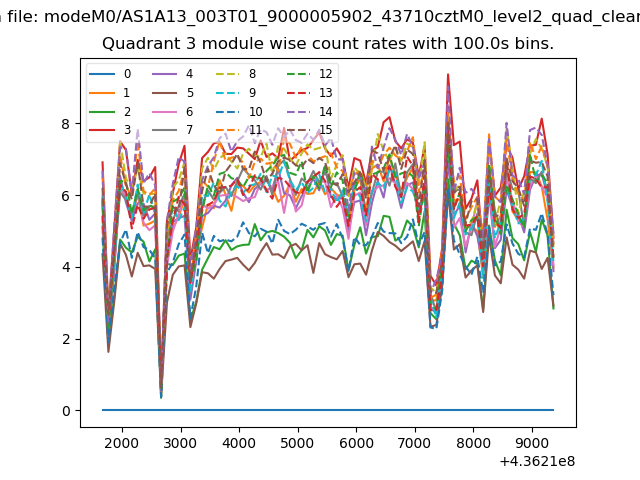 |
 |
| Parameter | Plot |
|---|---|
| CZT HV Monitor | 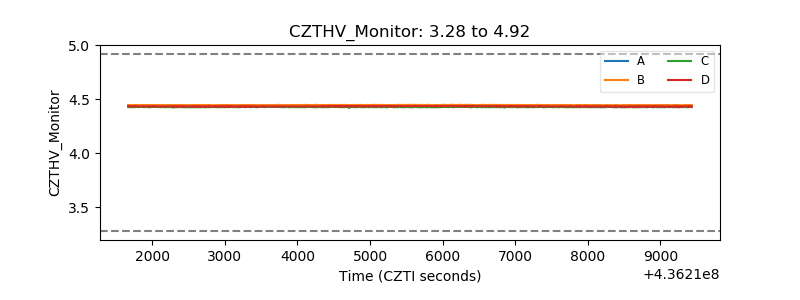 |
| D_VDD | 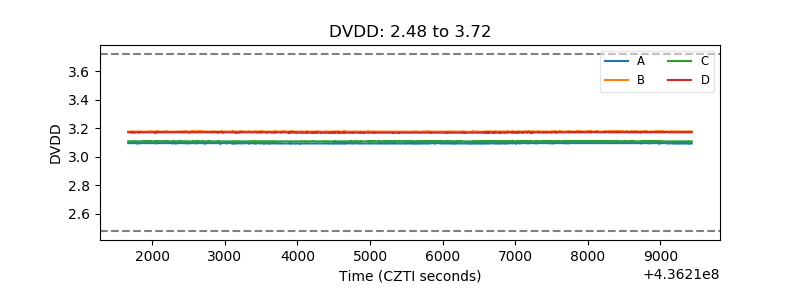 |
| Temperature 1 | 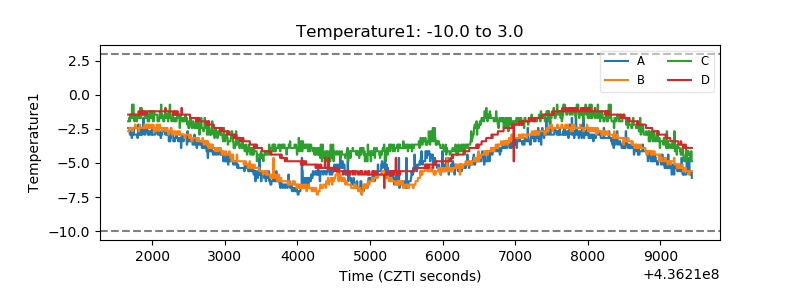 |
| Veto HV Monitor | 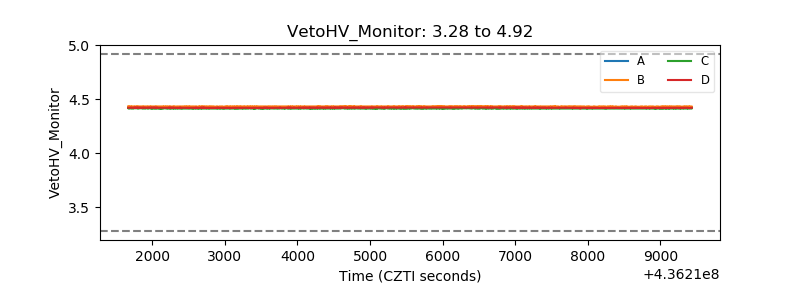 |
| Veto LLD | 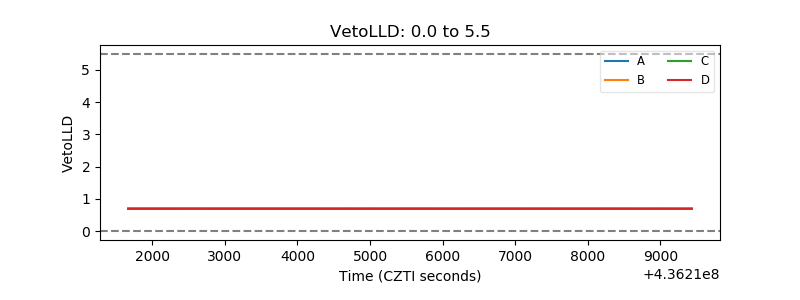 |
| Alpha Counter | 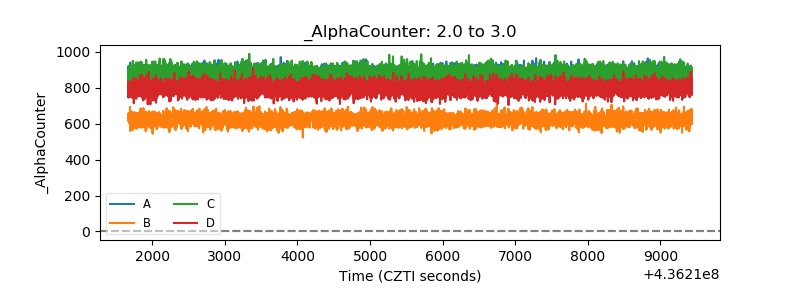 |
| _CPM_Rate | 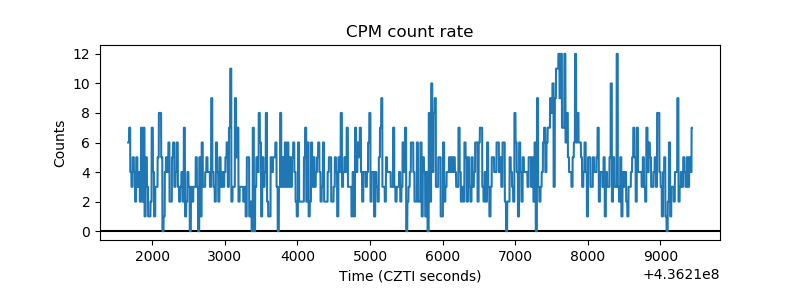 |
| CZT Counter | 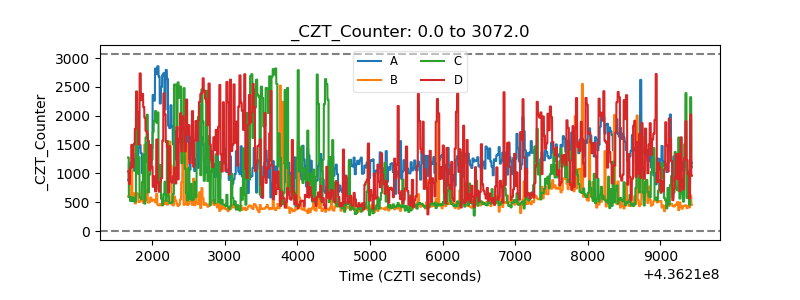 |
| +2.5 Volts monitor | 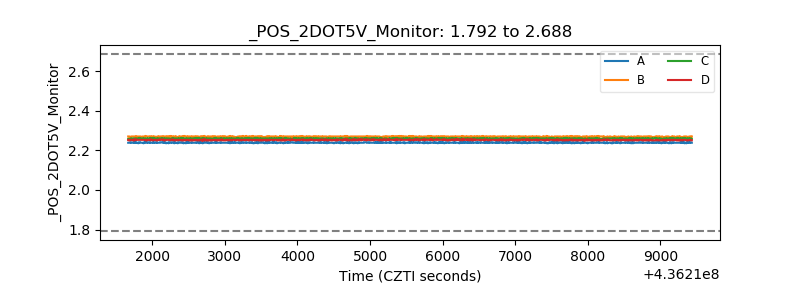 |
| +5 Volts monitor | 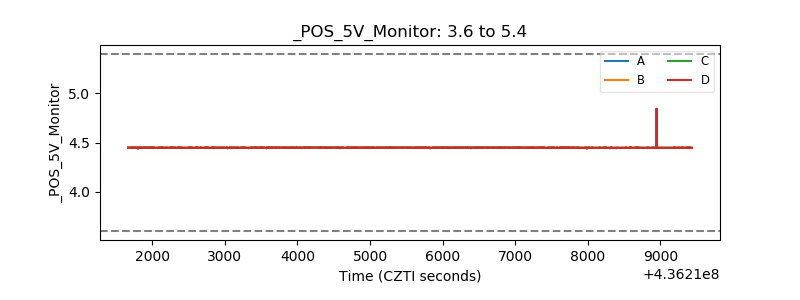 |
| _ROLL_ROT |  |
| _Roll_DEC | 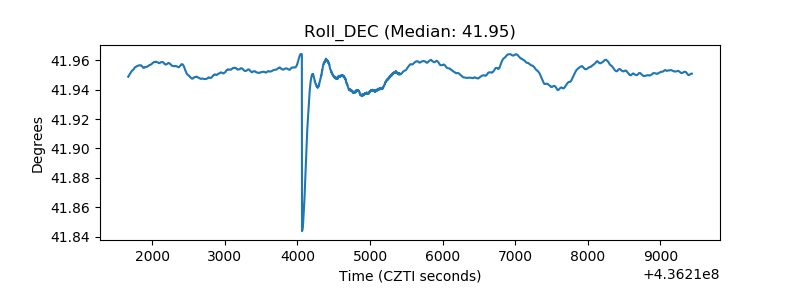 |
| _Roll_RA | 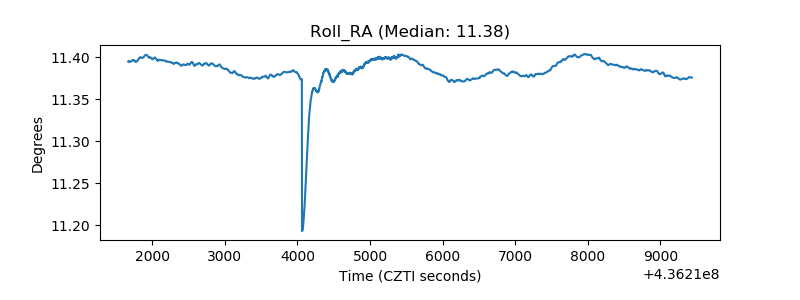 |
| Veto Counter | 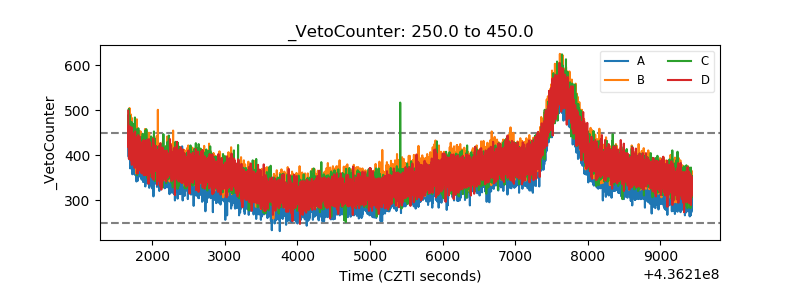 |