| Param | Original file | Final file |
|---|---|---|
| Filename | modeM0/AS1A13_003T01_9000005902_43711cztM0_level2.fits | modeM0/AS1A13_003T01_9000005902_43711cztM0_level2_quad_clean.evt |
| Size (bytes) | 780,811,200 | 114,914,880 |
| Size | 744.6 MB | 109.6 MB |
| Events in quadrant A | 9,651,897 | 752,145 |
| Events in quadrant B | 4,122,679 | 816,942 |
| Events in quadrant C | 6,433,630 | 749,688 |
| Events in quadrant D | 8,124,882 | 646,067 |
| Mode SS | |||
|---|---|---|---|
| Quadrant | BADHDUFLAG | Total packets | Discarded packets |
| A | 0 | 148 | 0 |
| B | 0 | 148 | 0 |
| C | 0 | 148 | 0 |
| D | 0 | 148 | 0 |
| Mode M0 | |||
|---|---|---|---|
| Quadrant | BADHDUFLAG | Total packets | Discarded packets |
| A | 0 | 33878 | 0 |
| B | 0 | 17331 | 0 |
| C | 0 | 24146 | 0 |
| D | 0 | 29282 | 0 |
| Quadrant | Total seconds | Saturated seconds | Saturation percentage |
|---|---|---|---|
| A | 7387 | 706 | 9.557330% |
| B | 7388 | 183 | 2.476990% |
| C | 7388 | 683 | 9.244721% |
| D | 7388 | 1036 | 14.022740% |
Noise dominated data is calculated using 1-second bins in cleaned event files. If a bin has >2000 counts, and if more than 50% of those come from <1% of pixels, then it is considered to be noise-dominated and hence unusable.
| Quadrant | # 1 sec bins | Bins with >0 counts | Bins with >2000 counts | High rate bins dominated by noise | Noise dominated (total time) | Noise dominated (detector-on time) | Marked lightcurve |
|---|---|---|---|---|---|---|---|
| A | 7387 | 7387 | 347 | 347 | 4.70% | 4.70% | 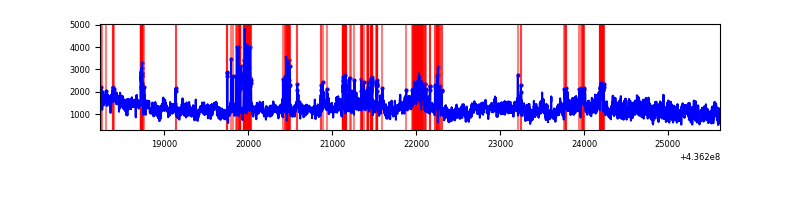 |
| B | 7388 | 7388 | 82 | 82 | 1.11% | 1.11% | 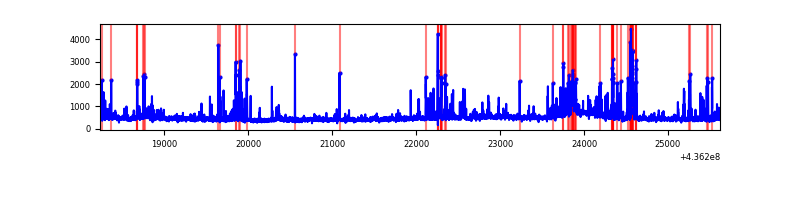 |
| C | 7388 | 7388 | 510 | 510 | 6.90% | 6.90% | 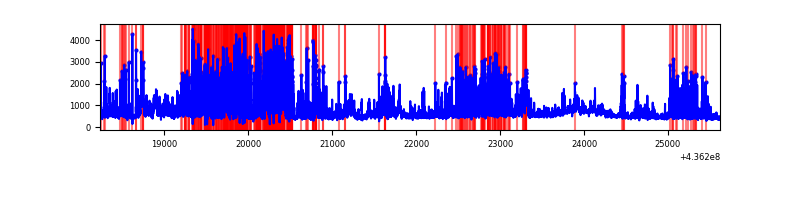 |
| D | 7388 | 7388 | 697 | 697 | 9.43% | 9.43% | 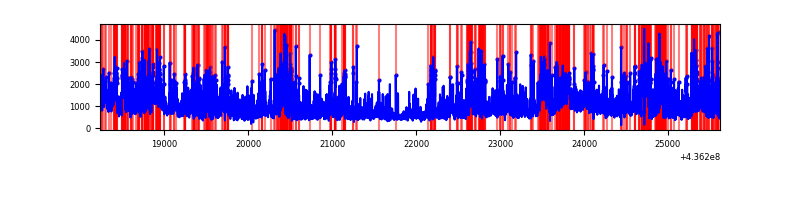 |
Top three noisy pixels from each quadrant. If the there are fewer than three noisy pixels in the level2.evt file, extra rows are filled as -1
| Pixel properties | Quadrant properties | ||||||
|---|---|---|---|---|---|---|---|
| Quadrant | DetID | PixID | Counts | Sigma | Mean | Median | Sigma |
| A | 15 | 222 | 4340126 | 25608.88 | 812 | 794 | 169.4 |
| A | 10 | 83 | 790065 | 4657.94 | 812 | 794 | 169.4 |
| A | 15 | 223 | 692135 | 4080.0 | 812 | 794 | 169.4 |
| B | 5 | 235 | 631594 | 3835.95 | 828 | 799 | 164.4 |
| B | 0 | 199 | 147653 | 893.04 | 828 | 799 | 164.4 |
| B | 5 | 255 | 30155 | 178.52 | 828 | 799 | 164.4 |
| C | 15 | 157 | 1723417 | 9125.61 | 799 | 803 | 188.8 |
| C | 15 | 158 | 695105 | 3678.09 | 799 | 803 | 188.8 |
| C | 3 | 233 | 459470 | 2429.81 | 799 | 803 | 188.8 |
| D | 12 | 33 | 915847 | 4554.44 | 787 | 762 | 200.9 |
| D | 8 | 48 | 592614 | 2945.68 | 787 | 762 | 200.9 |
| D | 14 | 210 | 499167 | 2480.59 | 787 | 762 | 200.9 |
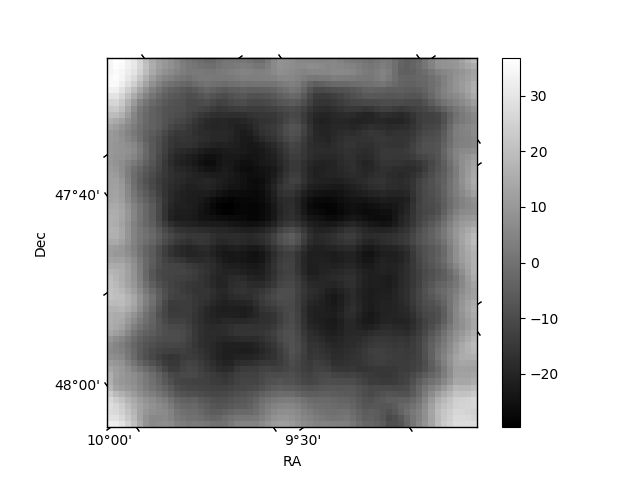
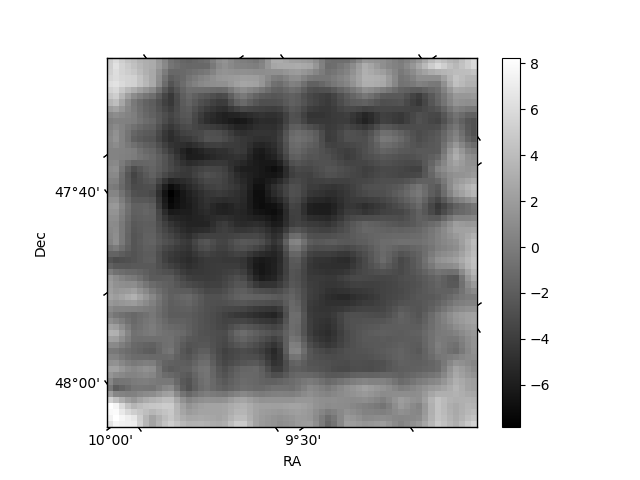
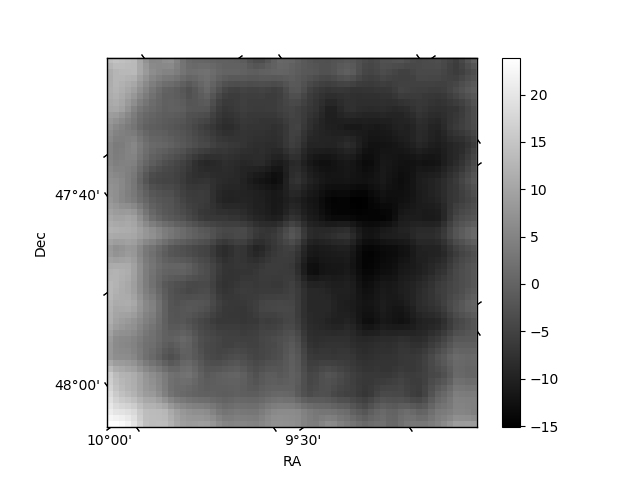
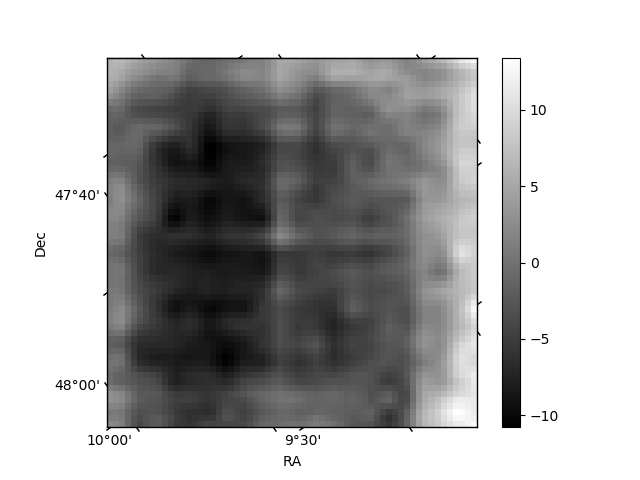
Histogram calculated using DETX and DETY for each event in the final _common_clean file
| Quadrant A | 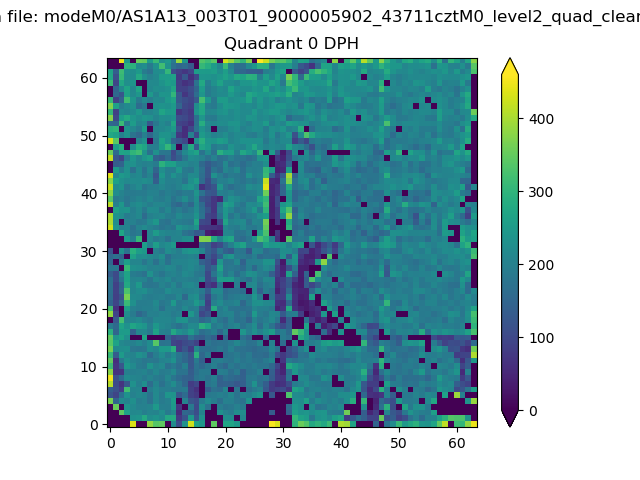 |
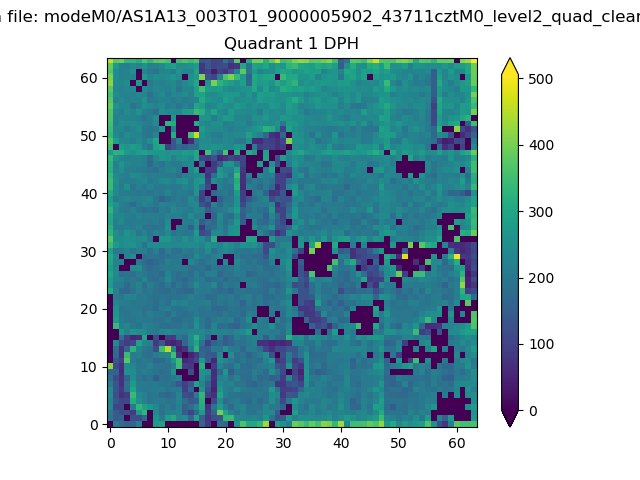 |
Quadrant B |
|---|---|---|---|
| Quadrant D | 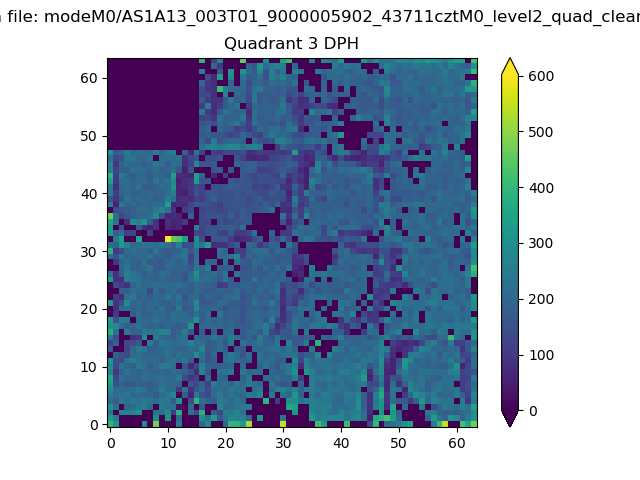 |
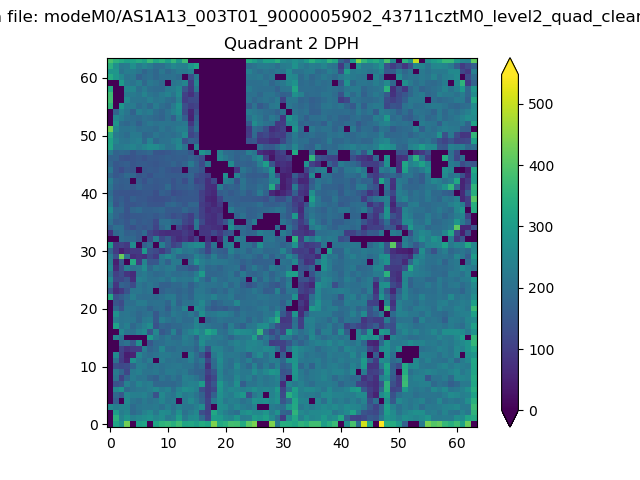 |
Quadrant C |
| Plot type | Count rate plots | Images |
|---|---|---|
| Comparison with Poisson distribution Blue bars denote a histogram of data divided into 1 sec bins. Red curve is a Poisson curve with rate = median count rate of data. |
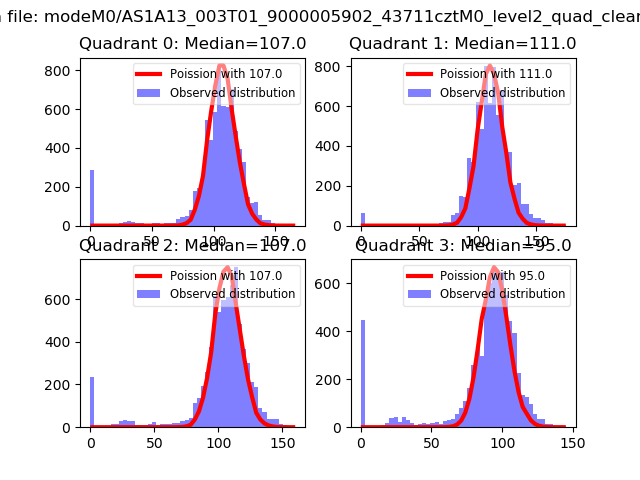 |
 |
| Quadrant-wise count rates Data is divided into 100 sec bins |
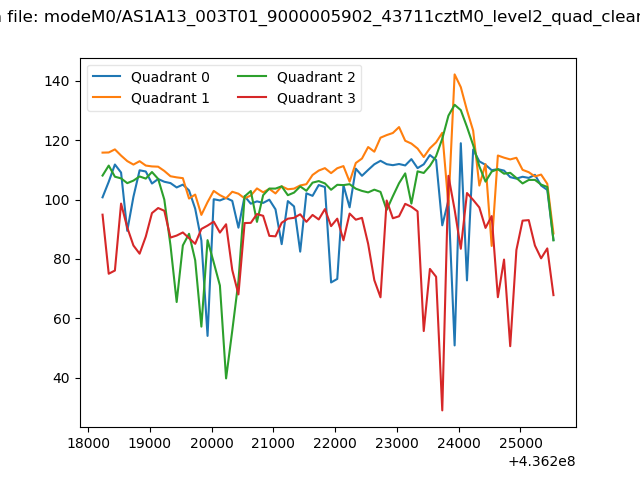 |
|
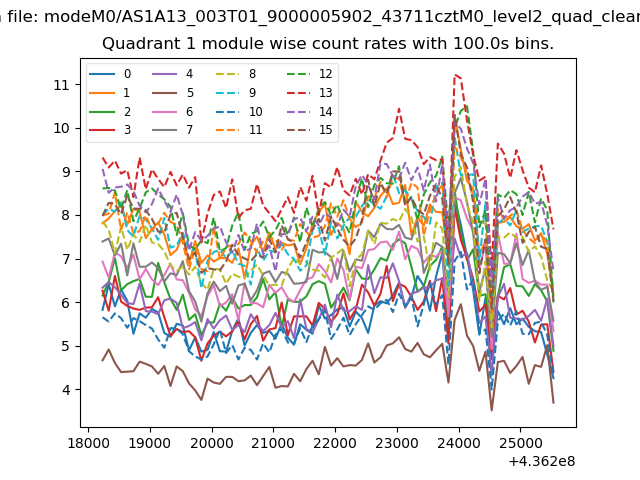
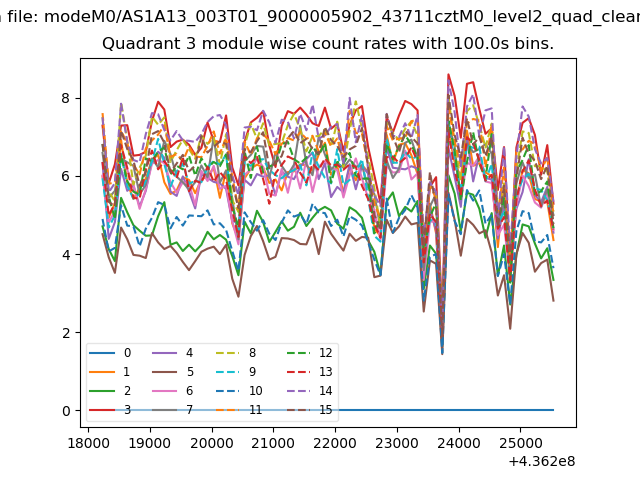
| Module-wise count rates for Quadrant A Data is divided into 100 sec bins |
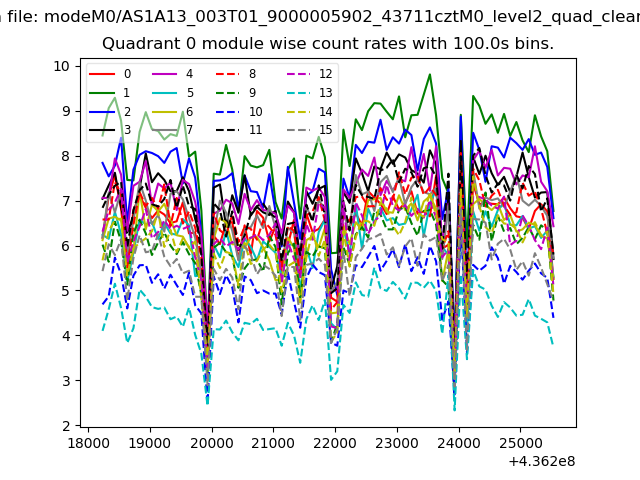 |
 |
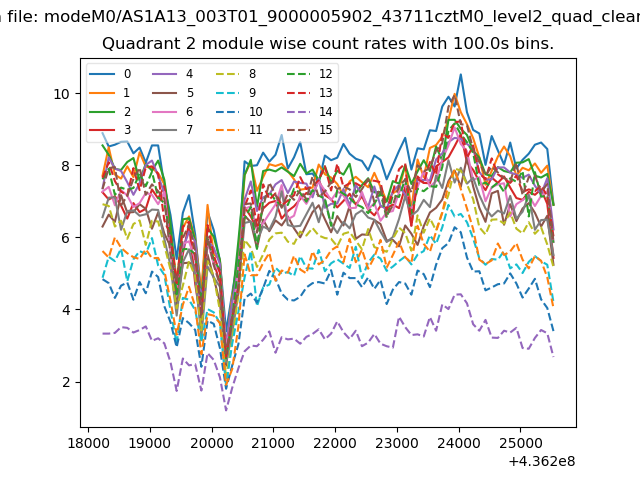
| Module-wise count rates for Quadrant B Data is divided into 100 sec bins |
 |
 |
| Module-wise count rates for Quadrant C Data is divided into 100 sec bins |
 |
 |
| Module-wise count rates for Quadrant D Data is divided into 100 sec bins |
 |
 |
| Parameter | Plot |
|---|---|
| CZT HV Monitor | 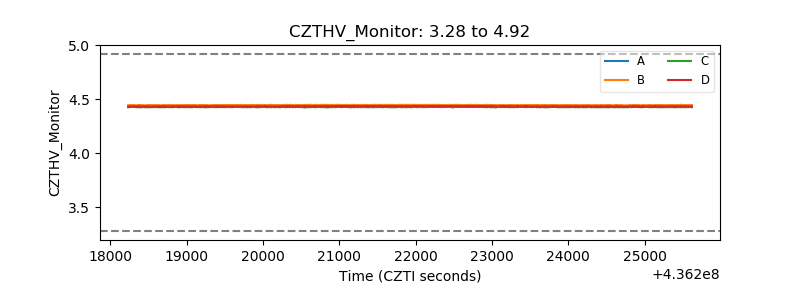 |
| D_VDD | 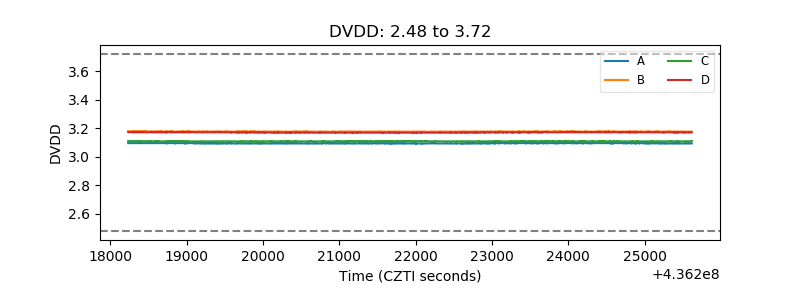 |
| Temperature 1 | 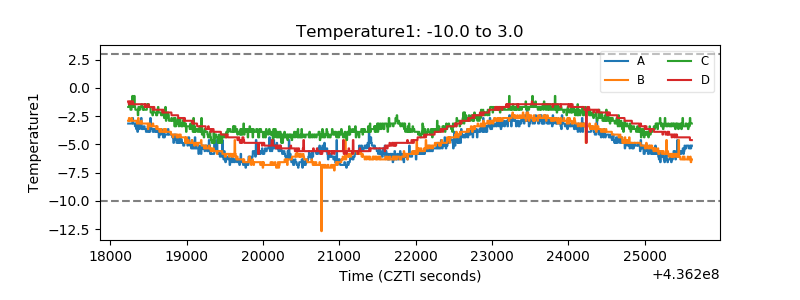 |
| Veto HV Monitor | 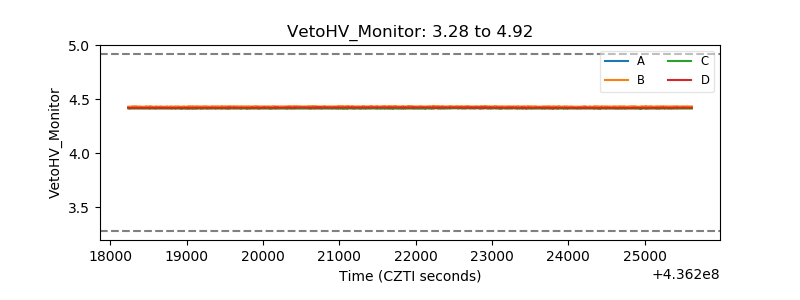 |
| Veto LLD | 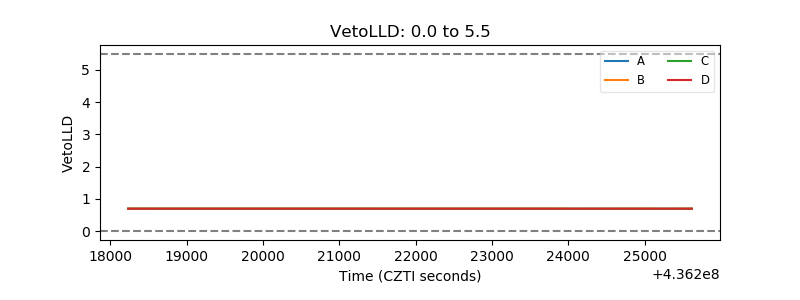 |
| Alpha Counter | 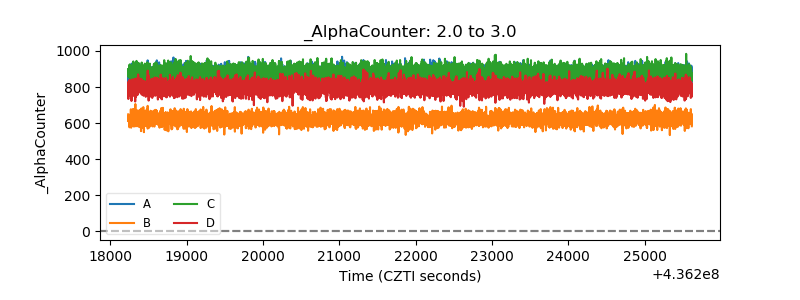 |
| _CPM_Rate | 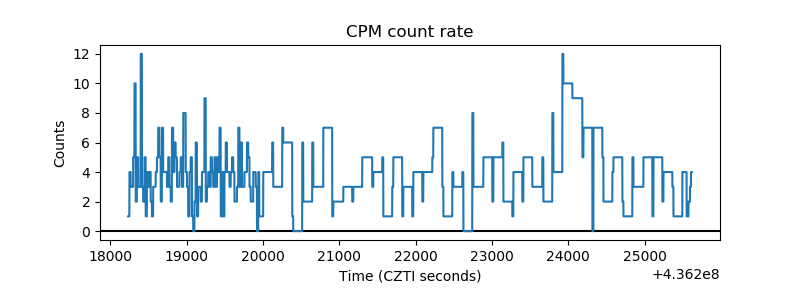 |
| CZT Counter | 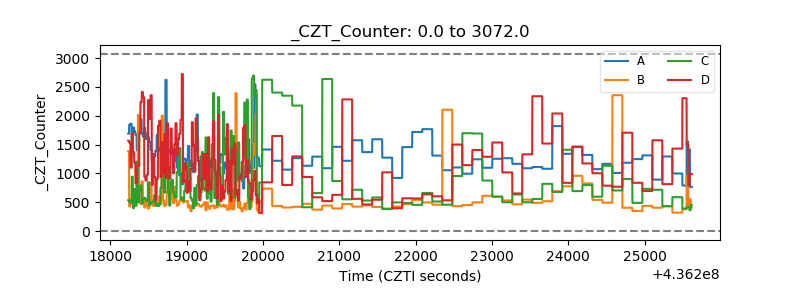 |
| +2.5 Volts monitor | 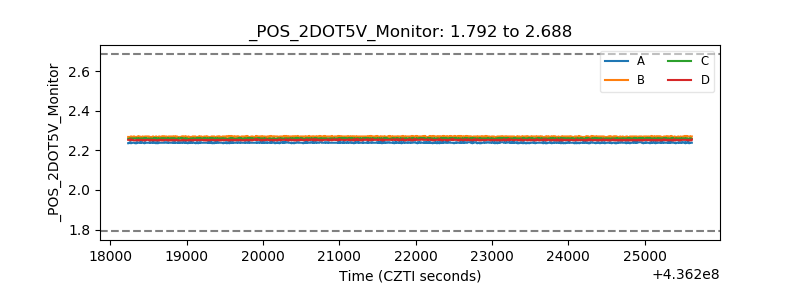 |
| +5 Volts monitor | 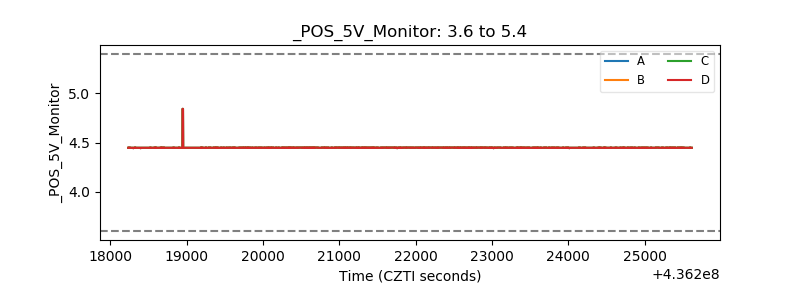 |
| _ROLL_ROT | 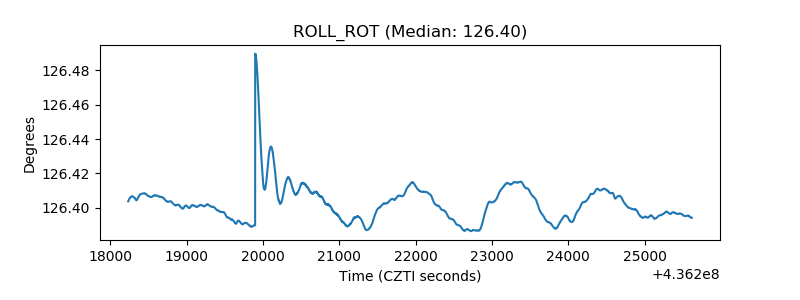 |
| _Roll_DEC | 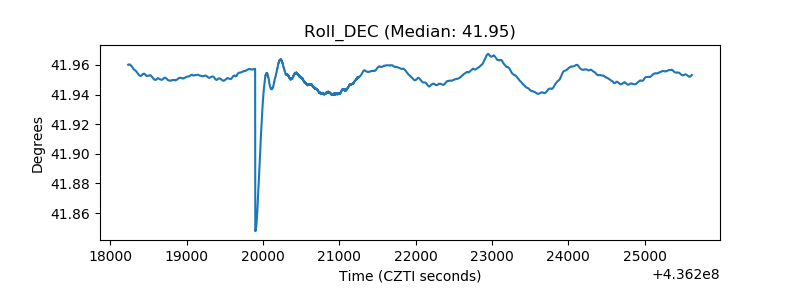 |
| _Roll_RA | 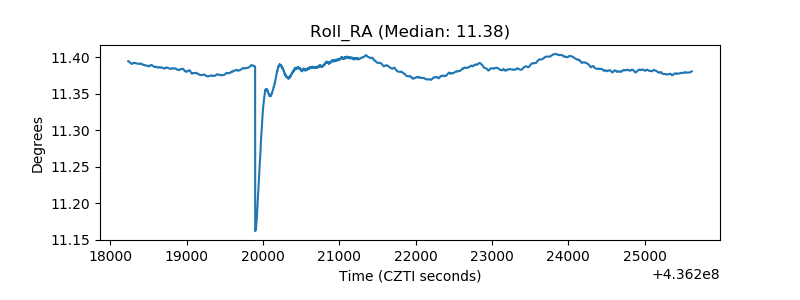 |
| Veto Counter | 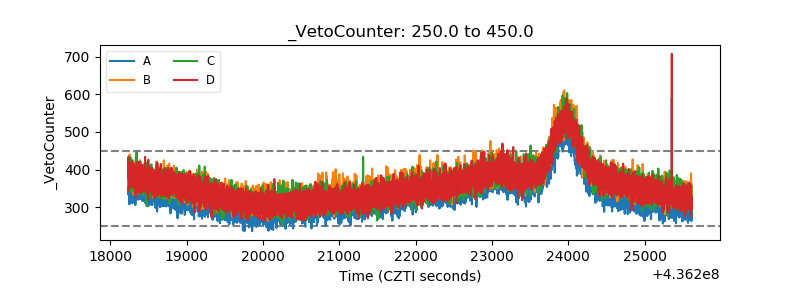 |