| Param | Original file | Final file |
|---|---|---|
| Filename | modeM0/AS1A13_003T01_9000005902_43712cztM0_level2.fits | modeM0/AS1A13_003T01_9000005902_43712cztM0_level2_quad_clean.evt |
| Size (bytes) | 808,738,560 | 118,267,200 |
| Size | 771.3 MB | 112.8 MB |
| Events in quadrant A | 10,082,710 | 750,188 |
| Events in quadrant B | 4,547,822 | 858,928 |
| Events in quadrant C | 6,316,455 | 745,357 |
| Events in quadrant D | 8,390,159 | 685,613 |
| Mode SS | |||
|---|---|---|---|
| Quadrant | BADHDUFLAG | Total packets | Discarded packets |
| A | 0 | 158 | 0 |
| B | 0 | 158 | 0 |
| C | 0 | 158 | 0 |
| D | 0 | 158 | 0 |
| Mode M0 | |||
|---|---|---|---|
| Quadrant | BADHDUFLAG | Total packets | Discarded packets |
| A | 0 | 35525 | 6 |
| B | 0 | 19135 | 2 |
| C | 0 | 24143 | 2 |
| D | 0 | 30420 | 2 |
| Quadrant | Total seconds | Saturated seconds | Saturation percentage |
|---|---|---|---|
| A | 7764 | 1162 | 14.966512% |
| B | 7764 | 305 | 3.928387% |
| C | 7764 | 947 | 12.197321% |
| D | 7765 | 1126 | 14.500966% |
Noise dominated data is calculated using 1-second bins in cleaned event files. If a bin has >2000 counts, and if more than 50% of those come from <1% of pixels, then it is considered to be noise-dominated and hence unusable.
| Quadrant | # 1 sec bins | Bins with >0 counts | Bins with >2000 counts | High rate bins dominated by noise | Noise dominated (total time) | Noise dominated (detector-on time) | Marked lightcurve |
|---|---|---|---|---|---|---|---|
| A | 7874 | 7766 | 338 | 338 | 4.29% | 4.35% | 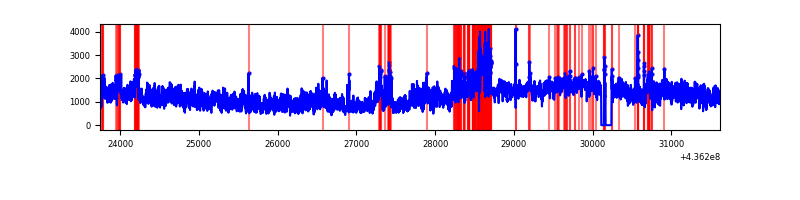 |
| B | 7874 | 7766 | 85 | 85 | 1.08% | 1.09% | 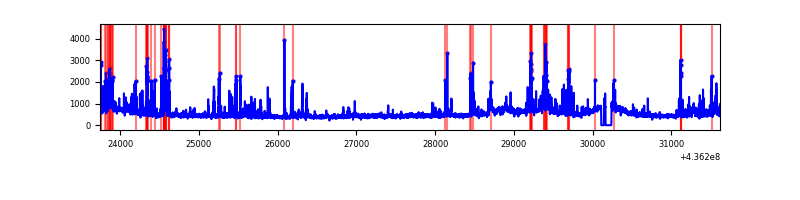 |
| C | 7874 | 7765 | 504 | 504 | 6.40% | 6.49% | 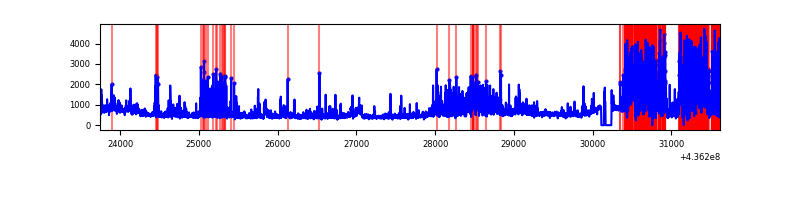 |
| D | 7875 | 7766 | 694 | 694 | 8.81% | 8.94% | 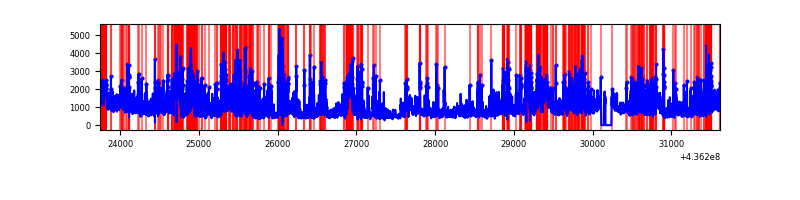 |
Top three noisy pixels from each quadrant. If the there are fewer than three noisy pixels in the level2.evt file, extra rows are filled as -1
| Pixel properties | Quadrant properties | ||||||
|---|---|---|---|---|---|---|---|
| Quadrant | DetID | PixID | Counts | Sigma | Mean | Median | Sigma |
| A | 15 | 222 | 4388921 | 24485.05 | 865 | 848 | 179.2 |
| A | 10 | 83 | 850622 | 4741.66 | 865 | 848 | 179.2 |
| A | 14 | 63 | 724716 | 4039.12 | 865 | 848 | 179.2 |
| B | 5 | 235 | 683516 | 3840.77 | 900 | 871 | 177.7 |
| B | 0 | 200 | 167310 | 936.44 | 900 | 871 | 177.7 |
| B | 0 | 199 | 52646 | 291.3 | 900 | 871 | 177.7 |
| C | 15 | 157 | 1932343 | 9620.46 | 844 | 851 | 200.8 |
| C | 15 | 174 | 427831 | 2126.72 | 844 | 851 | 200.8 |
| C | 15 | 158 | 396154 | 1968.94 | 844 | 851 | 200.8 |
| D | 12 | 33 | 817142 | 3690.14 | 857 | 827 | 221.2 |
| D | 7 | 80 | 697275 | 3148.28 | 857 | 827 | 221.2 |
| D | 8 | 48 | 685722 | 3096.06 | 857 | 827 | 221.2 |
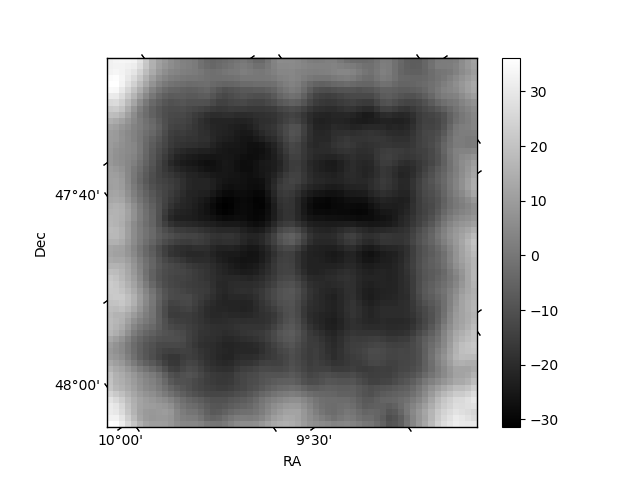
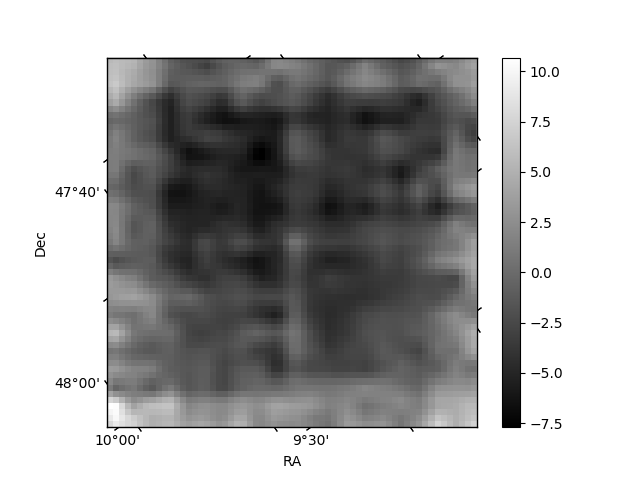
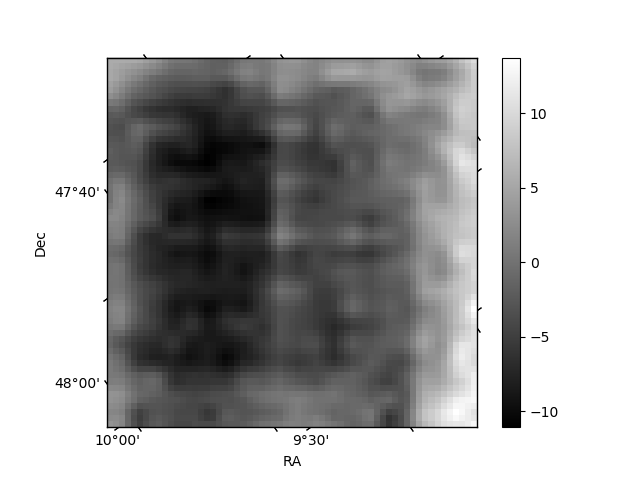
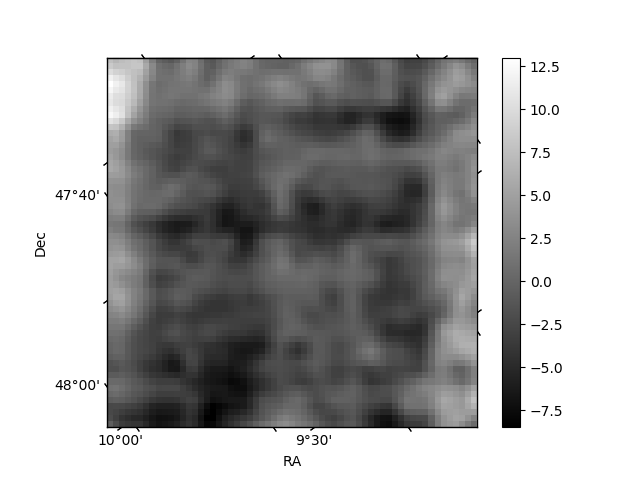
Histogram calculated using DETX and DETY for each event in the final _common_clean file
| Quadrant A | 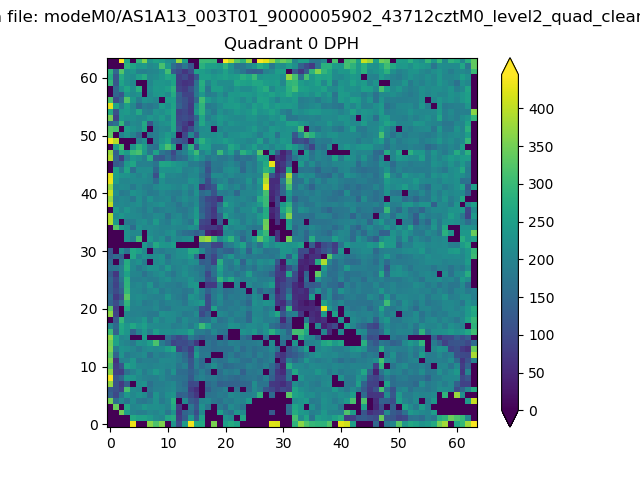 |
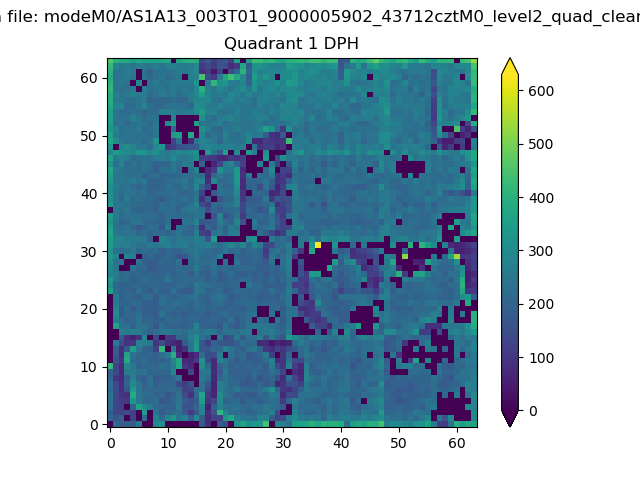 |
Quadrant B |
|---|---|---|---|
| Quadrant D | 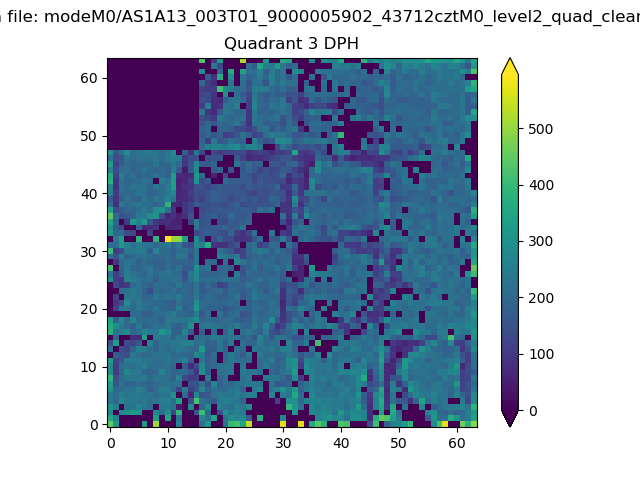 |
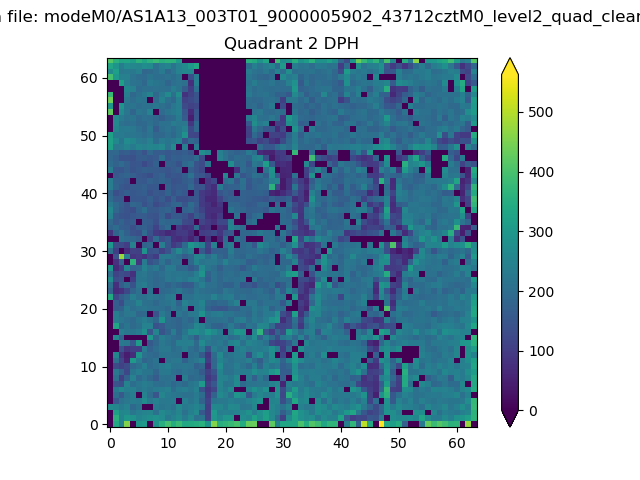 |
Quadrant C |
| Plot type | Count rate plots | Images |
|---|---|---|
| Comparison with Poisson distribution Blue bars denote a histogram of data divided into 1 sec bins. Red curve is a Poisson curve with rate = median count rate of data. |
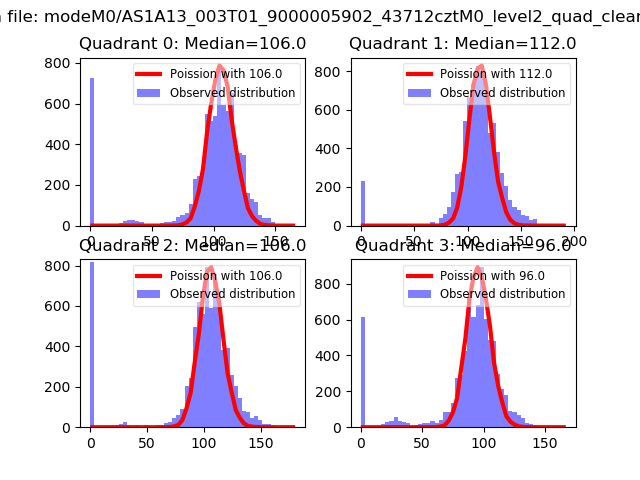 |
 |
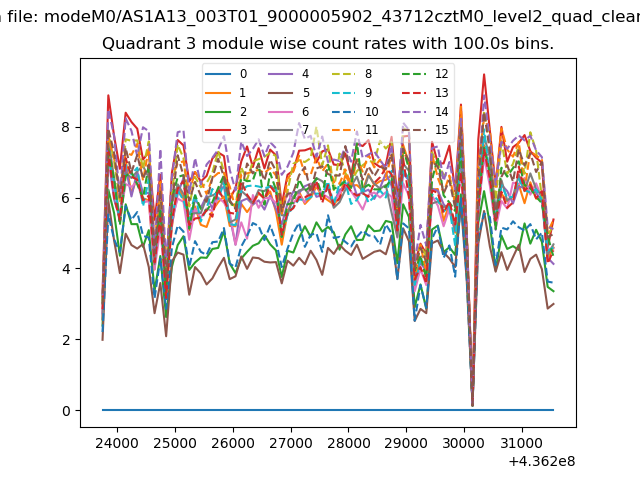
| Quadrant-wise count rates Data is divided into 100 sec bins |
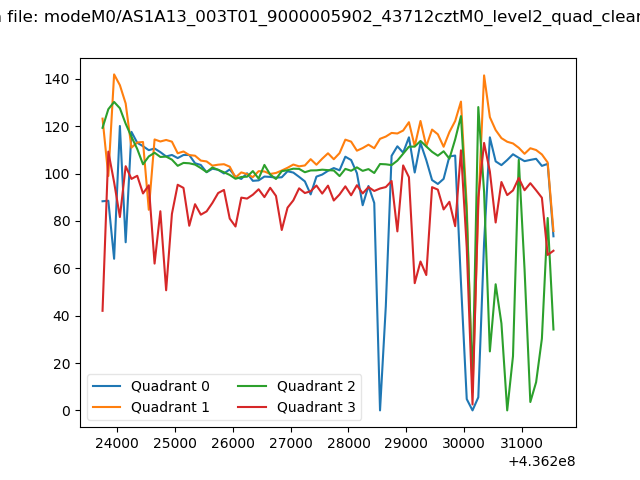 |
|
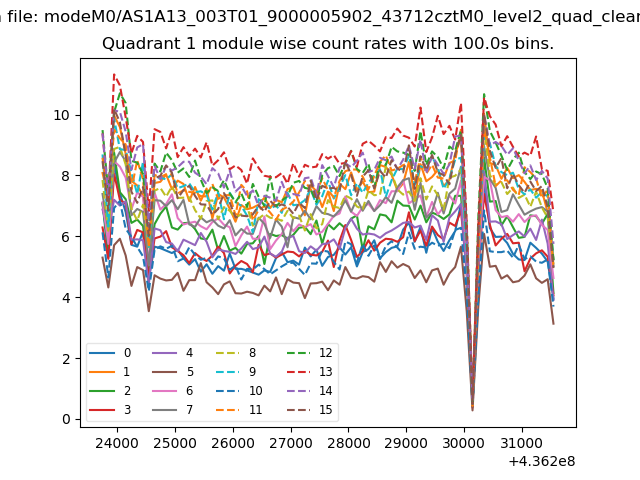
| Module-wise count rates for Quadrant A Data is divided into 100 sec bins |
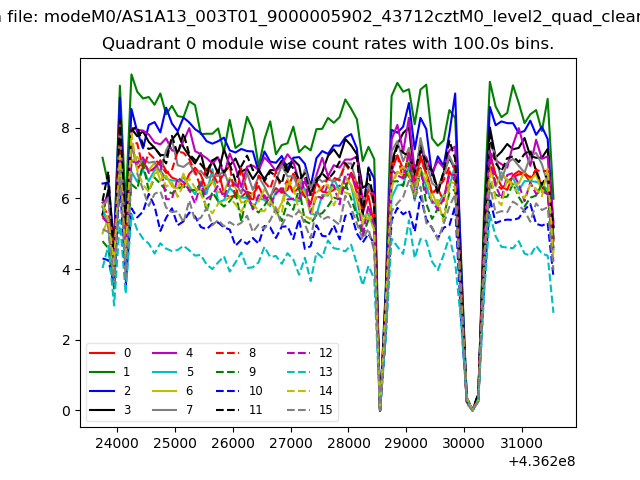 |
 |
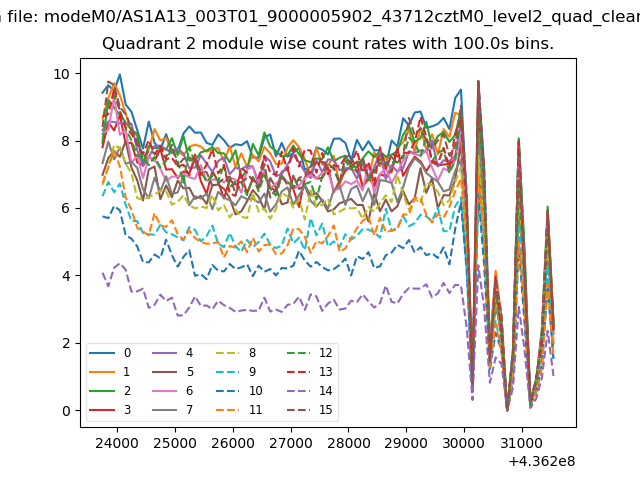
| Module-wise count rates for Quadrant B Data is divided into 100 sec bins |
 |
 |
| Module-wise count rates for Quadrant C Data is divided into 100 sec bins |
 |
 |
| Module-wise count rates for Quadrant D Data is divided into 100 sec bins |
 |
 |
| Parameter | Plot |
|---|---|
| CZT HV Monitor | 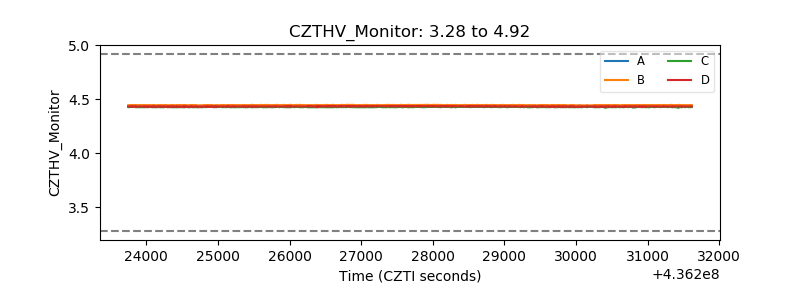 |
| D_VDD | 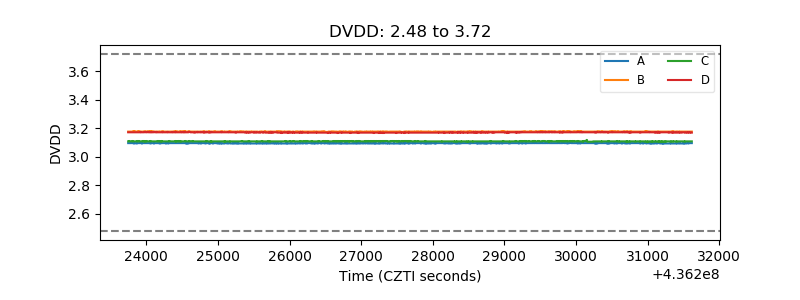 |
| Temperature 1 | 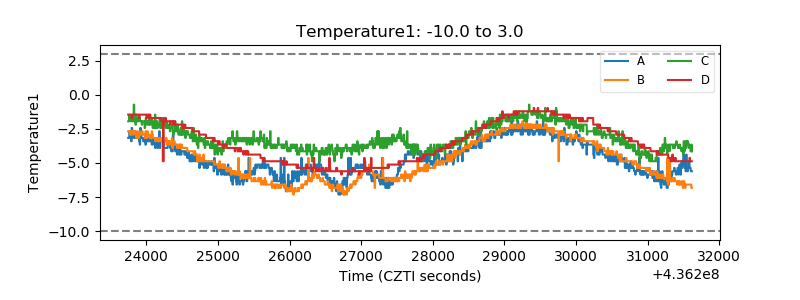 |
| Veto HV Monitor | 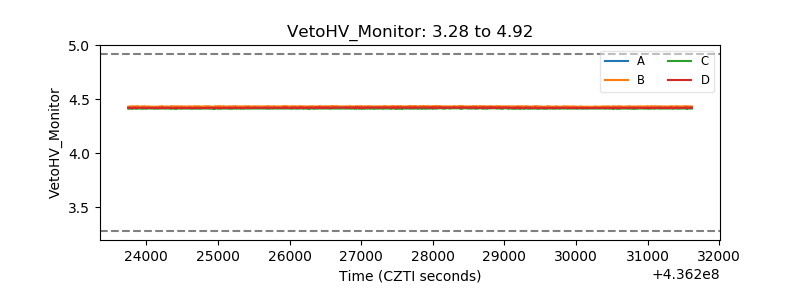 |
| Veto LLD | 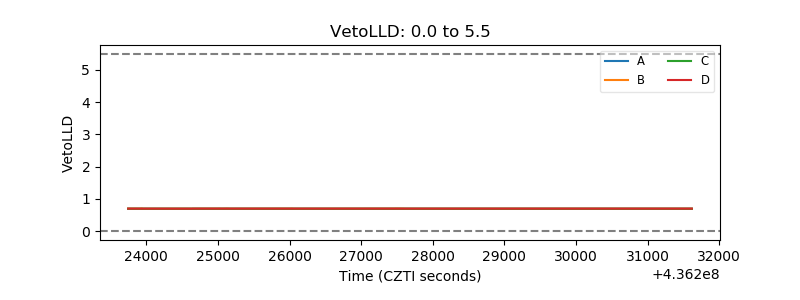 |
| Alpha Counter | 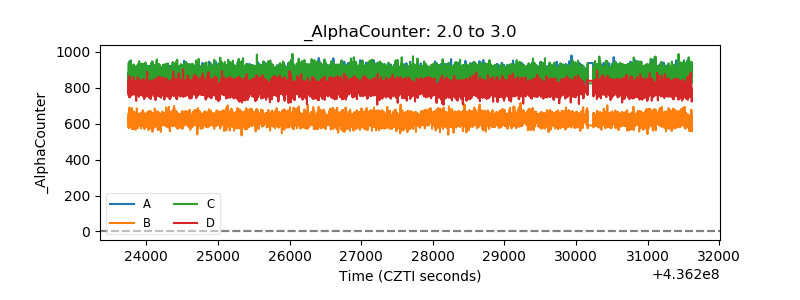 |
| _CPM_Rate | 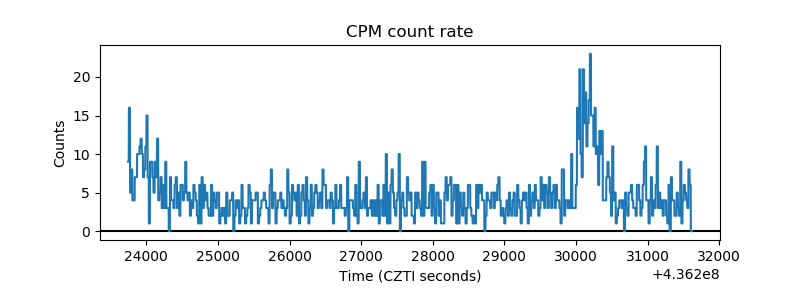 |
| CZT Counter | 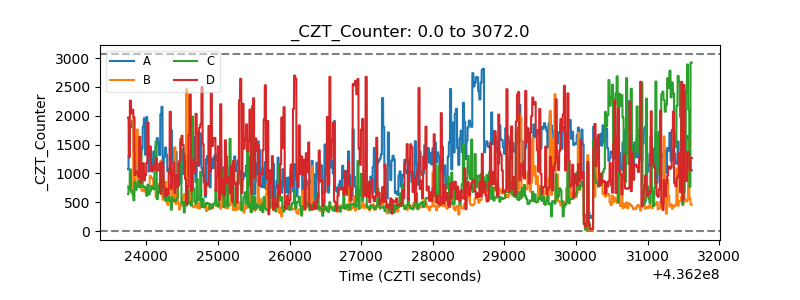 |
| +2.5 Volts monitor | 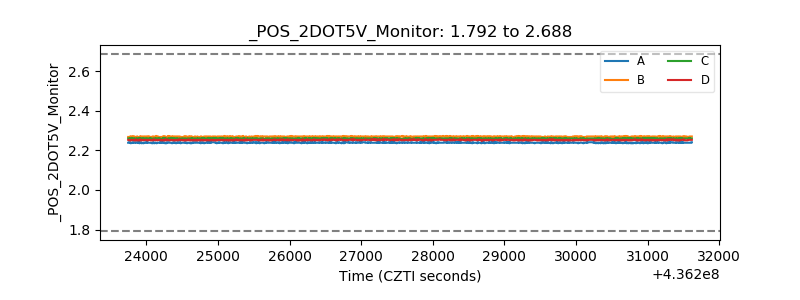 |
| +5 Volts monitor | 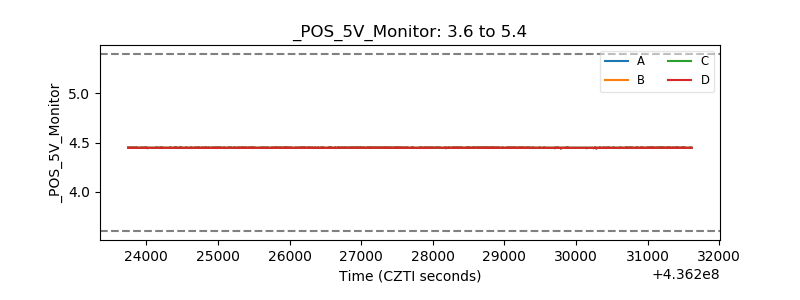 |
| _ROLL_ROT | 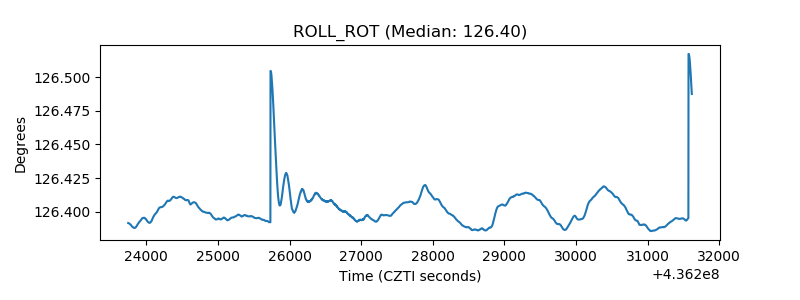 |
| _Roll_DEC | 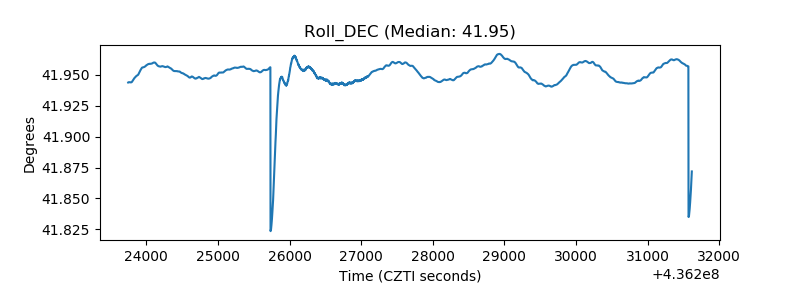 |
| _Roll_RA | 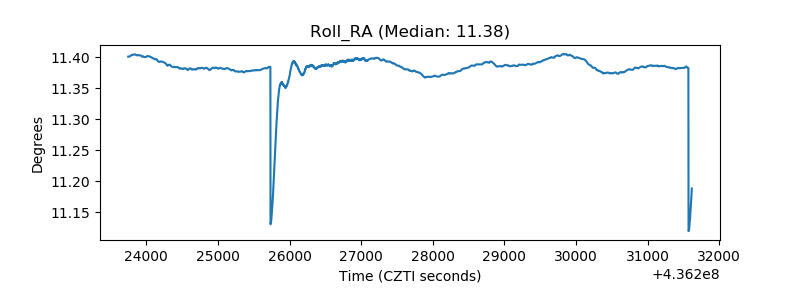 |
| Veto Counter | 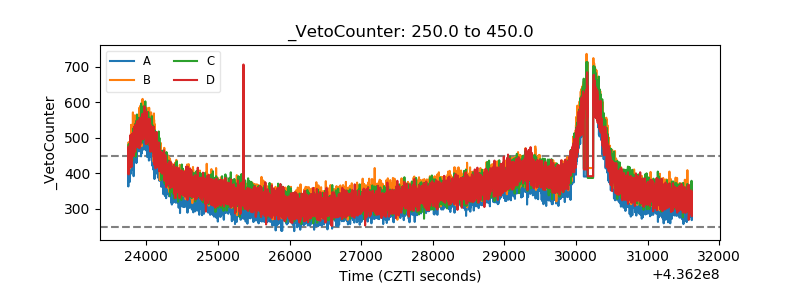 |