| Param | Original file | Final file |
|---|---|---|
| Filename | modeM0/AS1A13_003T01_9000005902_43714cztM0_level2.fits | modeM0/AS1A13_003T01_9000005902_43714cztM0_level2_quad_clean.evt |
| Size (bytes) | 1,472,641,920 | 181,523,520 |
| Size | 1.4 GB | 173.1 MB |
| Events in quadrant A | 17,938,177 | 1,269,452 |
| Events in quadrant B | 7,122,933 | 1,367,144 |
| Events in quadrant C | 13,195,196 | 1,022,250 |
| Events in quadrant D | 15,272,620 | 953,265 |
| Mode SS | |||
|---|---|---|---|
| Quadrant | BADHDUFLAG | Total packets | Discarded packets |
| A | 0 | 258 | 0 |
| B | 0 | 258 | 0 |
| C | 0 | 258 | 0 |
| D | 0 | 258 | 0 |
| Mode M0 | |||
|---|---|---|---|
| Quadrant | BADHDUFLAG | Total packets | Discarded packets |
| A | 0 | 62393 | 5 |
| B | 0 | 29963 | 2 |
| C | 0 | 48061 | 2 |
| D | 0 | 54302 | 2 |
| Mode M9 | |||
|---|---|---|---|
| Quadrant | BADHDUFLAG | Total packets | Discarded packets |
| A | 0 | 12 | 0 |
| B | 0 | 12 | 0 |
| C | 0 | 12 | 0 |
| D | 0 | 12 | 0 |
| Quadrant | Total seconds | Saturated seconds | Saturation percentage |
|---|---|---|---|
| A | 12781 | 1251 | 9.787967% |
| B | 12782 | 374 | 2.925990% |
| C | 12782 | 2942 | 23.016742% |
| D | 12782 | 2751 | 21.522453% |
Noise dominated data is calculated using 1-second bins in cleaned event files. If a bin has >2000 counts, and if more than 50% of those come from <1% of pixels, then it is considered to be noise-dominated and hence unusable.
| Quadrant | # 1 sec bins | Bins with >0 counts | Bins with >2000 counts | High rate bins dominated by noise | Noise dominated (total time) | Noise dominated (detector-on time) | Marked lightcurve |
|---|---|---|---|---|---|---|---|
| A | 13921 | 12783 | 448 | 448 | 3.22% | 3.50% | 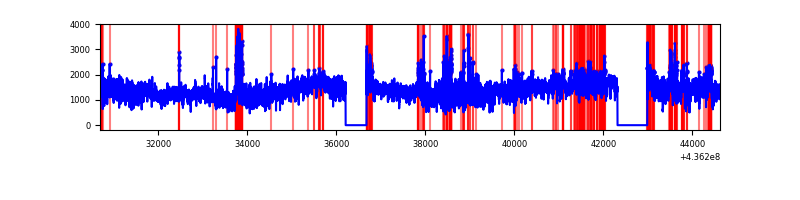 |
| B | 13922 | 12784 | 169 | 169 | 1.21% | 1.32% | 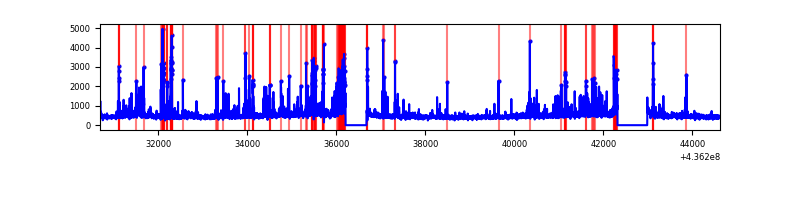 |
| C | 13922 | 12782 | 2121 | 2121 | 15.23% | 16.59% | 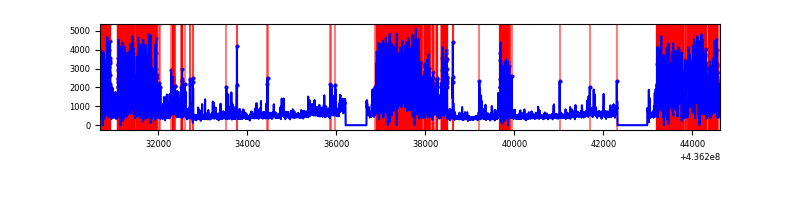 |
| D | 13922 | 12784 | 2503 | 2503 | 17.98% | 19.58% | 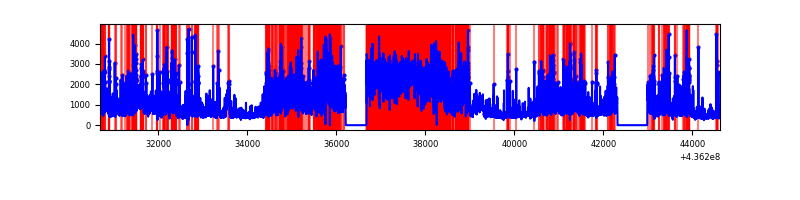 |
Top three noisy pixels from each quadrant. If the there are fewer than three noisy pixels in the level2.evt file, extra rows are filled as -1
| Pixel properties | Quadrant properties | ||||||
|---|---|---|---|---|---|---|---|
| Quadrant | DetID | PixID | Counts | Sigma | Mean | Median | Sigma |
| A | 15 | 222 | 9550520 | 33757.76 | 1377 | 1347 | 282.9 |
| A | 10 | 83 | 1496744 | 5286.45 | 1377 | 1347 | 282.9 |
| A | 15 | 223 | 846842 | 2988.95 | 1377 | 1347 | 282.9 |
| B | 5 | 235 | 1026261 | 3763.08 | 1398 | 1354 | 272.4 |
| B | 0 | 199 | 260272 | 950.65 | 1398 | 1354 | 272.4 |
| B | 5 | 255 | 107312 | 389.04 | 1398 | 1354 | 272.4 |
| C | 15 | 157 | 7399930 | 25595.54 | 1220 | 1225 | 289.1 |
| C | 3 | 233 | 698298 | 2411.5 | 1220 | 1225 | 289.1 |
| C | 15 | 158 | 134051 | 459.51 | 1220 | 1225 | 289.1 |
| D | 8 | 48 | 4082646 | 11343.49 | 1277 | 1251 | 359.8 |
| D | 7 | 80 | 2203739 | 6121.41 | 1277 | 1251 | 359.8 |
| D | 5 | 235 | 585260 | 1623.15 | 1277 | 1251 | 359.8 |
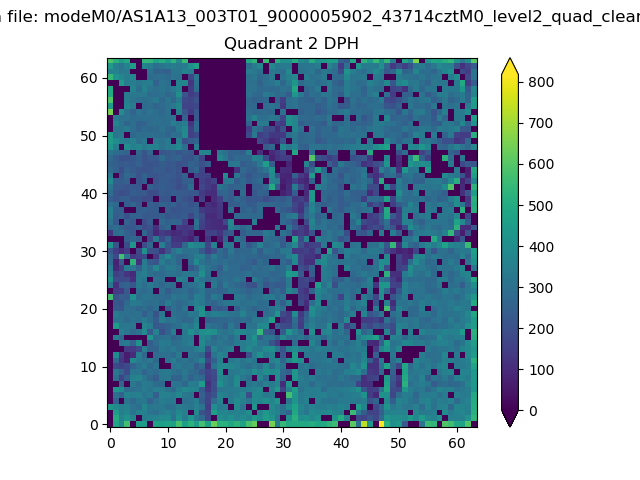
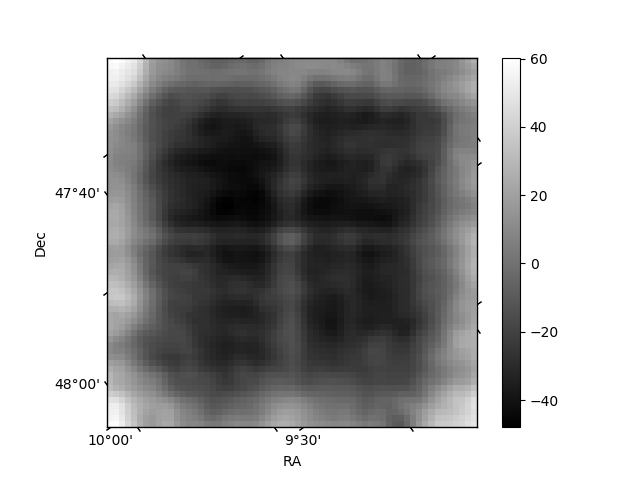
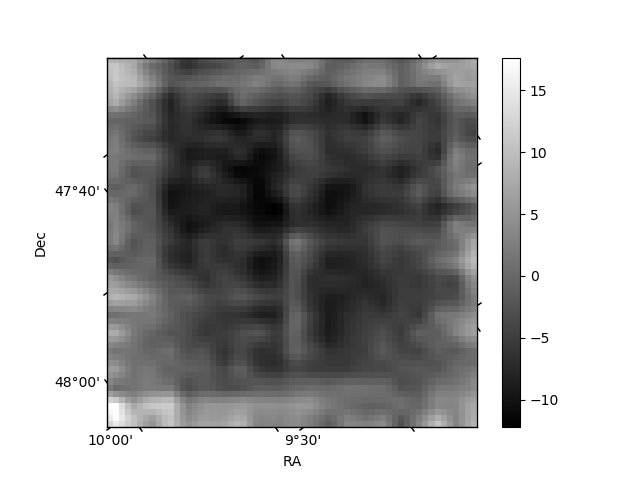
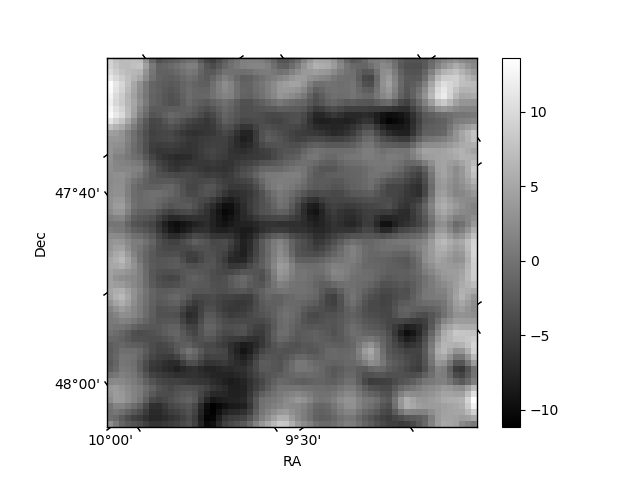
Histogram calculated using DETX and DETY for each event in the final _common_clean file
| Quadrant A | 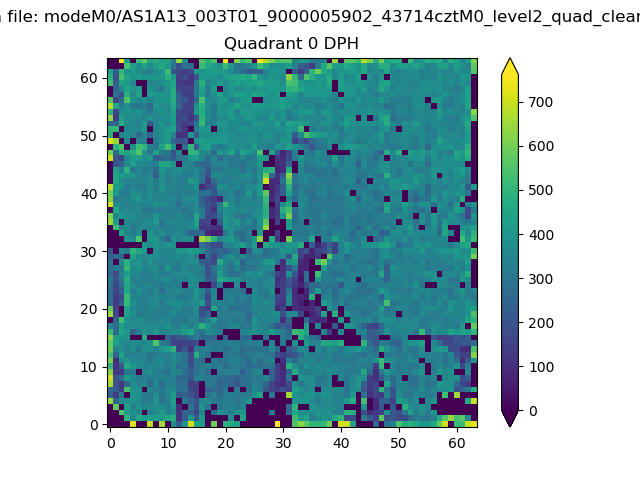 |
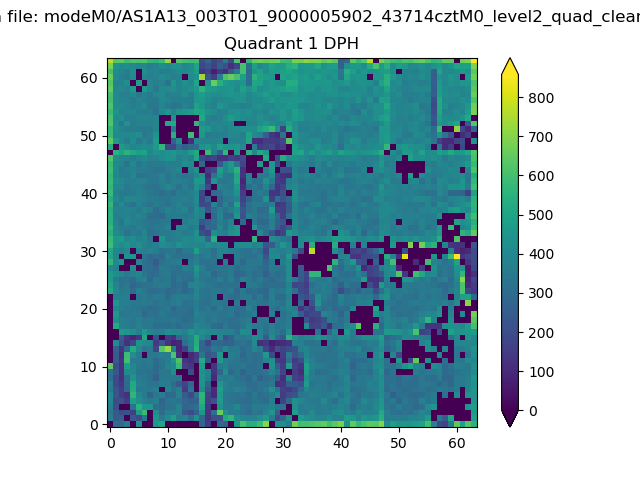 |
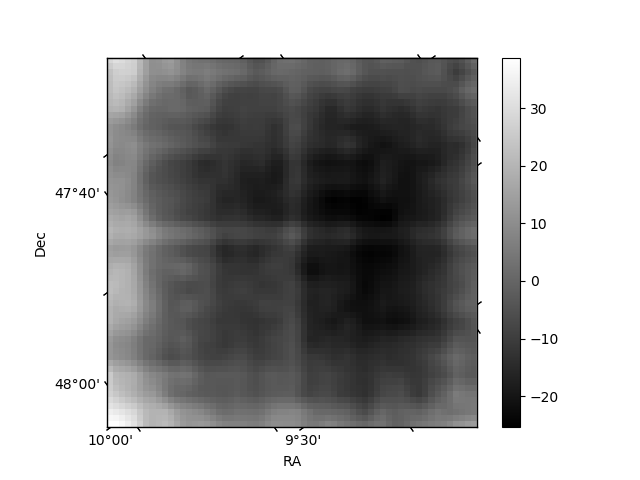
Quadrant B |
|---|---|---|---|
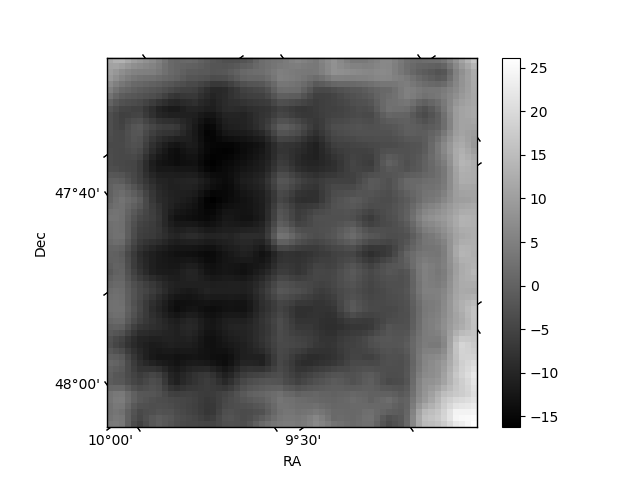
| Quadrant D | 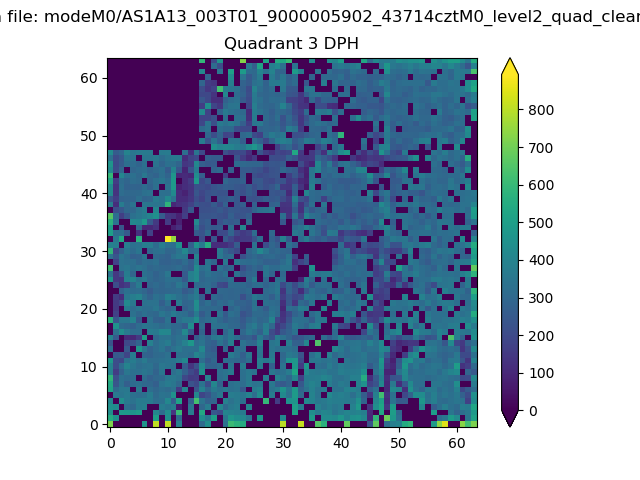 |
 |
Quadrant C |
| Plot type | Count rate plots | Images |
|---|---|---|
| Comparison with Poisson distribution Blue bars denote a histogram of data divided into 1 sec bins. Red curve is a Poisson curve with rate = median count rate of data. |
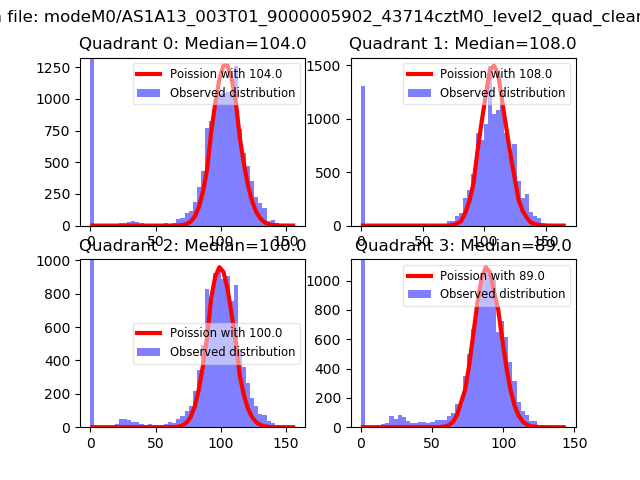 |
 |
| Quadrant-wise count rates Data is divided into 100 sec bins |
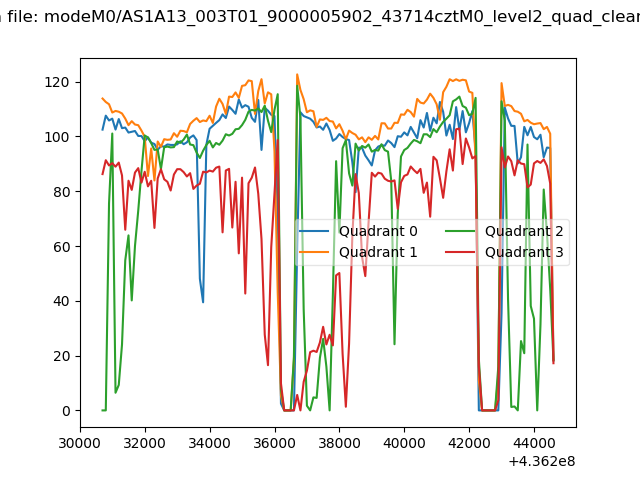 |
|
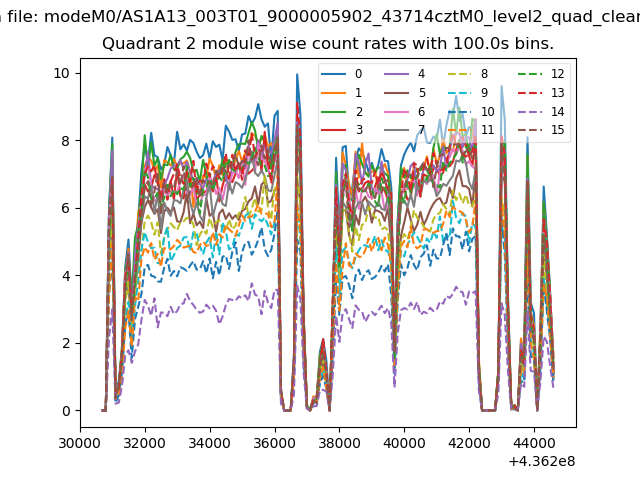
| Module-wise count rates for Quadrant A Data is divided into 100 sec bins |
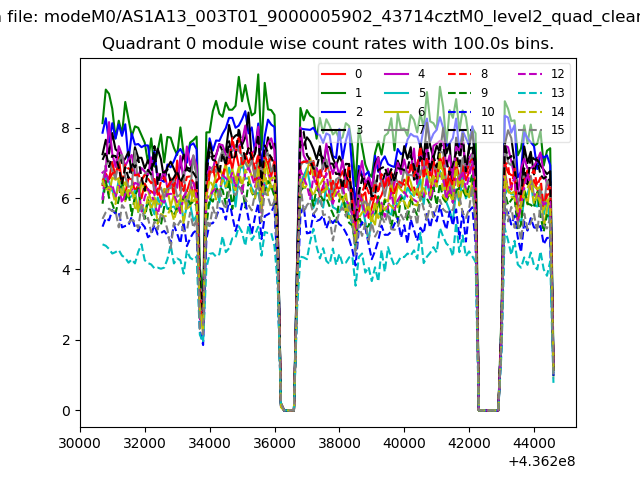 |
 |
| Module-wise count rates for Quadrant B Data is divided into 100 sec bins |
 |
 |
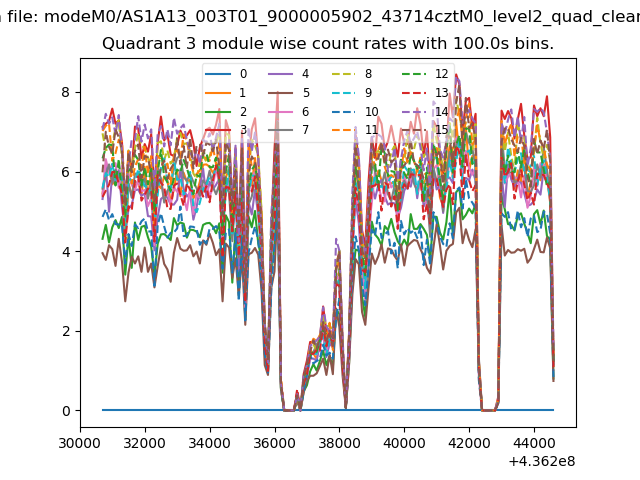
| Module-wise count rates for Quadrant C Data is divided into 100 sec bins |
 |
 |
| Module-wise count rates for Quadrant D Data is divided into 100 sec bins |
 |
 |
| Parameter | Plot |
|---|---|
| CZT HV Monitor | 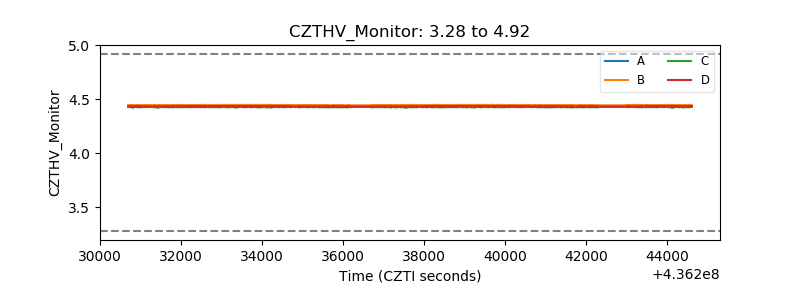 |
| D_VDD | 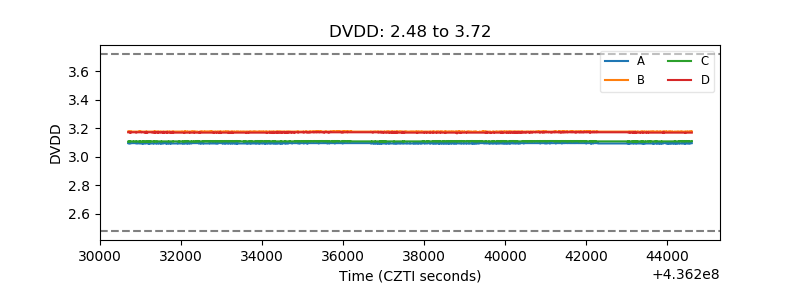 |
| Temperature 1 | 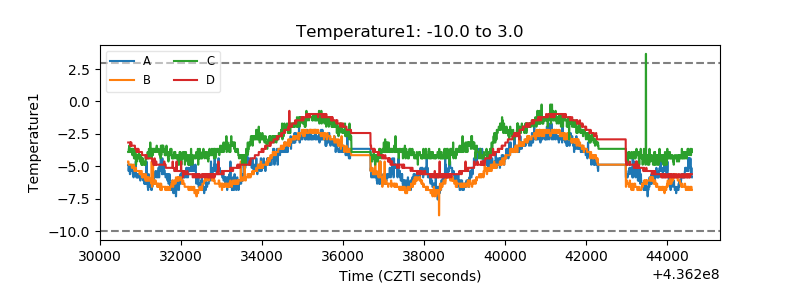 |
| Veto HV Monitor | 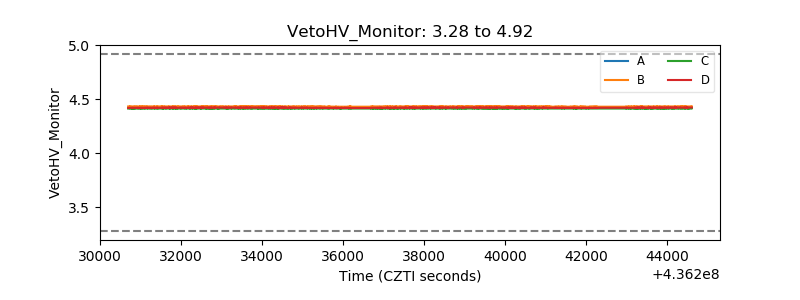 |
| Veto LLD | 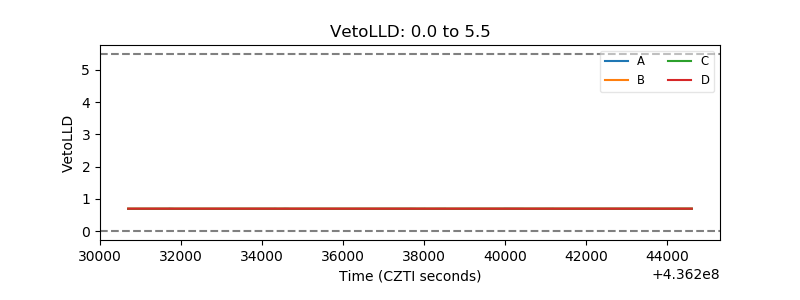 |
| Alpha Counter | 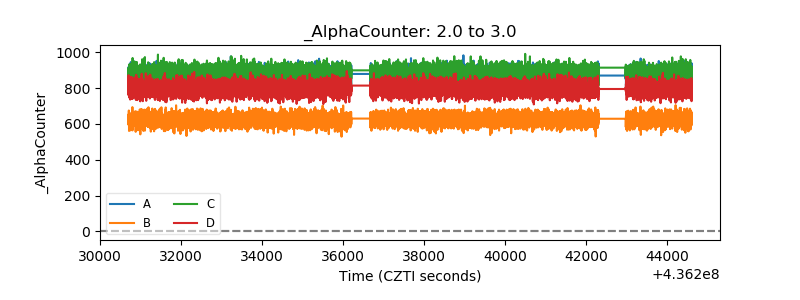 |
| _CPM_Rate | 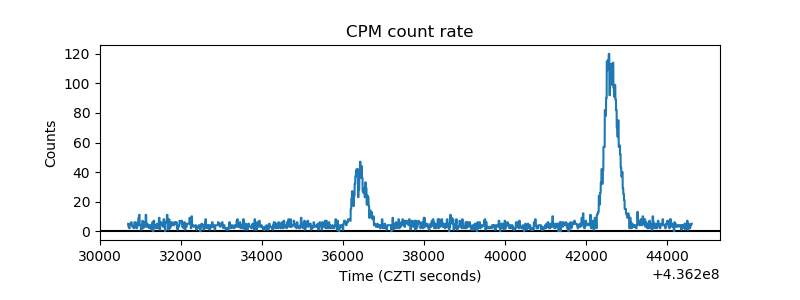 |
| CZT Counter | 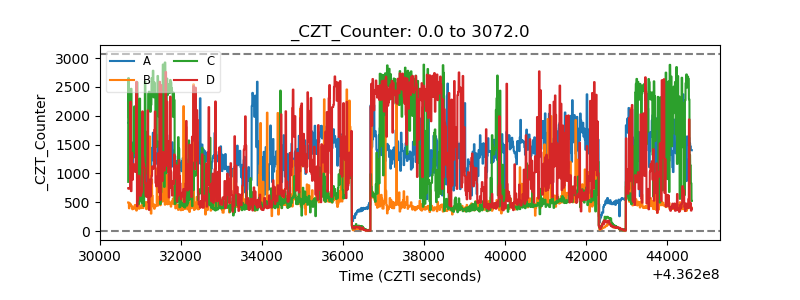 |
| +2.5 Volts monitor | 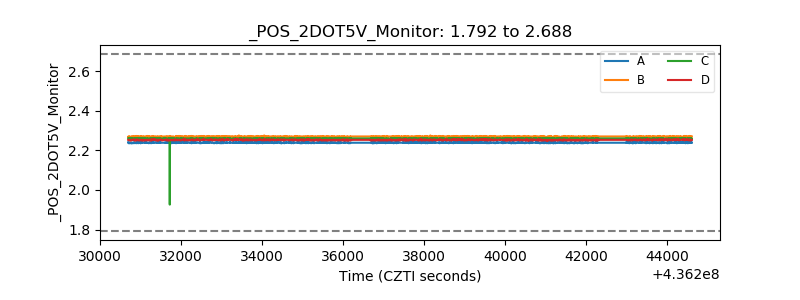 |
| +5 Volts monitor | 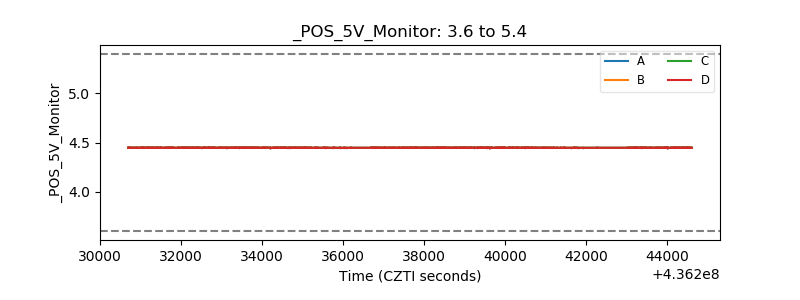 |
| _ROLL_ROT | 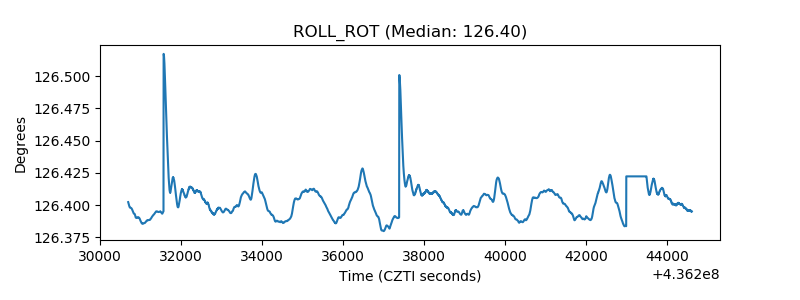 |
| _Roll_DEC | 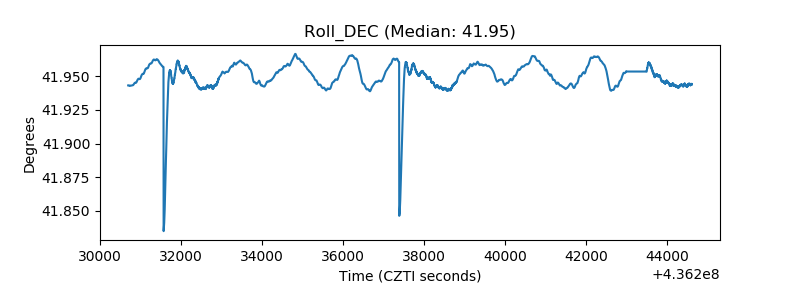 |
| _Roll_RA | 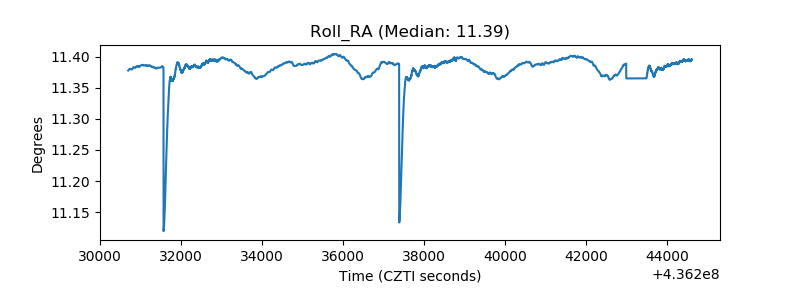 |
| Veto Counter | 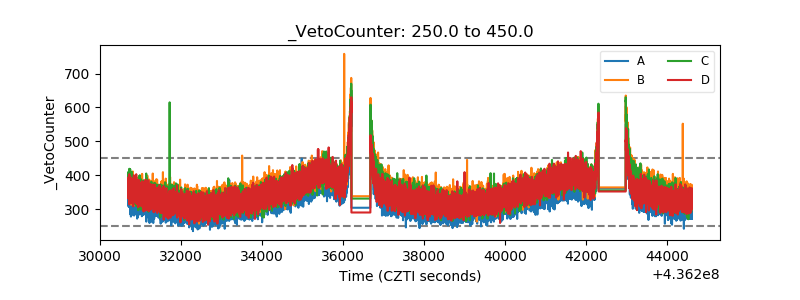 |