| Param | Original file | Final file |
|---|---|---|
| Filename | modeM0/AS1A13_003T01_9000005902_43715cztM0_level2.fits | modeM0/AS1A13_003T01_9000005902_43715cztM0_level2_quad_clean.evt |
| Size (bytes) | 793,036,800 | 99,434,880 |
| Size | 756.3 MB | 94.8 MB |
| Events in quadrant A | 9,647,366 | 704,739 |
| Events in quadrant B | 3,425,182 | 753,908 |
| Events in quadrant C | 9,474,757 | 472,430 |
| Events in quadrant D | 6,275,857 | 599,398 |
| Mode SS | |||
|---|---|---|---|
| Quadrant | BADHDUFLAG | Total packets | Discarded packets |
| A | 0 | 138 | 0 |
| B | 0 | 138 | 0 |
| C | 0 | 138 | 0 |
| D | 0 | 138 | 0 |
| Mode M0 | |||
|---|---|---|---|
| Quadrant | BADHDUFLAG | Total packets | Discarded packets |
| A | 0 | 33515 | 1 |
| B | 0 | 14899 | 1 |
| C | 0 | 32752 | 1 |
| D | 0 | 23624 | 1 |
| Mode M9 | |||
|---|---|---|---|
| Quadrant | BADHDUFLAG | Total packets | Discarded packets |
| A | 0 | 9 | 0 |
| B | 0 | 9 | 0 |
| C | 0 | 9 | 0 |
| D | 0 | 9 | 0 |
| Quadrant | Total seconds | Saturated seconds | Saturation percentage |
|---|---|---|---|
| A | 6890 | 566 | 8.214804% |
| B | 6890 | 118 | 1.712627% |
| C | 6891 | 2686 | 38.978378% |
| D | 6891 | 836 | 12.131766% |
Noise dominated data is calculated using 1-second bins in cleaned event files. If a bin has >2000 counts, and if more than 50% of those come from <1% of pixels, then it is considered to be noise-dominated and hence unusable.
| Quadrant | # 1 sec bins | Bins with >0 counts | Bins with >2000 counts | High rate bins dominated by noise | Noise dominated (total time) | Noise dominated (detector-on time) | Marked lightcurve |
|---|---|---|---|---|---|---|---|
| A | 7720 | 6891 | 299 | 299 | 3.87% | 4.34% | 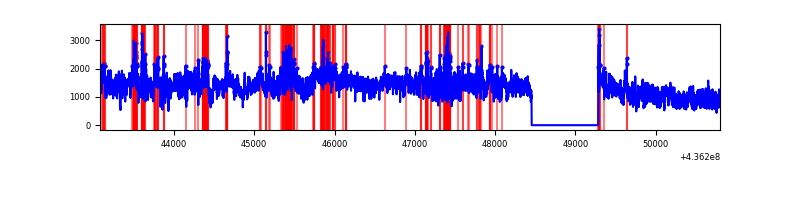 |
| B | 7720 | 6891 | 38 | 38 | 0.49% | 0.55% | 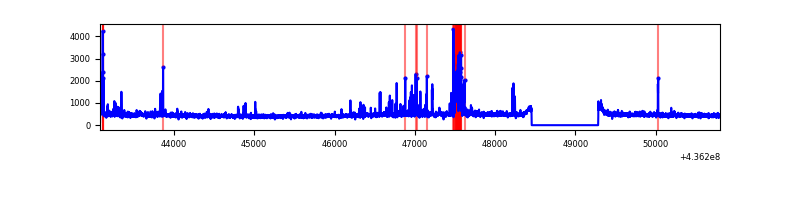 |
| C | 7721 | 6887 | 1894 | 1894 | 24.53% | 27.50% | 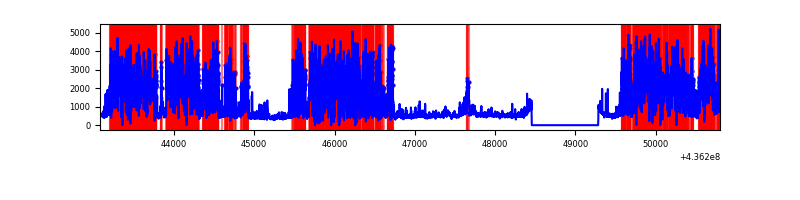 |
| D | 7721 | 6892 | 664 | 664 | 8.60% | 9.63% | 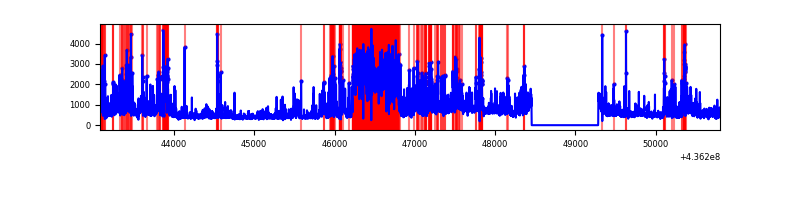 |
Top three noisy pixels from each quadrant. If the there are fewer than three noisy pixels in the level2.evt file, extra rows are filled as -1
| Pixel properties | Quadrant properties | ||||||
|---|---|---|---|---|---|---|---|
| Quadrant | DetID | PixID | Counts | Sigma | Mean | Median | Sigma |
| A | 15 | 222 | 4632092 | 29654.51 | 752 | 736 | 156.2 |
| A | 10 | 83 | 879072 | 5623.97 | 752 | 736 | 156.2 |
| A | 15 | 223 | 706112 | 4516.51 | 752 | 736 | 156.2 |
| B | 5 | 235 | 245146 | 1597.85 | 770 | 745 | 153.0 |
| B | 0 | 199 | 83272 | 539.55 | 770 | 745 | 153.0 |
| B | 12 | 111 | 19356 | 121.68 | 770 | 745 | 153.0 |
| C | 15 | 157 | 6656849 | 47248.93 | 596 | 599 | 140.9 |
| C | 3 | 233 | 192826 | 1364.51 | 596 | 599 | 140.9 |
| C | 15 | 158 | 134795 | 952.58 | 596 | 599 | 140.9 |
| D | 12 | 233 | 1082598 | 5890.21 | 714 | 691 | 183.7 |
| D | 7 | 80 | 452773 | 2461.26 | 714 | 691 | 183.7 |
| D | 13 | 171 | 262537 | 1425.56 | 714 | 691 | 183.7 |
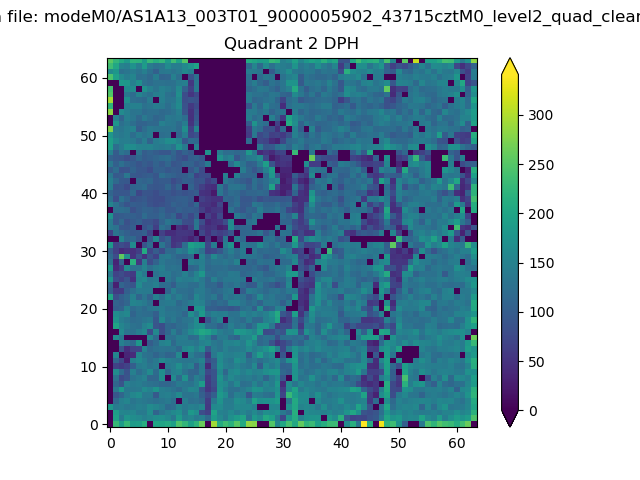
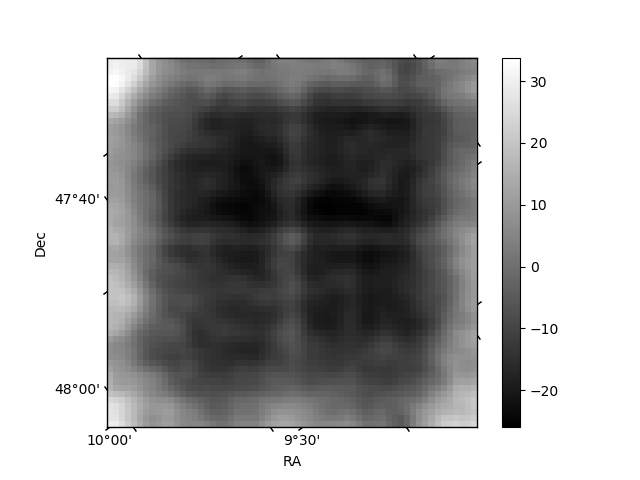
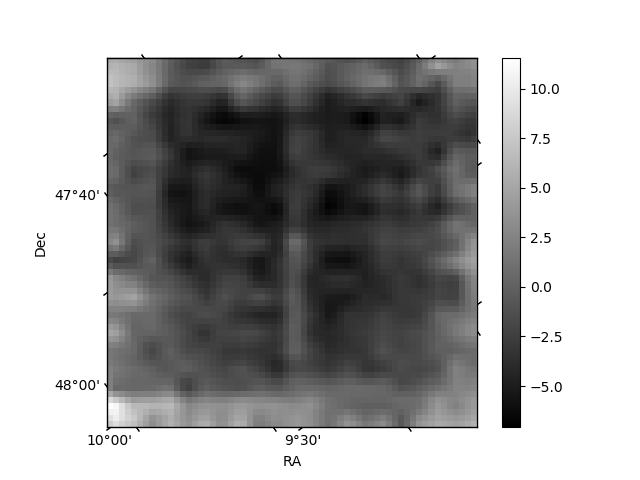
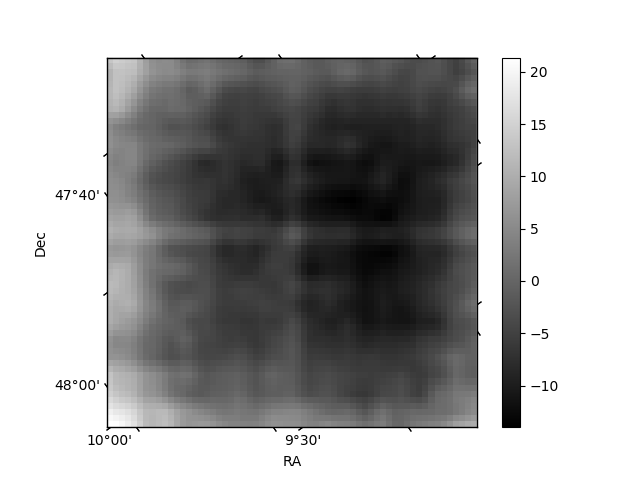
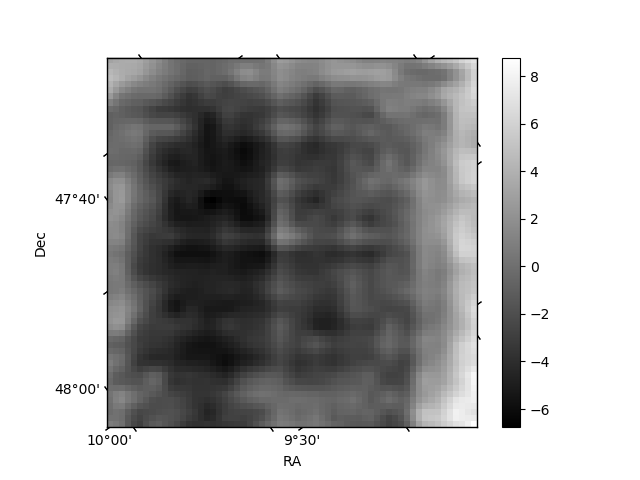
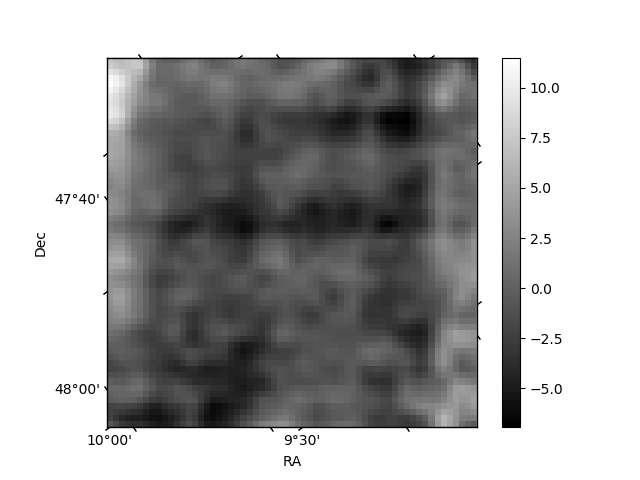
Histogram calculated using DETX and DETY for each event in the final _common_clean file
| Quadrant A | 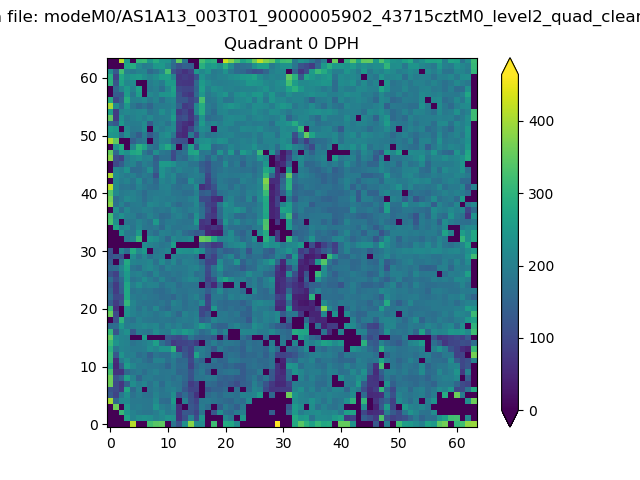 |
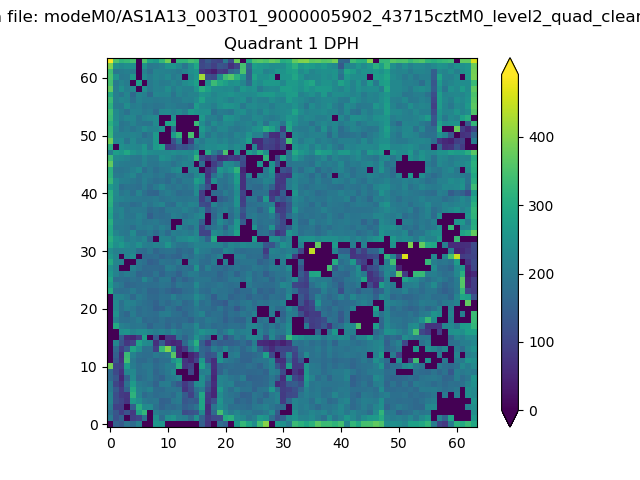 |
Quadrant B |
|---|---|---|---|
| Quadrant D | 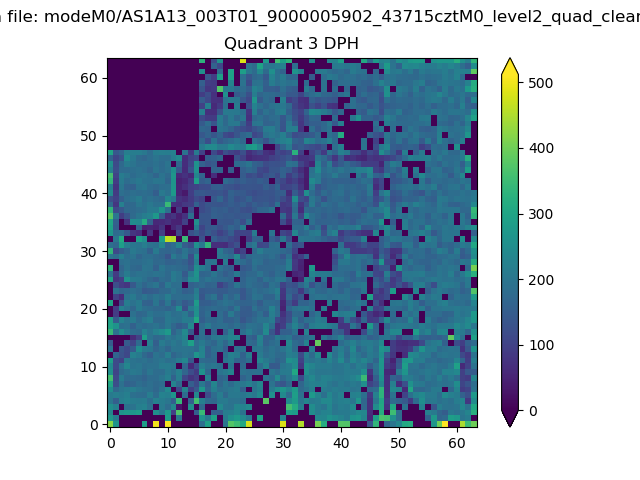 |
 |
Quadrant C |
| Plot type | Count rate plots | Images |
|---|---|---|
| Comparison with Poisson distribution Blue bars denote a histogram of data divided into 1 sec bins. Red curve is a Poisson curve with rate = median count rate of data. |
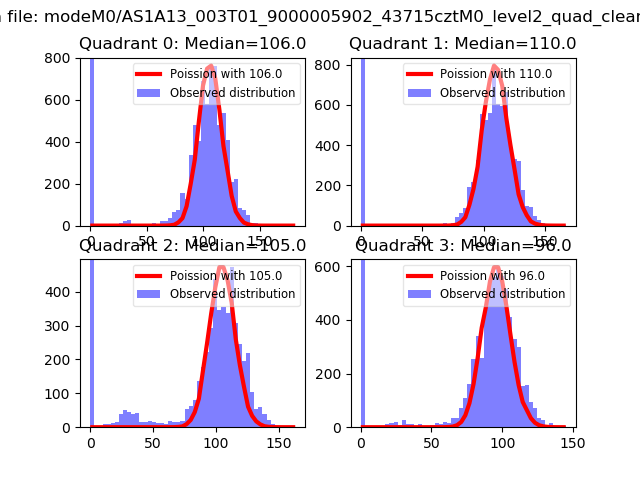 |
 |
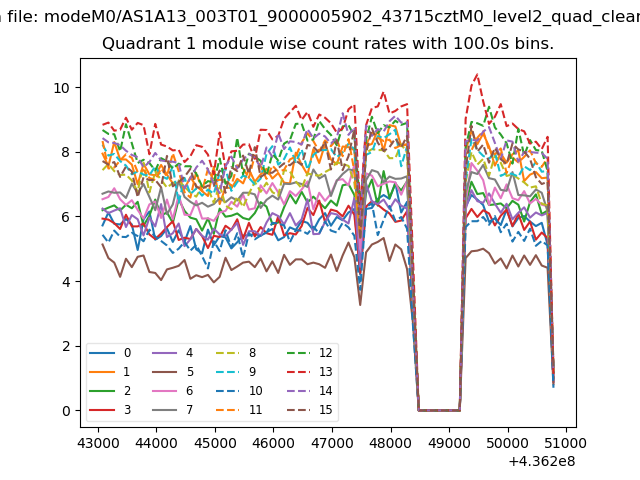
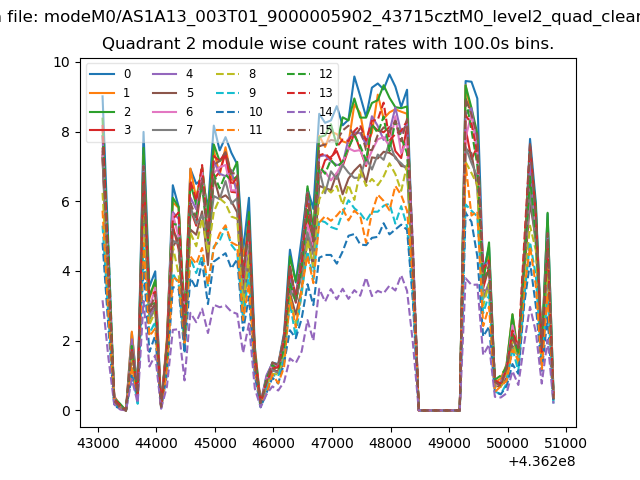
| Quadrant-wise count rates Data is divided into 100 sec bins |
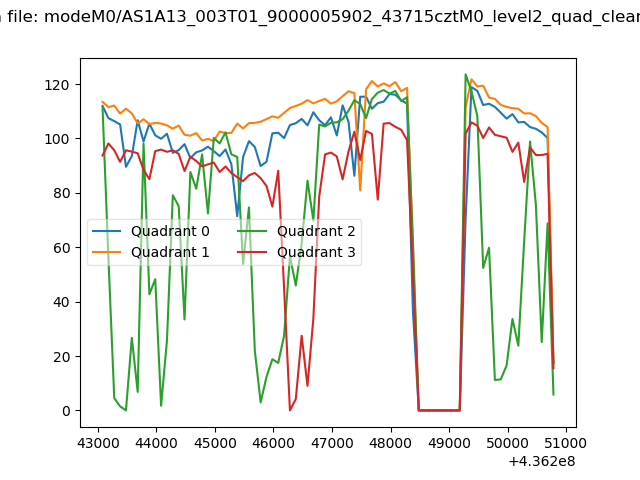 |
|
| Module-wise count rates for Quadrant A Data is divided into 100 sec bins |
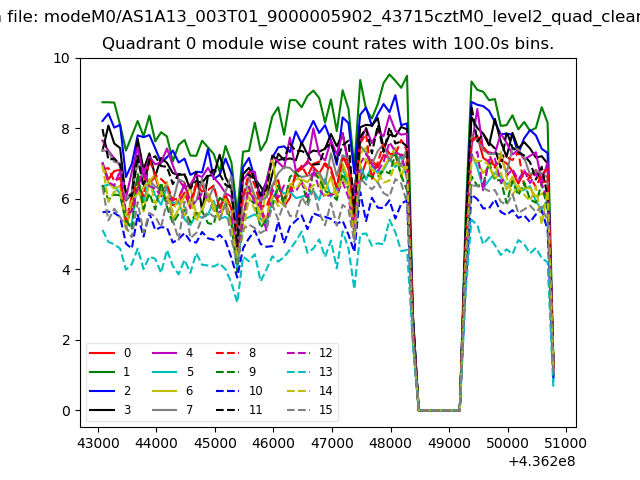 |
 |
| Module-wise count rates for Quadrant B Data is divided into 100 sec bins |
 |
 |
| Module-wise count rates for Quadrant C Data is divided into 100 sec bins |
 |
 |
| Module-wise count rates for Quadrant D Data is divided into 100 sec bins |
 |
 |
| Parameter | Plot |
|---|---|
| CZT HV Monitor | 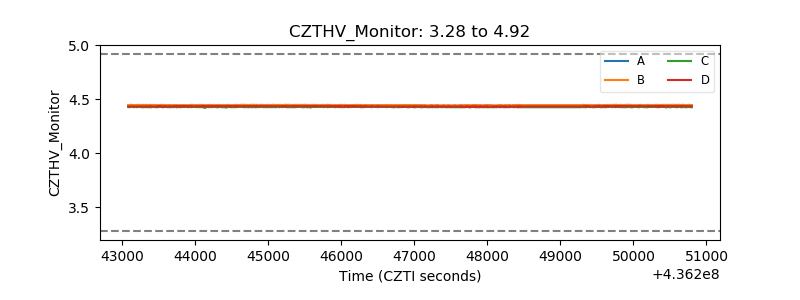 |
| D_VDD | 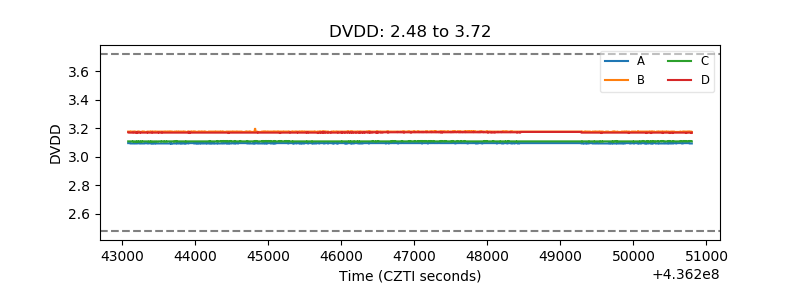 |
| Temperature 1 | 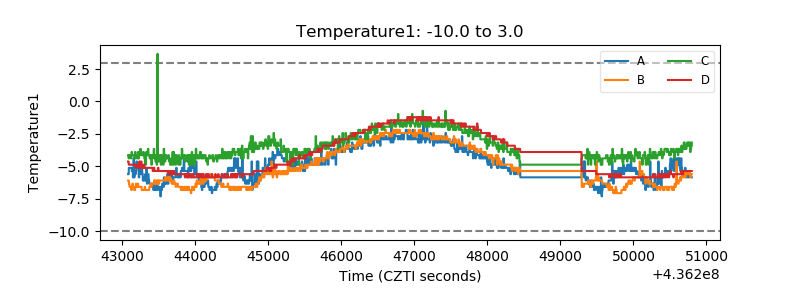 |
| Veto HV Monitor | 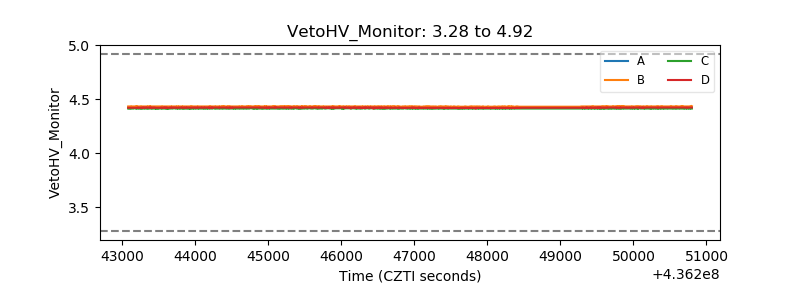 |
| Veto LLD | 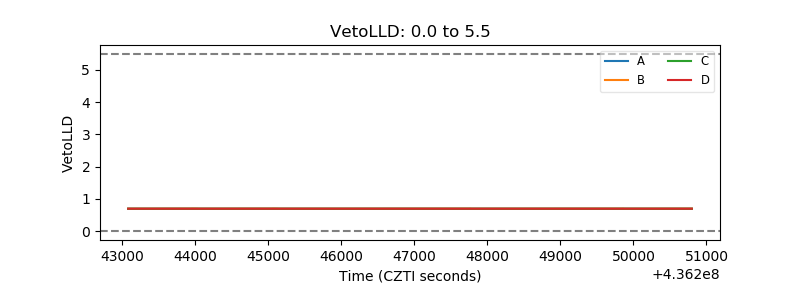 |
| Alpha Counter | 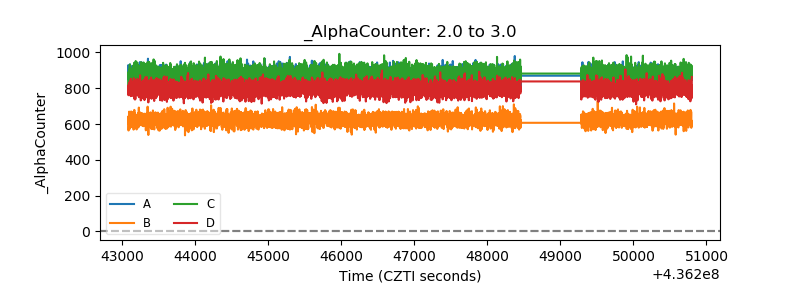 |
| _CPM_Rate | 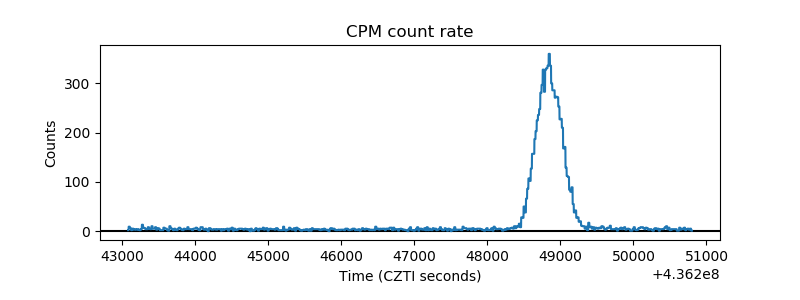 |
| CZT Counter | 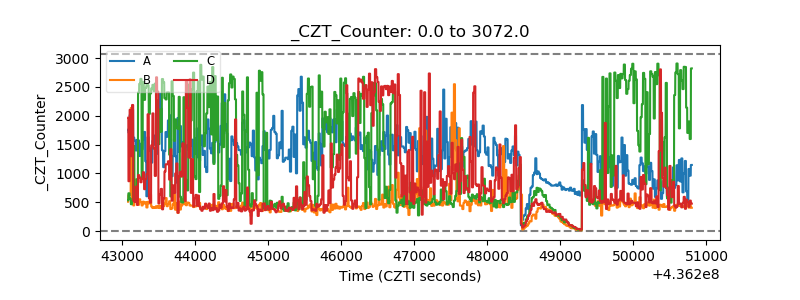 |
| +2.5 Volts monitor | 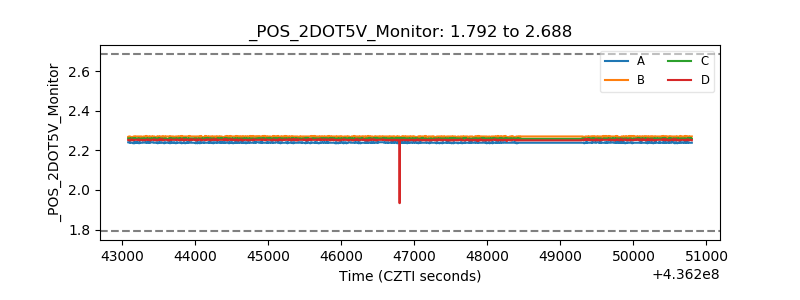 |
| +5 Volts monitor | 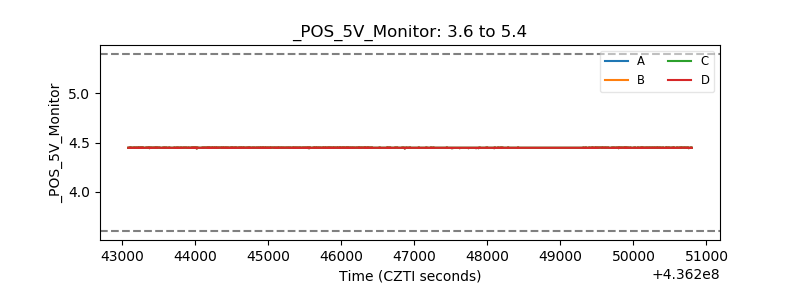 |
| _ROLL_ROT | 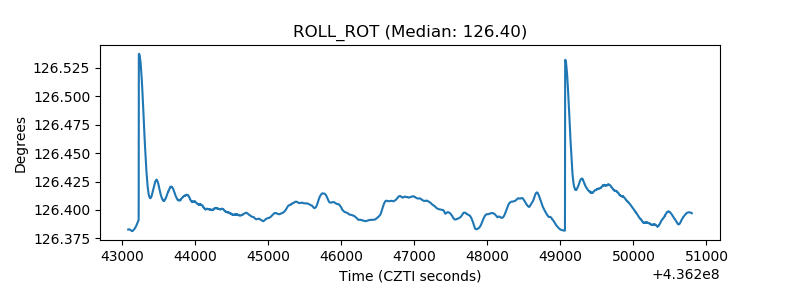 |
| _Roll_DEC | 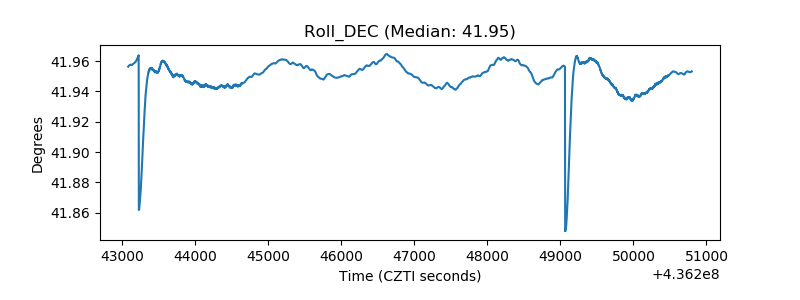 |
| _Roll_RA | 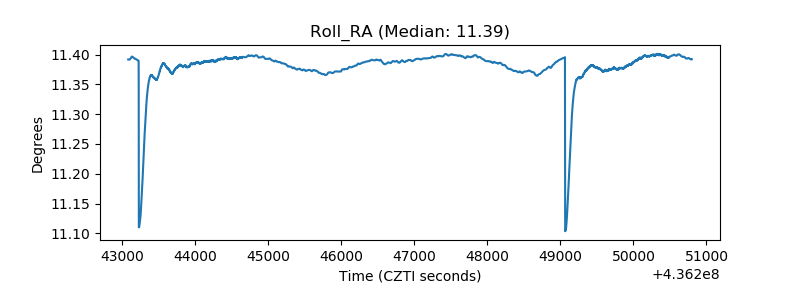 |
| Veto Counter |  |