| Param | Original file | Final file |
|---|---|---|
| Filename | modeM0/AS1A13_003T01_9000005902_43716cztM0_level2.fits | modeM0/AS1A13_003T01_9000005902_43716cztM0_level2_quad_clean.evt |
| Size (bytes) | 142,957,440 | 21,165,120 |
| Size | 136.3 MB | 20.2 MB |
| Events in quadrant A | 1,369,789 | 146,971 |
| Events in quadrant B | 685,816 | 162,750 |
| Events in quadrant C | 2,196,522 | 89,868 |
| Events in quadrant D | 934,549 | 142,534 |
| Mode SS | |||
|---|---|---|---|
| Quadrant | BADHDUFLAG | Total packets | Discarded packets |
| A | 0 | 30 | 0 |
| B | 0 | 30 | 0 |
| C | 0 | 30 | 0 |
| D | 0 | 30 | 2 |
| Mode M0 | |||
|---|---|---|---|
| Quadrant | BADHDUFLAG | Total packets | Discarded packets |
| A | 0 | 5228 | 220 |
| B | 0 | 2948 | 111 |
| C | 0 | 7847 | 430 |
| D | 0 | 3822 | 149 |
| Mode M9 | |||
|---|---|---|---|
| Quadrant | BADHDUFLAG | Total packets | Discarded packets |
| A | 0 | 10 | 0 |
| B | 0 | 10 | 0 |
| C | 0 | 11 | 1 |
| D | 0 | 11 | 1 |
| Quadrant | Total seconds | Saturated seconds | Saturation percentage |
|---|---|---|---|
| A | 1316 | 97 | 7.370821% |
| B | 1325 | 34 | 2.566038% |
| C | 1304 | 630 | 48.312883% |
| D | 1326 | 61 | 4.600302% |
Noise dominated data is calculated using 1-second bins in cleaned event files. If a bin has >2000 counts, and if more than 50% of those come from <1% of pixels, then it is considered to be noise-dominated and hence unusable.
| Quadrant | # 1 sec bins | Bins with >0 counts | Bins with >2000 counts | High rate bins dominated by noise | Noise dominated (total time) | Noise dominated (detector-on time) | Marked lightcurve |
|---|---|---|---|---|---|---|---|
| A | 2382 | 1336 | 34 | 34 | 1.43% | 2.54% |  |
| B | 2382 | 1340 | 0 | 0 | 0.00% | 0.00% |  |
| C | 2381 | 1328 | 457 | 457 | 19.19% | 34.41% | 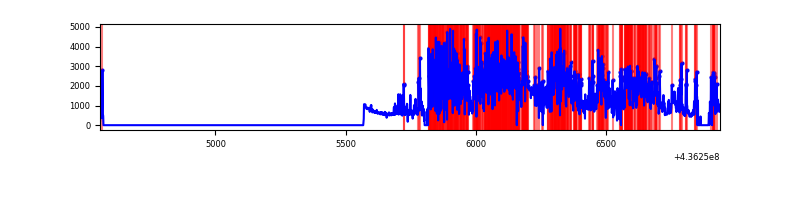 |
| D | 2381 | 1344 | 32 | 32 | 1.34% | 2.38% | 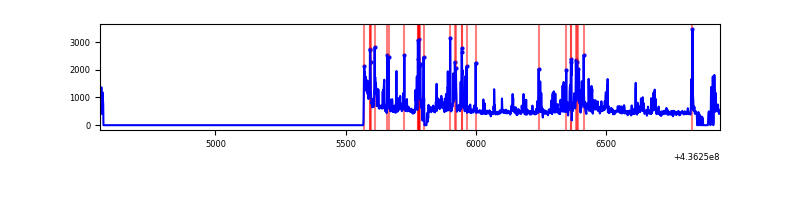 |
Top three noisy pixels from each quadrant. If the there are fewer than three noisy pixels in the level2.evt file, extra rows are filled as -1
| Pixel properties | Quadrant properties | ||||||
|---|---|---|---|---|---|---|---|
| Quadrant | DetID | PixID | Counts | Sigma | Mean | Median | Sigma |
| A | 15 | 222 | 408922 | 11848.69 | 158 | 155 | 34.5 |
| A | 10 | 83 | 229499 | 6647.86 | 158 | 155 | 34.5 |
| A | 15 | 223 | 87636 | 2535.76 | 158 | 155 | 34.5 |
| B | 0 | 199 | 23141 | 662.19 | 166 | 161 | 34.7 |
| B | 5 | 235 | 5417 | 151.46 | 166 | 161 | 34.7 |
| B | 12 | 111 | 4166 | 115.41 | 166 | 161 | 34.7 |
| C | 15 | 157 | 1687245 | 56465.69 | 118 | 118 | 29.9 |
| C | 15 | 173 | 18527 | 616.12 | 118 | 118 | 29.9 |
| C | 15 | 158 | 9831 | 325.08 | 118 | 118 | 29.9 |
| D | 1 | 47 | 98163 | 2371.79 | 156 | 151 | 41.3 |
| D | 13 | 249 | 72920 | 1760.93 | 156 | 151 | 41.3 |
| D | 7 | 80 | 35421 | 853.5 | 156 | 151 | 41.3 |
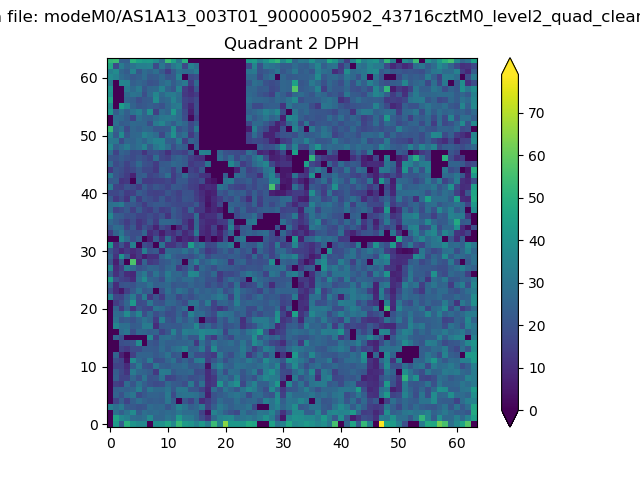
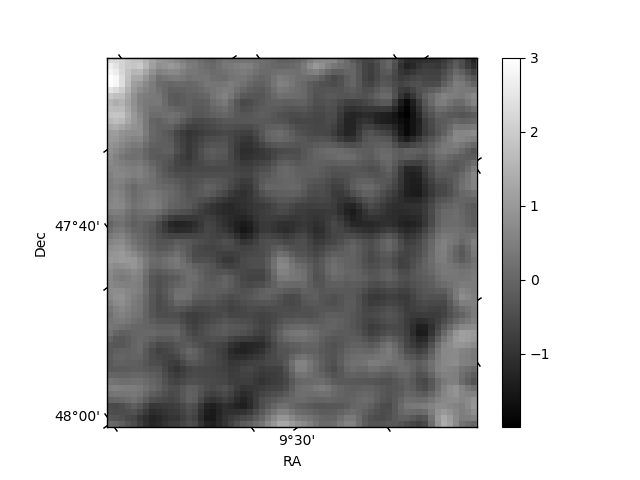
Histogram calculated using DETX and DETY for each event in the final _common_clean file
| Quadrant A | 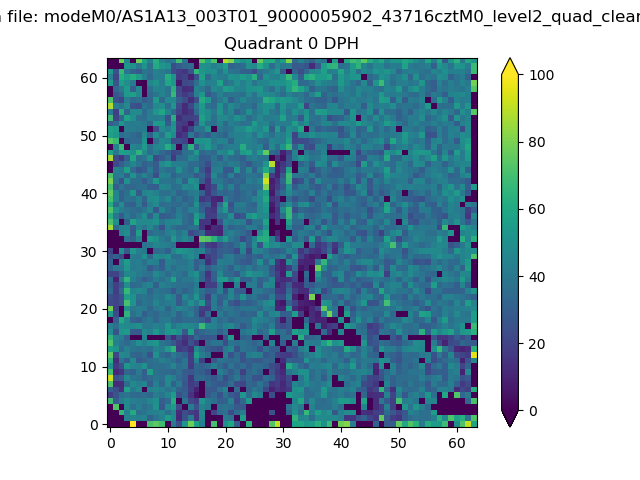 |
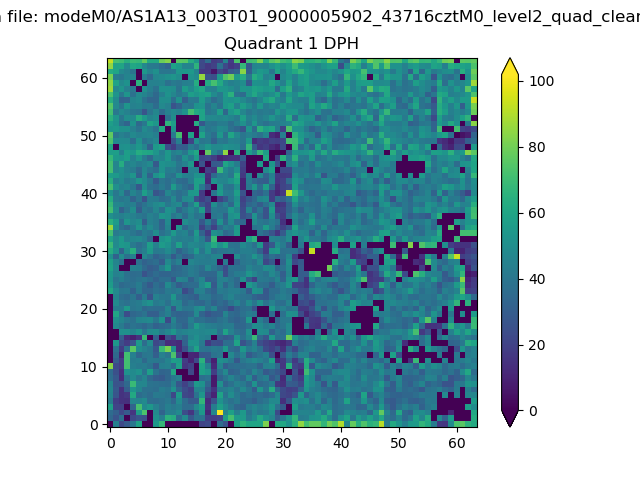 |
Quadrant B |
|---|---|---|---|
| Quadrant D | 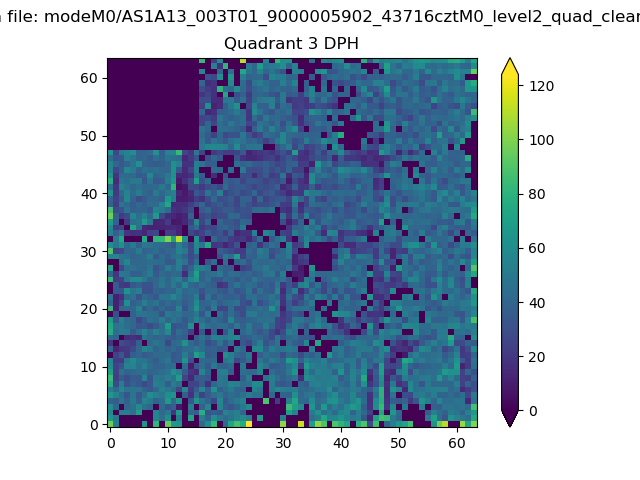 |
 |
Quadrant C |
| Plot type | Count rate plots | Images |
|---|---|---|
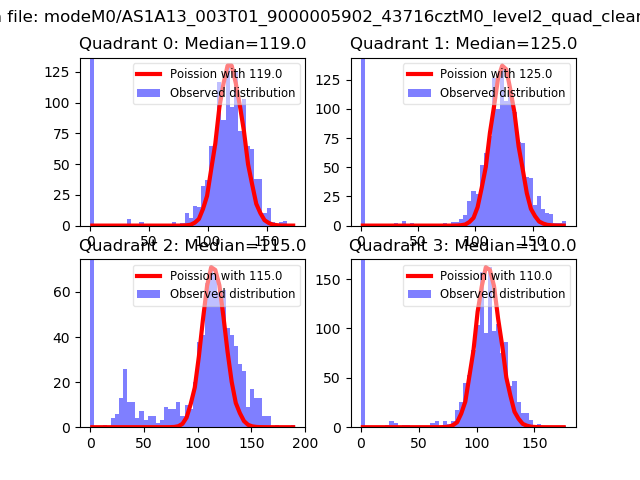
| Comparison with Poisson distribution Blue bars denote a histogram of data divided into 1 sec bins. Red curve is a Poisson curve with rate = median count rate of data. |
 |
 |
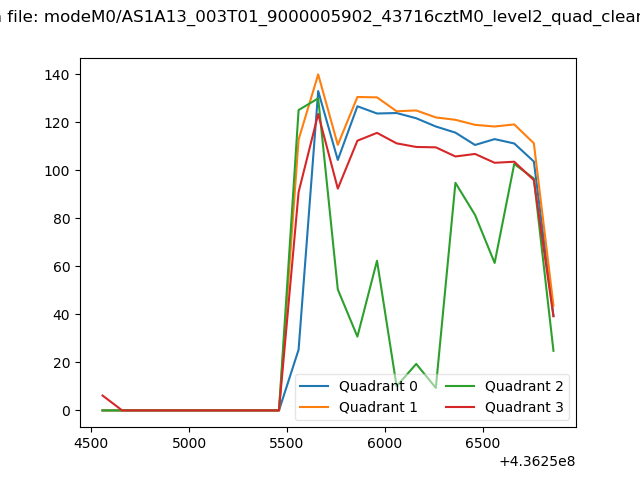
| Quadrant-wise count rates Data is divided into 100 sec bins |
 |
|
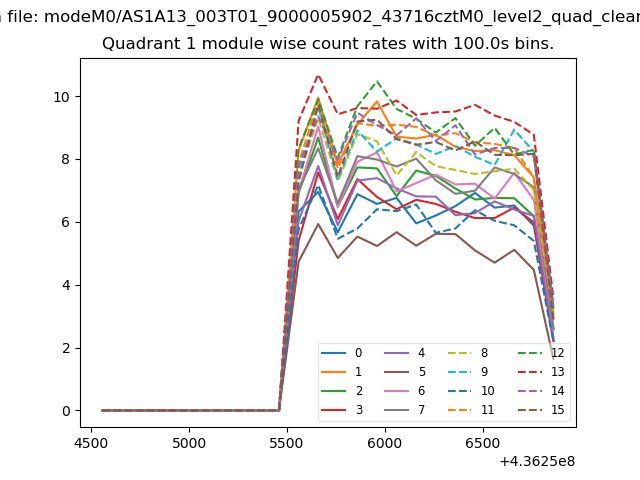
| Module-wise count rates for Quadrant A Data is divided into 100 sec bins |
 |
 |
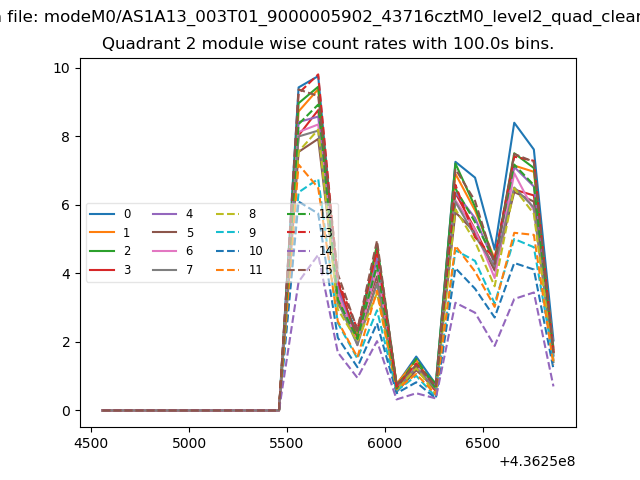
| Module-wise count rates for Quadrant B Data is divided into 100 sec bins |
 |
 |
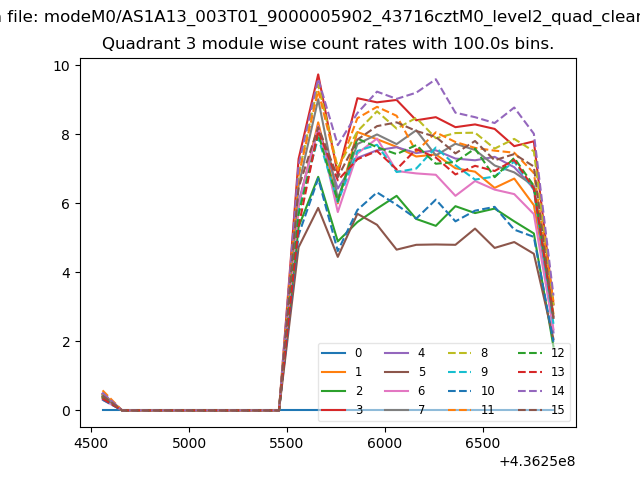
| Module-wise count rates for Quadrant C Data is divided into 100 sec bins |
 |
 |
| Module-wise count rates for Quadrant D Data is divided into 100 sec bins |
 |
 |
| Parameter | Plot |
|---|---|
| CZT HV Monitor | 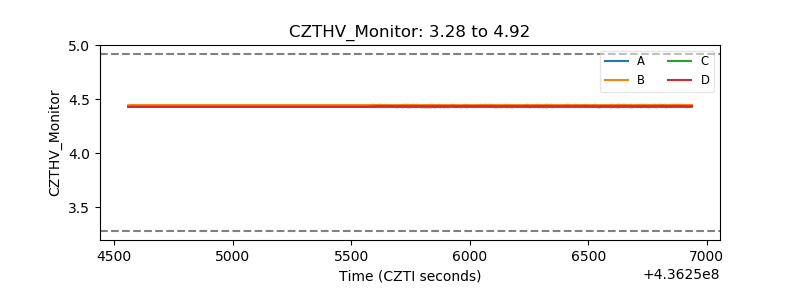 |
| D_VDD | 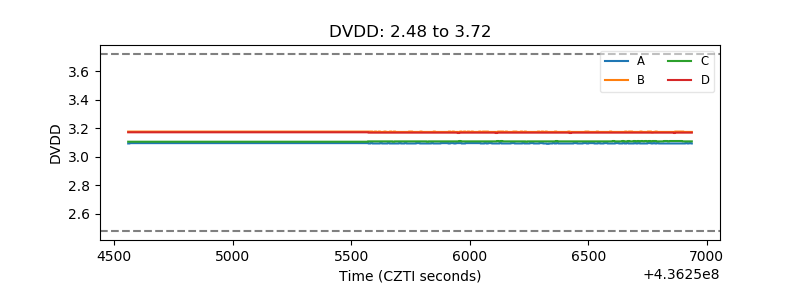 |
| Temperature 1 | 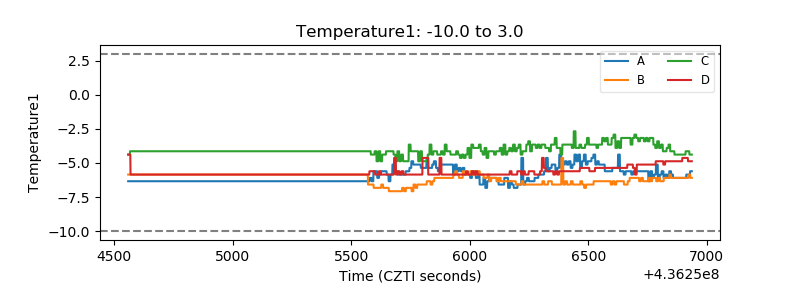 |
| Veto HV Monitor | 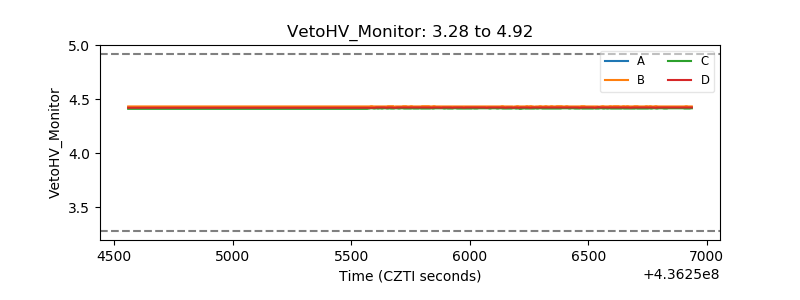 |
| Veto LLD | 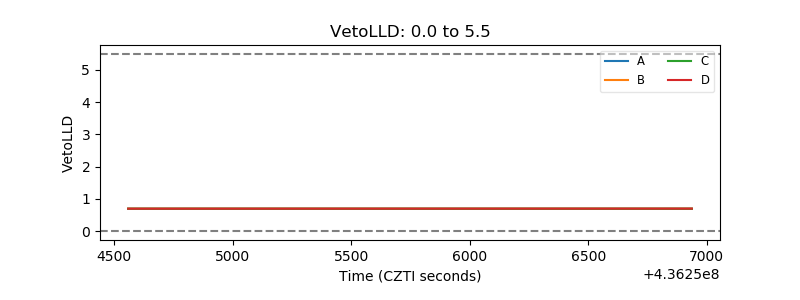 |
| Alpha Counter | 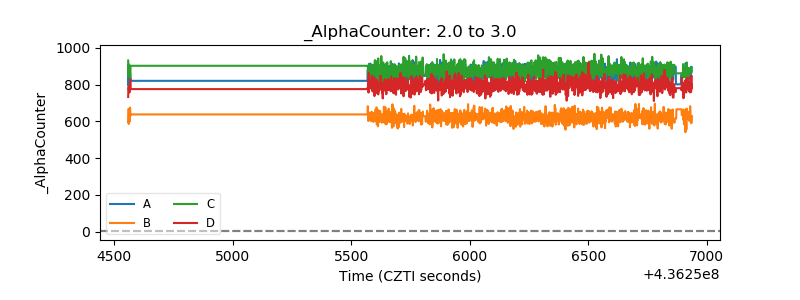 |
| _CPM_Rate | 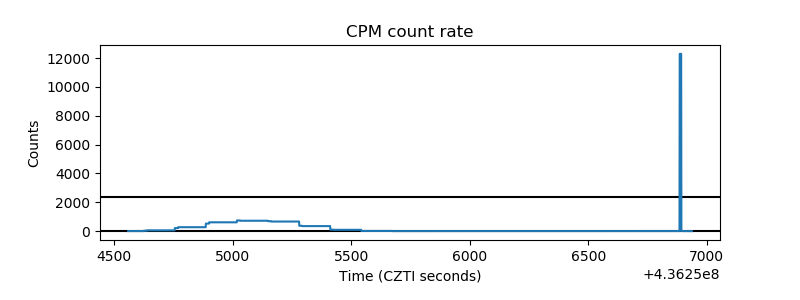 |
| CZT Counter | 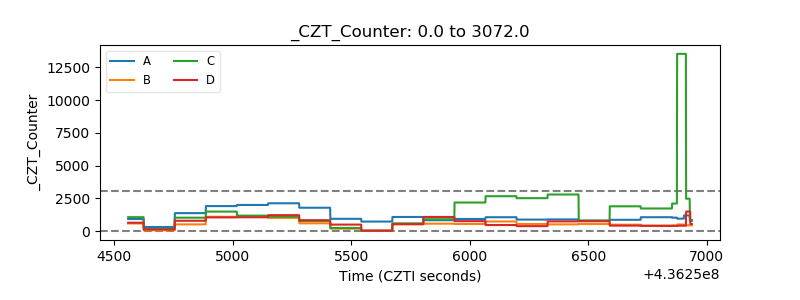 |
| +2.5 Volts monitor | 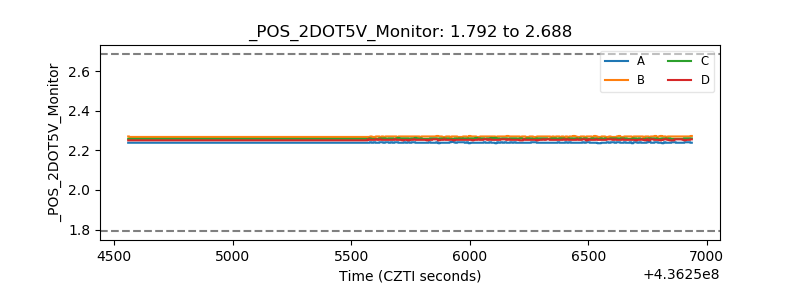 |
| +5 Volts monitor | 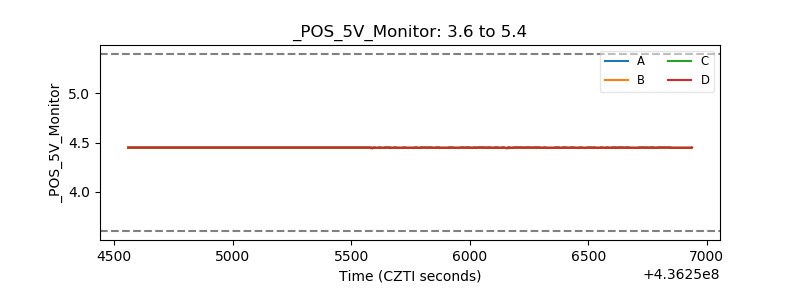 |
| _ROLL_ROT | 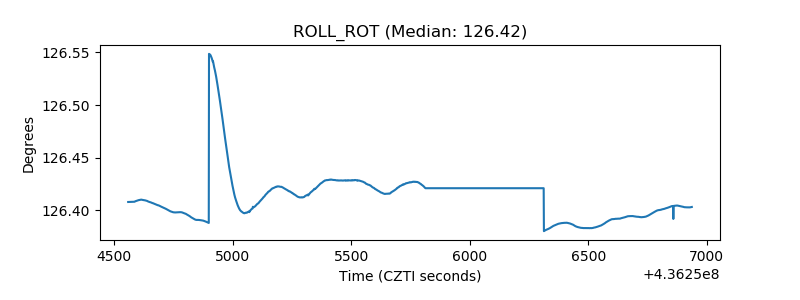 |
| _Roll_DEC | 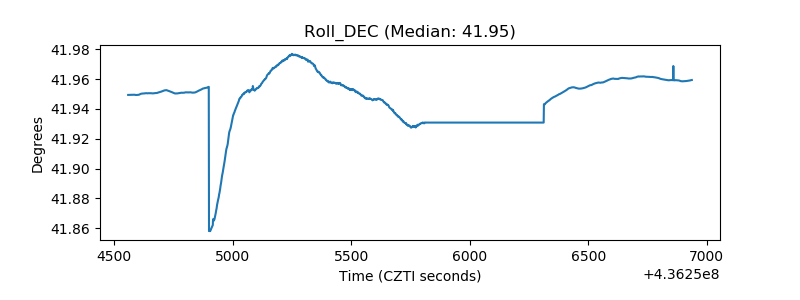 |
| _Roll_RA | 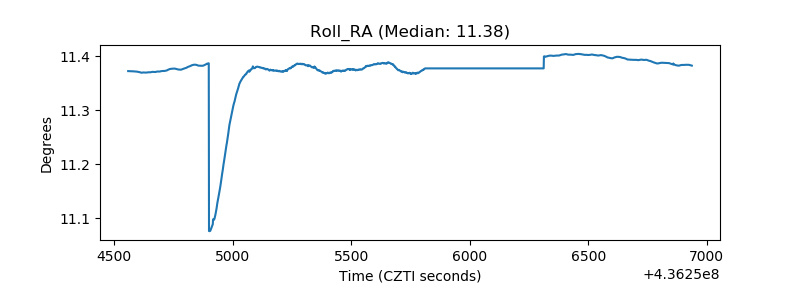 |
| Veto Counter | 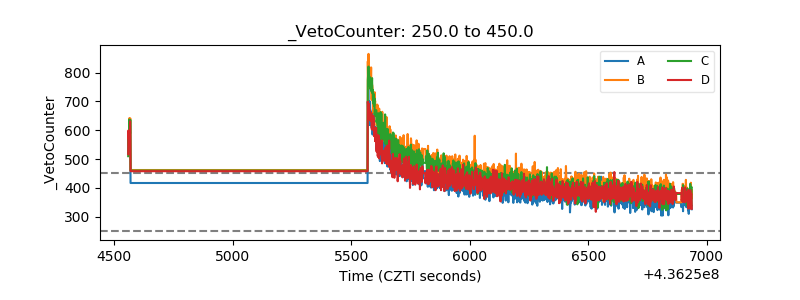 |