| Param | Original file | Final file |
|---|---|---|
| Filename | modeM0/AS1A13_003T01_9000005902_43720cztM0_level2.fits | modeM0/AS1A13_003T01_9000005902_43720cztM0_level2_quad_clean.evt |
| Size (bytes) | 832,556,160 | 107,729,280 |
| Size | 794.0 MB | 102.7 MB |
| Events in quadrant A | 7,370,913 | 833,306 |
| Events in quadrant B | 4,648,707 | 859,684 |
| Events in quadrant C | 7,531,678 | 610,499 |
| Events in quadrant D | 10,745,922 | 488,555 |
| Mode SS | |||
|---|---|---|---|
| Quadrant | BADHDUFLAG | Total packets | Discarded packets |
| A | 0 | 136 | 0 |
| B | 0 | 136 | 0 |
| C | 0 | 136 | 0 |
| D | 0 | 136 | 0 |
| Mode M0 | |||
|---|---|---|---|
| Quadrant | BADHDUFLAG | Total packets | Discarded packets |
| A | 0 | 26738 | 2 |
| B | 0 | 18175 | 2 |
| C | 0 | 26935 | 2 |
| D | 0 | 36522 | 3 |
| Mode M9 | |||
|---|---|---|---|
| Quadrant | BADHDUFLAG | Total packets | Discarded packets |
| A | 0 | 15 | 0 |
| B | 0 | 16 | 0 |
| C | 0 | 16 | 0 |
| D | 0 | 16 | 0 |
| Quadrant | Total seconds | Saturated seconds | Saturation percentage |
|---|---|---|---|
| A | 6744 | 335 | 4.967378% |
| B | 6744 | 358 | 5.308422% |
| C | 6744 | 1988 | 29.478055% |
| D | 6743 | 2668 | 39.566958% |
Noise dominated data is calculated using 1-second bins in cleaned event files. If a bin has >2000 counts, and if more than 50% of those come from <1% of pixels, then it is considered to be noise-dominated and hence unusable.
| Quadrant | # 1 sec bins | Bins with >0 counts | Bins with >2000 counts | High rate bins dominated by noise | Noise dominated (total time) | Noise dominated (detector-on time) | Marked lightcurve |
|---|---|---|---|---|---|---|---|
| A | 7914 | 6745 | 53 | 53 | 0.67% | 0.79% | 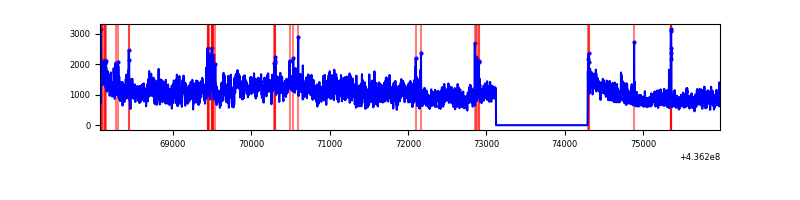 |
| B | 7914 | 6745 | 132 | 132 | 1.67% | 1.96% | 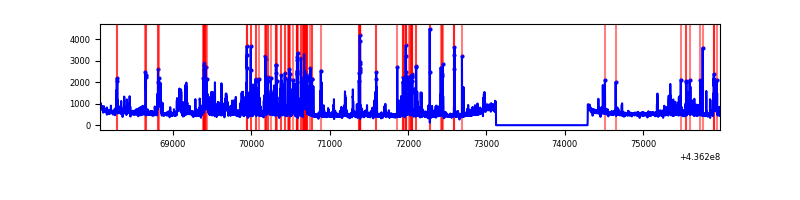 |
| C | 7914 | 6743 | 1091 | 1091 | 13.79% | 16.18% | 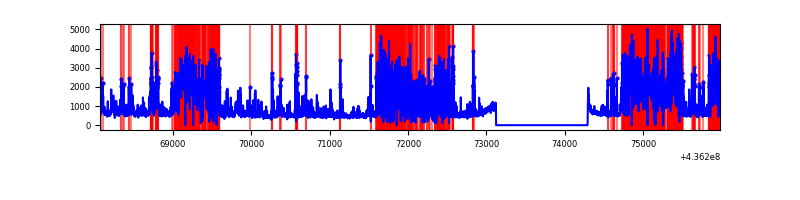 |
| D | 7913 | 6744 | 2325 | 2325 | 29.38% | 34.48% | 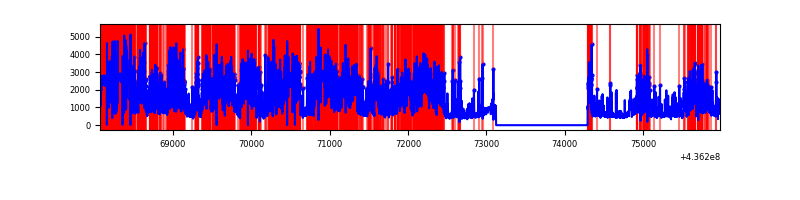 |
Top three noisy pixels from each quadrant. If the there are fewer than three noisy pixels in the level2.evt file, extra rows are filled as -1
| Pixel properties | Quadrant properties | ||||||
|---|---|---|---|---|---|---|---|
| Quadrant | DetID | PixID | Counts | Sigma | Mean | Median | Sigma |
| A | 15 | 222 | 2626261 | 15155.16 | 845 | 829 | 173.2 |
| A | 10 | 83 | 941044 | 5427.34 | 845 | 829 | 173.2 |
| A | 14 | 63 | 339357 | 1954.13 | 845 | 829 | 173.2 |
| B | 4 | 171 | 771862 | 4785.61 | 837 | 814 | 161.1 |
| B | 5 | 235 | 302010 | 1869.41 | 837 | 814 | 161.1 |
| B | 0 | 199 | 130011 | 801.88 | 837 | 814 | 161.1 |
| C | 15 | 157 | 3568257 | 22203.31 | 684 | 688 | 160.7 |
| C | 15 | 158 | 770119 | 4788.67 | 684 | 688 | 160.7 |
| C | 3 | 233 | 205489 | 1274.61 | 684 | 688 | 160.7 |
| D | 4 | 237 | 6217906 | 36689.23 | 667 | 646 | 169.5 |
| D | 5 | 235 | 394599 | 2324.79 | 667 | 646 | 169.5 |
| D | 7 | 80 | 265045 | 1560.27 | 667 | 646 | 169.5 |
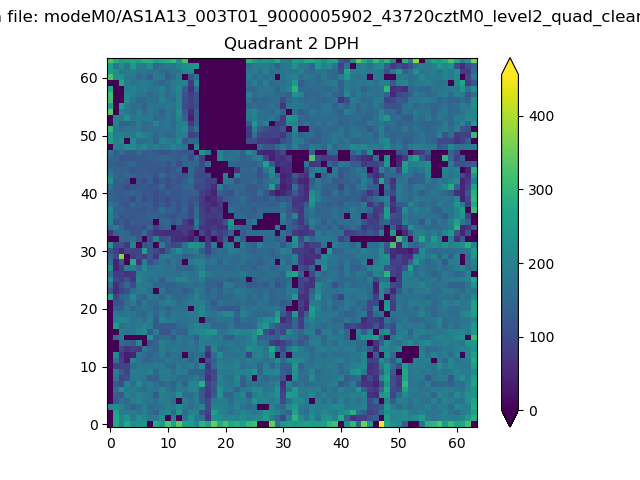
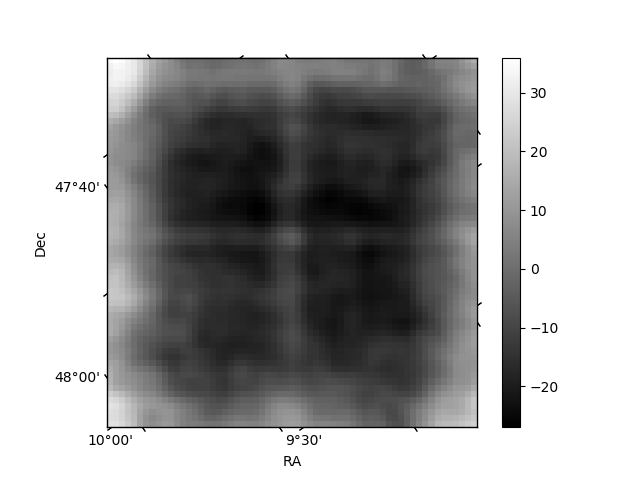
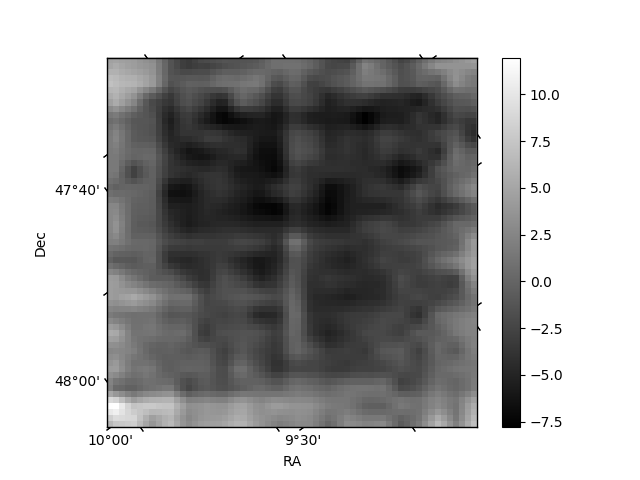
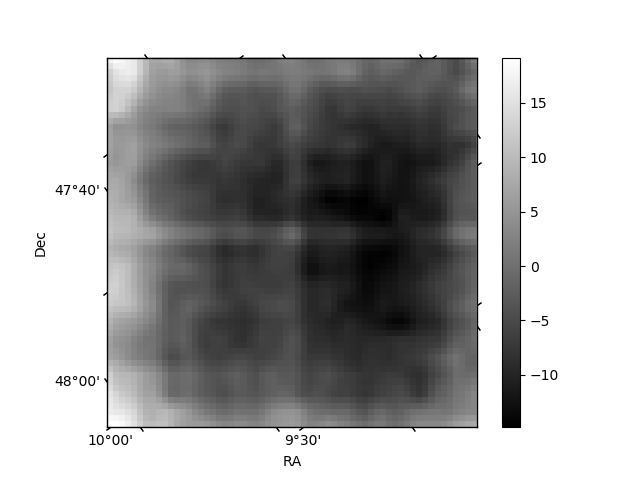
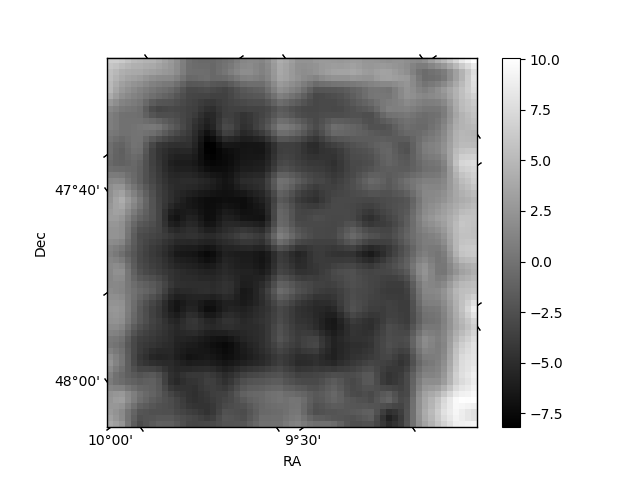
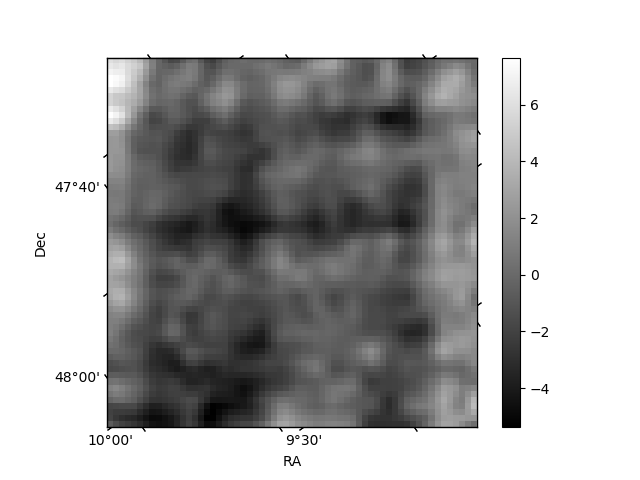
Histogram calculated using DETX and DETY for each event in the final _common_clean file
| Quadrant A | 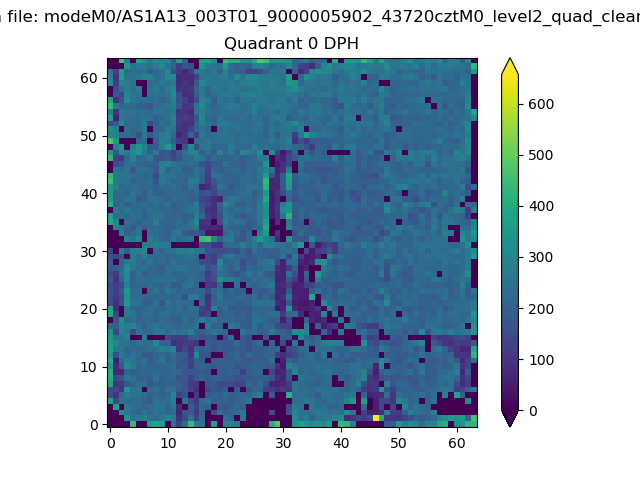 |
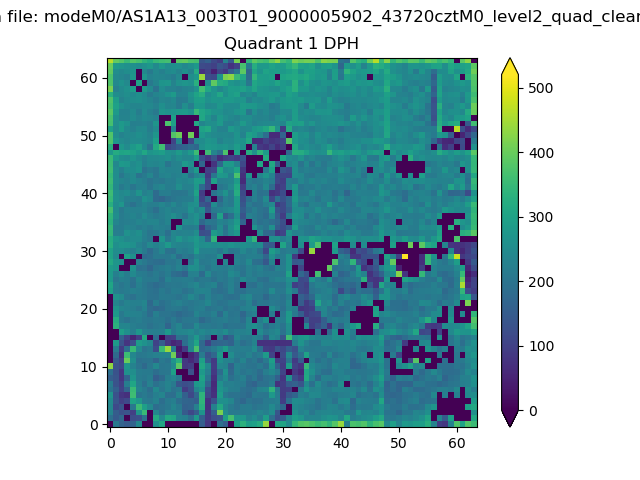 |
Quadrant B |
|---|---|---|---|
| Quadrant D | 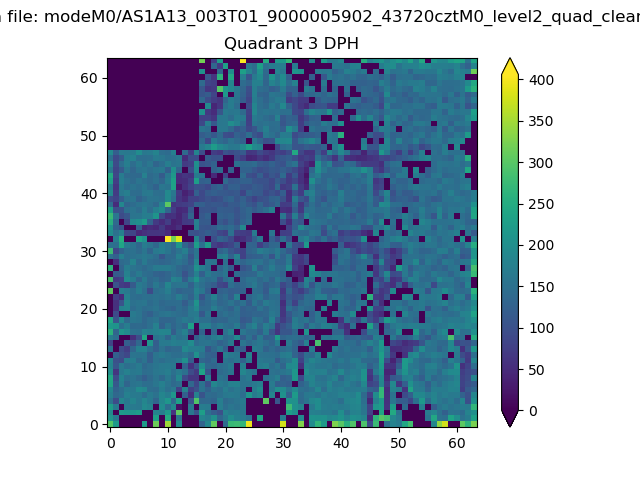 |
 |
Quadrant C |
| Plot type | Count rate plots | Images |
|---|---|---|
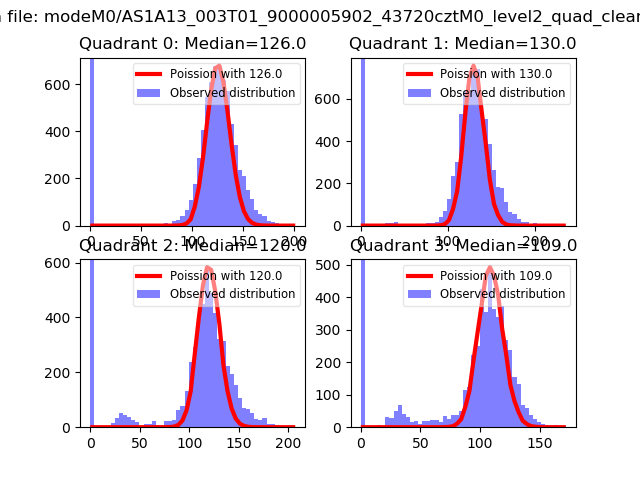
| Comparison with Poisson distribution Blue bars denote a histogram of data divided into 1 sec bins. Red curve is a Poisson curve with rate = median count rate of data. |
 |
 |
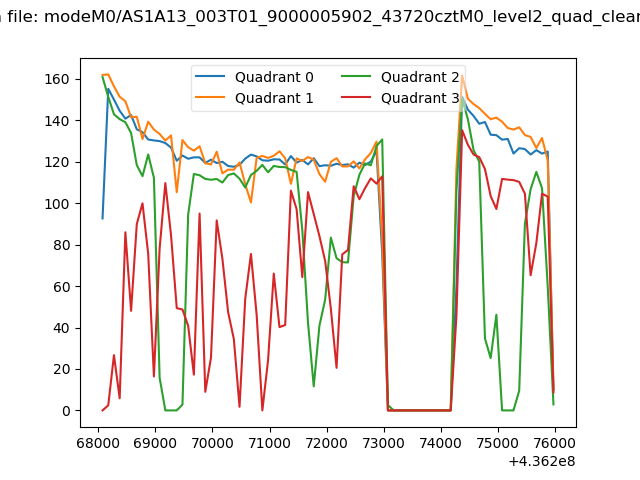
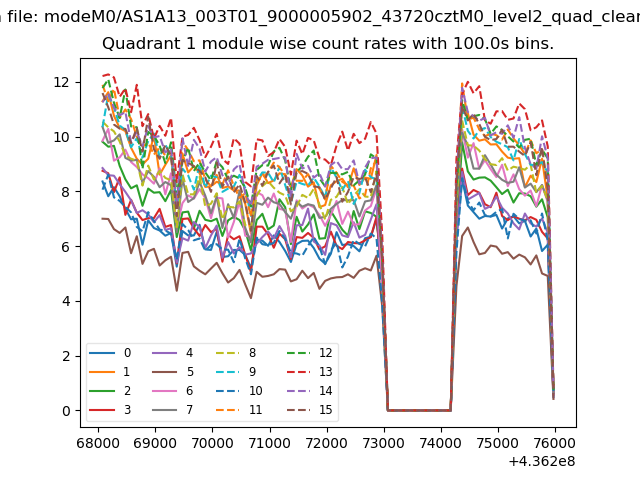
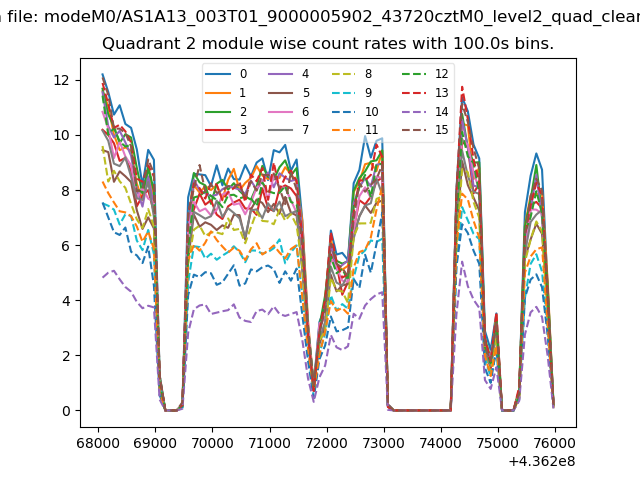
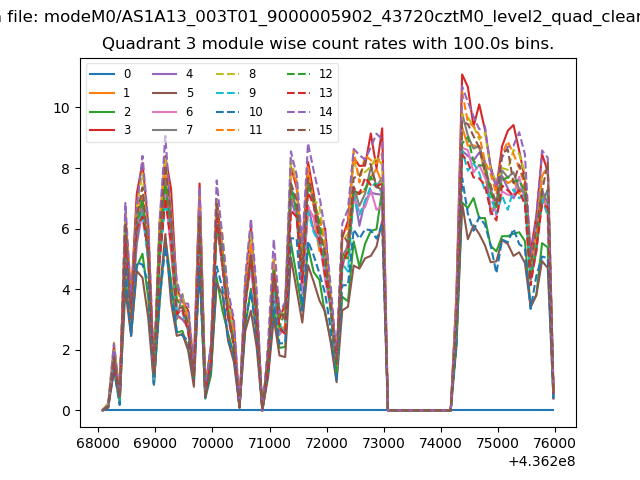
| Quadrant-wise count rates Data is divided into 100 sec bins |
 |
|
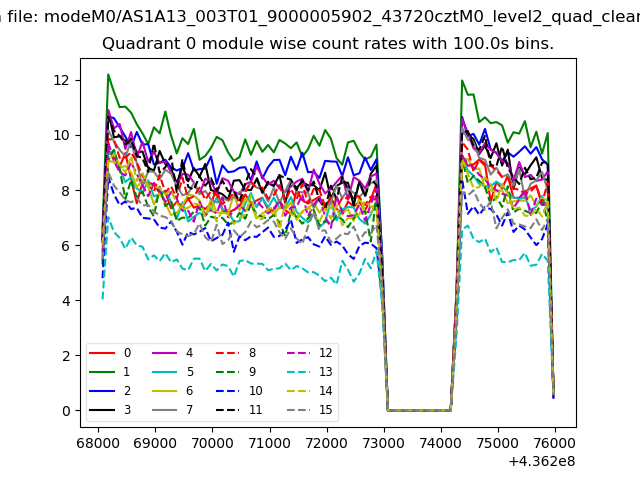
| Module-wise count rates for Quadrant A Data is divided into 100 sec bins |
 |
 |
| Module-wise count rates for Quadrant B Data is divided into 100 sec bins |
 |
 |
| Module-wise count rates for Quadrant C Data is divided into 100 sec bins |
 |
 |
| Module-wise count rates for Quadrant D Data is divided into 100 sec bins |
 |
 |
| Parameter | Plot |
|---|---|
| CZT HV Monitor |  |
| D_VDD | 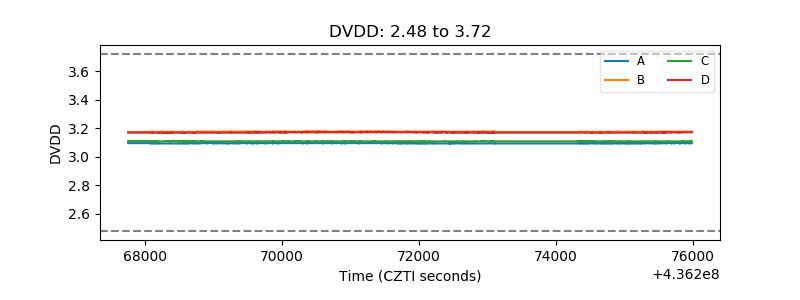 |
| Temperature 1 | 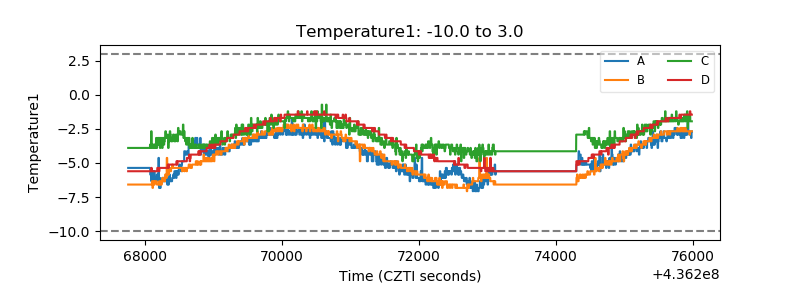 |
| Veto HV Monitor | 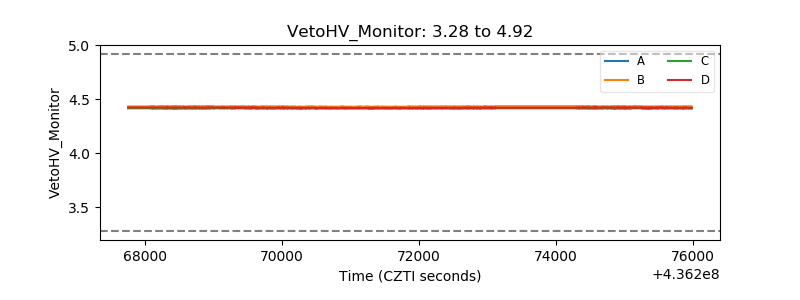 |
| Veto LLD | 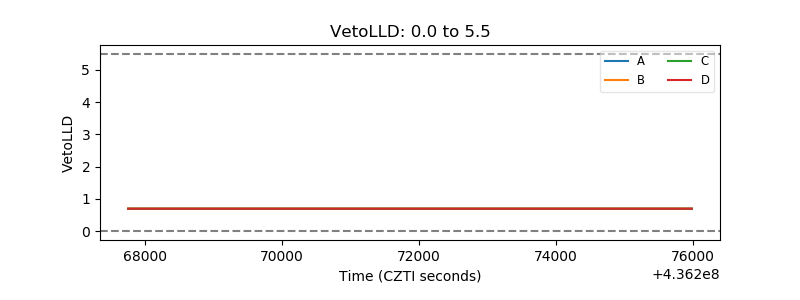 |
| Alpha Counter | 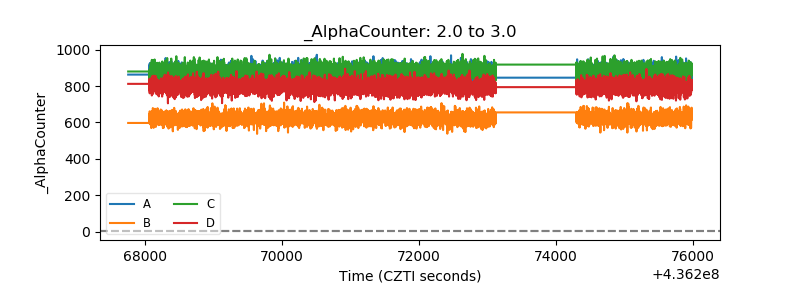 |
| _CPM_Rate | 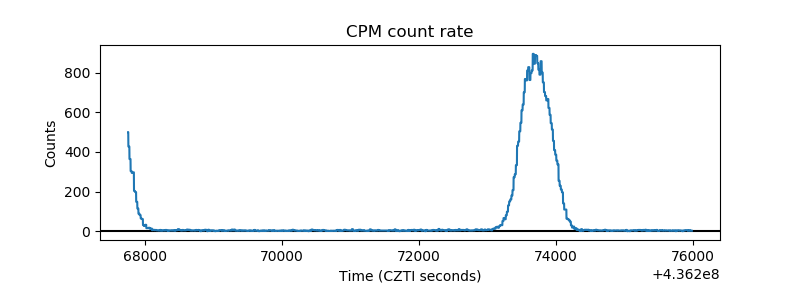 |
| CZT Counter | 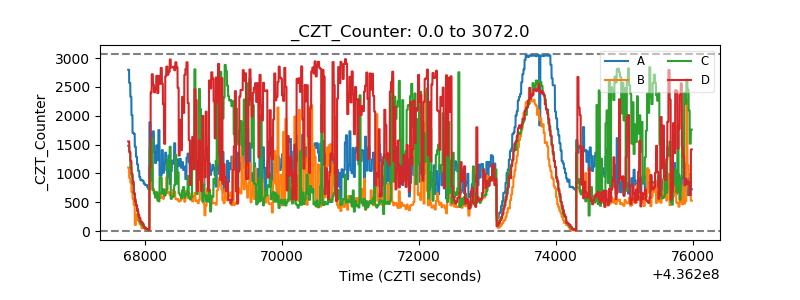 |
| +2.5 Volts monitor | 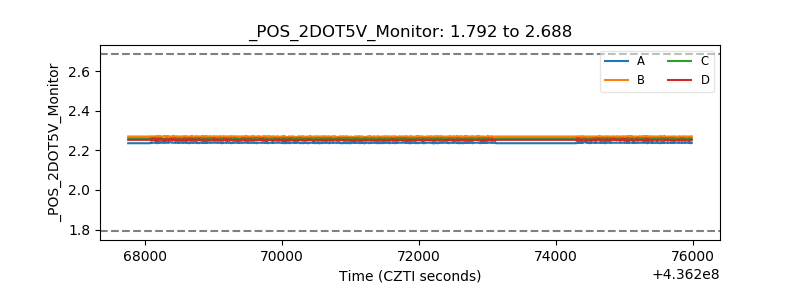 |
| +5 Volts monitor | 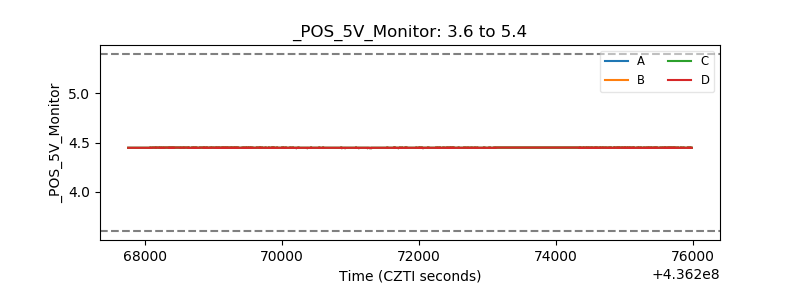 |
| _ROLL_ROT | 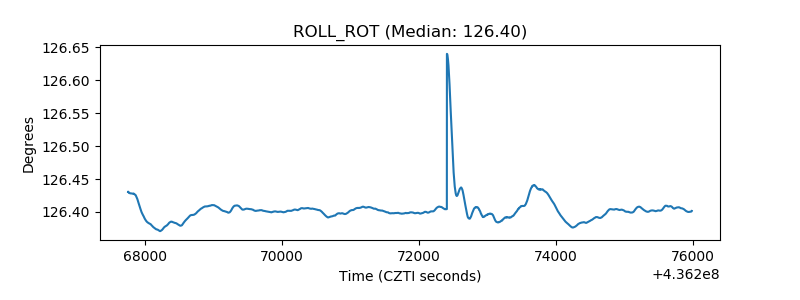 |
| _Roll_DEC |  |
| _Roll_RA | 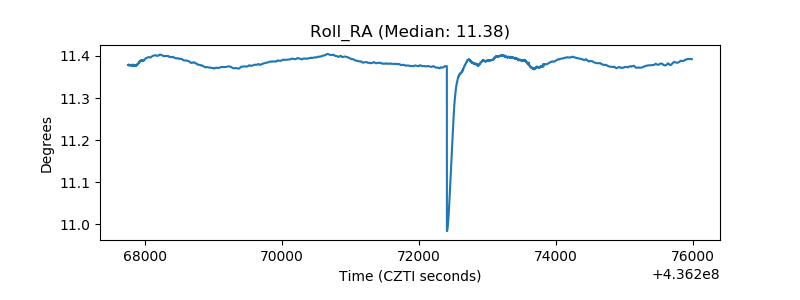 |
| Veto Counter | 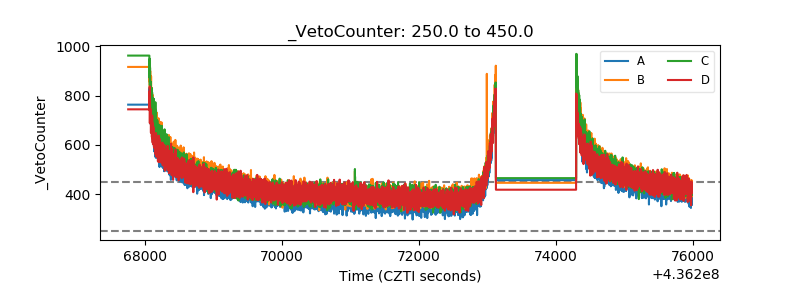 |