| Param | Original file | Final file |
|---|---|---|
| Filename | modeM0/AS1A13_003T01_9000005902_43724cztM0_level2.fits | modeM0/AS1A13_003T01_9000005902_43724cztM0_level2_quad_clean.evt |
| Size (bytes) | 730,307,520 | 122,699,520 |
| Size | 696.5 MB | 117.0 MB |
| Events in quadrant A | 9,154,581 | 809,885 |
| Events in quadrant B | 4,478,575 | 875,259 |
| Events in quadrant C | 6,148,732 | 778,816 |
| Events in quadrant D | 6,652,955 | 712,947 |
| Mode SS | |||
|---|---|---|---|
| Quadrant | BADHDUFLAG | Total packets | Discarded packets |
| A | 0 | 154 | 0 |
| B | 0 | 154 | 0 |
| C | 0 | 154 | 0 |
| D | 0 | 154 | 0 |
| Mode M0 | |||
|---|---|---|---|
| Quadrant | BADHDUFLAG | Total packets | Discarded packets |
| A | 0 | 32609 | 2 |
| B | 0 | 18600 | 0 |
| C | 0 | 23363 | 0 |
| D | 0 | 25103 | 0 |
| Quadrant | Total seconds | Saturated seconds | Saturation percentage |
|---|---|---|---|
| A | 7739 | 798 | 10.311410% |
| B | 7740 | 286 | 3.695090% |
| C | 7740 | 869 | 11.227390% |
| D | 7740 | 798 | 10.310078% |
Noise dominated data is calculated using 1-second bins in cleaned event files. If a bin has >2000 counts, and if more than 50% of those come from <1% of pixels, then it is considered to be noise-dominated and hence unusable.
| Quadrant | # 1 sec bins | Bins with >0 counts | Bins with >2000 counts | High rate bins dominated by noise | Noise dominated (total time) | Noise dominated (detector-on time) | Marked lightcurve |
|---|---|---|---|---|---|---|---|
| A | 7739 | 7739 | 441 | 441 | 5.70% | 5.70% | 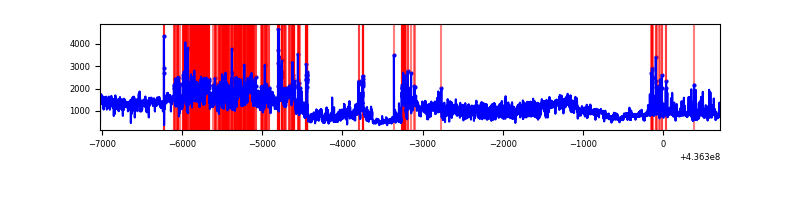 |
| B | 7740 | 7740 | 80 | 80 | 1.03% | 1.03% | 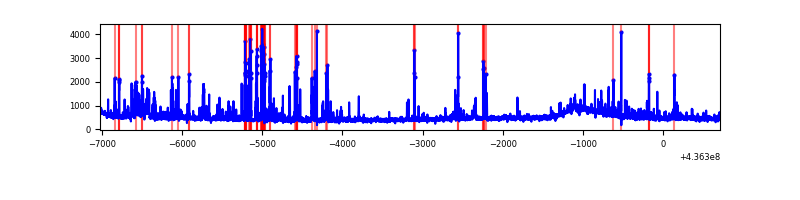 |
| C | 7740 | 7739 | 521 | 521 | 6.73% | 6.73% | 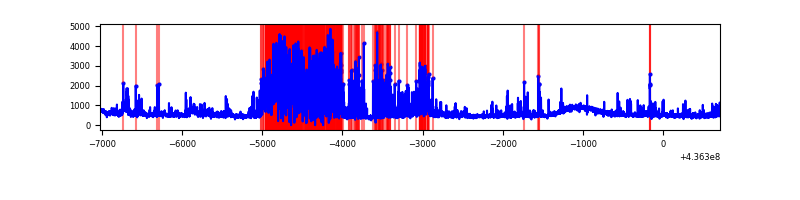 |
| D | 7740 | 7740 | 451 | 451 | 5.83% | 5.83% | 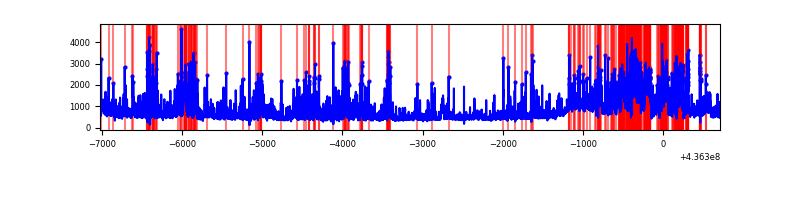 |
Top three noisy pixels from each quadrant. If the there are fewer than three noisy pixels in the level2.evt file, extra rows are filled as -1
| Pixel properties | Quadrant properties | ||||||
|---|---|---|---|---|---|---|---|
| Quadrant | DetID | PixID | Counts | Sigma | Mean | Median | Sigma |
| A | 15 | 222 | 3454502 | 18224.44 | 907 | 886 | 189.5 |
| A | 10 | 83 | 906641 | 4779.59 | 907 | 886 | 189.5 |
| A | 14 | 63 | 671754 | 3540.11 | 907 | 886 | 189.5 |
| B | 5 | 235 | 351955 | 1944.91 | 912 | 885 | 180.5 |
| B | 0 | 199 | 241917 | 1335.31 | 912 | 885 | 180.5 |
| B | 4 | 171 | 168004 | 925.83 | 912 | 885 | 180.5 |
| C | 15 | 157 | 1785151 | 8665.73 | 864 | 867 | 205.9 |
| C | 15 | 158 | 636301 | 3086.11 | 864 | 867 | 205.9 |
| C | 3 | 233 | 263040 | 1273.3 | 864 | 867 | 205.9 |
| D | 1 | 52 | 858149 | 3753.36 | 882 | 855 | 228.4 |
| D | 5 | 235 | 764638 | 3343.95 | 882 | 855 | 228.4 |
| D | 13 | 171 | 412228 | 1801.05 | 882 | 855 | 228.4 |
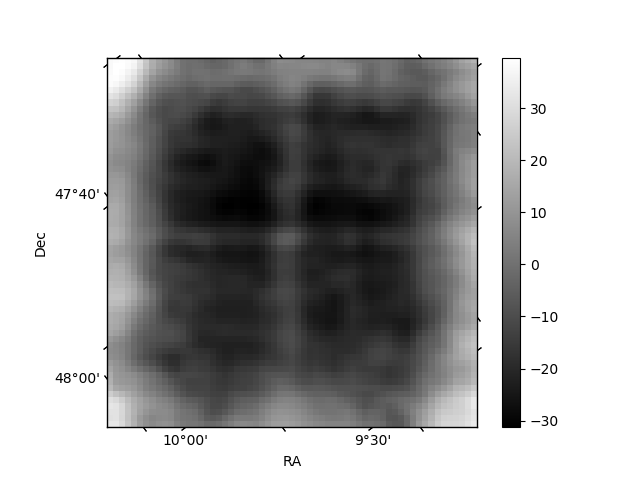
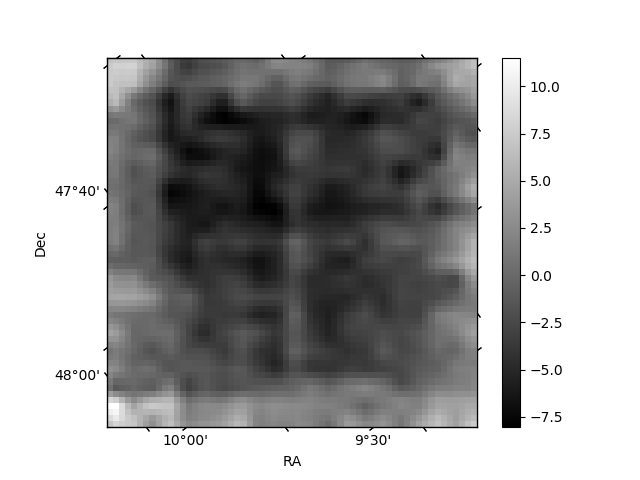
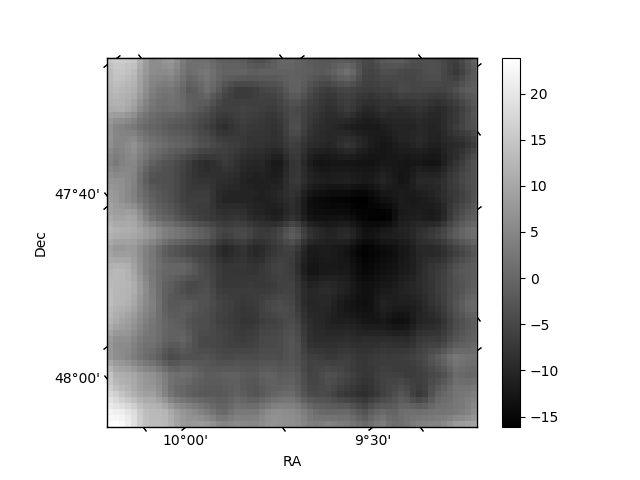
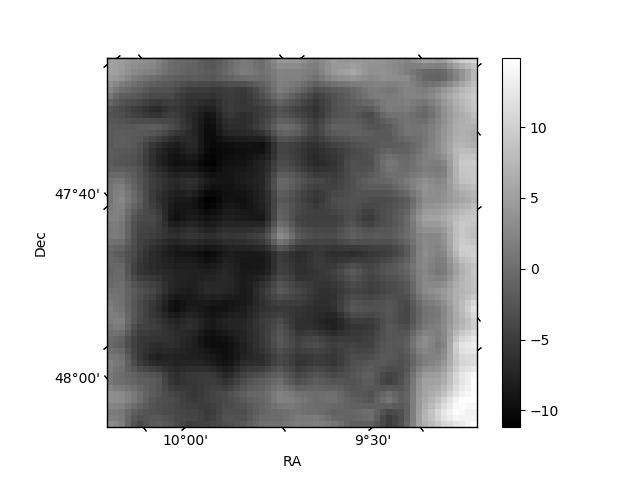
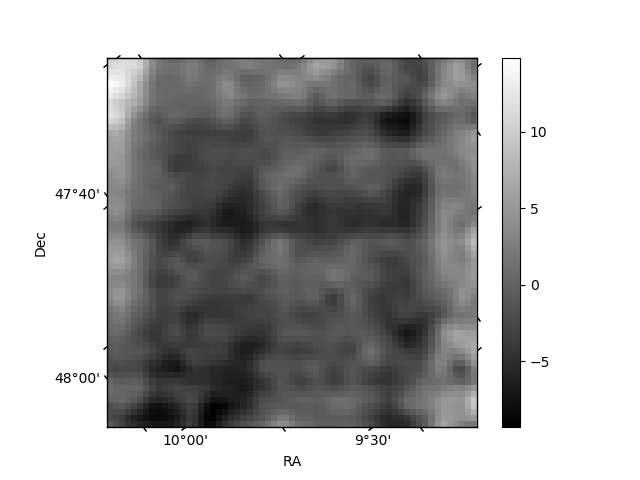
Histogram calculated using DETX and DETY for each event in the final _common_clean file
| Quadrant A | 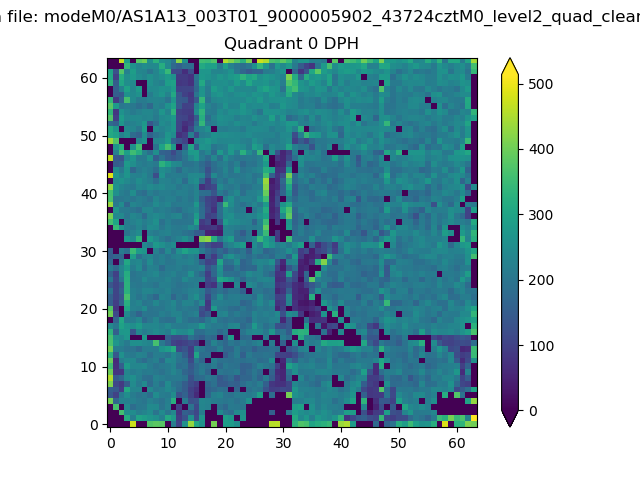 |
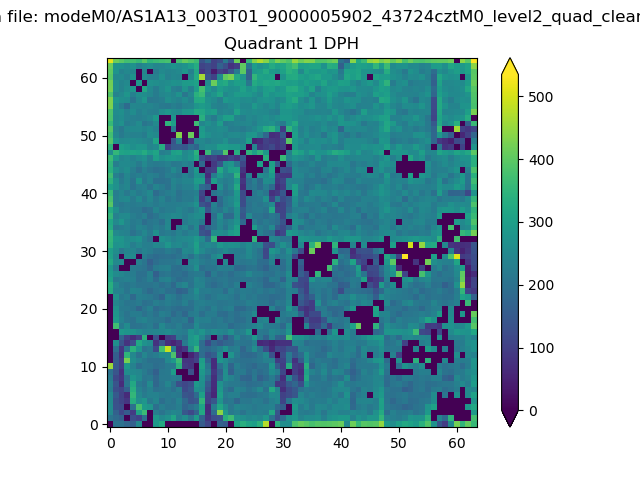 |
Quadrant B |
|---|---|---|---|
| Quadrant D | 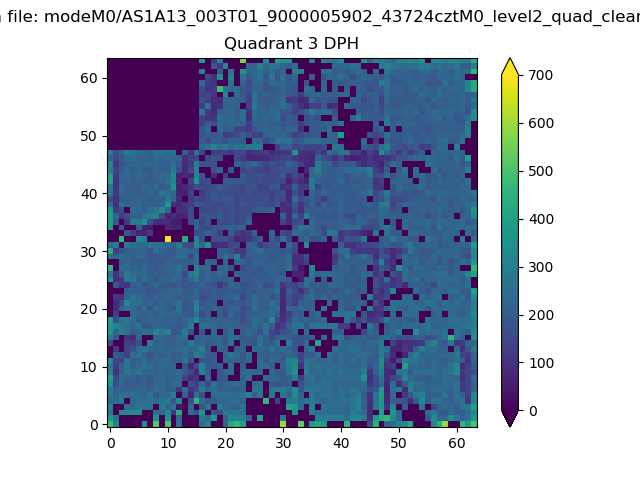 |
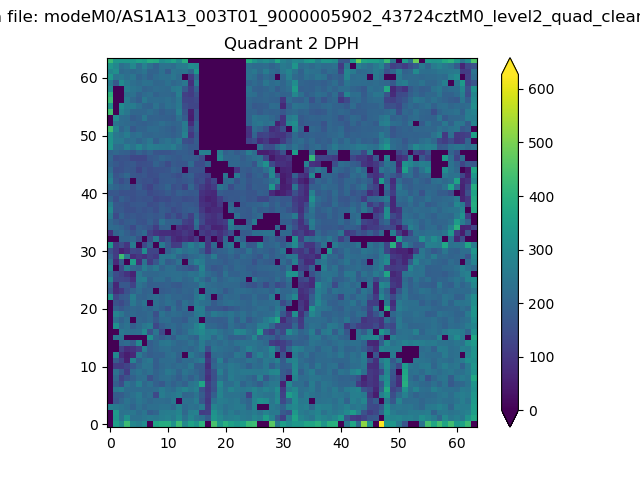 |
Quadrant C |
| Plot type | Count rate plots | Images |
|---|---|---|
| Comparison with Poisson distribution Blue bars denote a histogram of data divided into 1 sec bins. Red curve is a Poisson curve with rate = median count rate of data. |
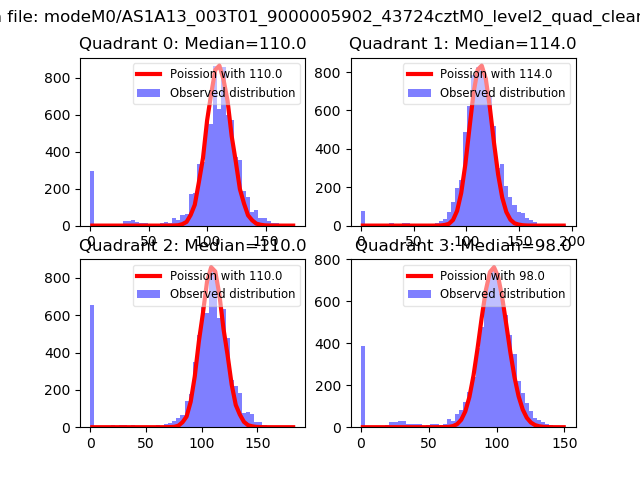 |
 |
| Quadrant-wise count rates Data is divided into 100 sec bins |
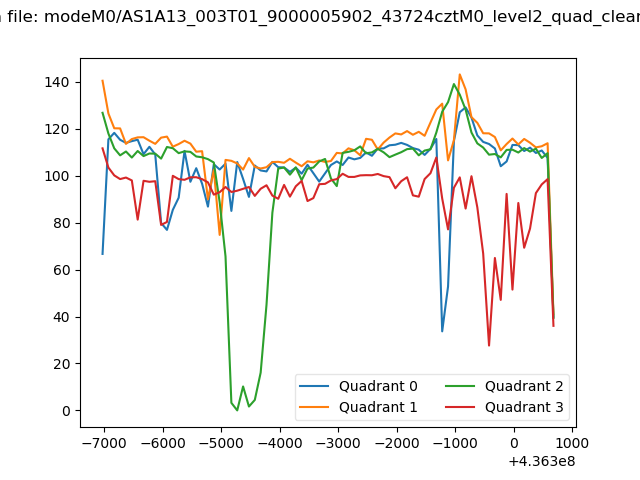 |
|
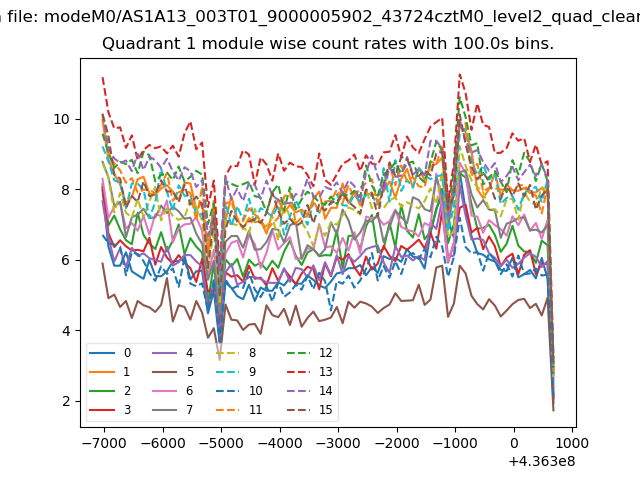
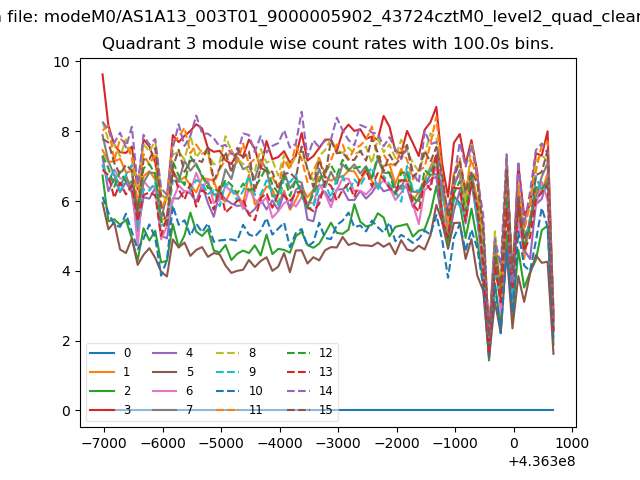
| Module-wise count rates for Quadrant A Data is divided into 100 sec bins |
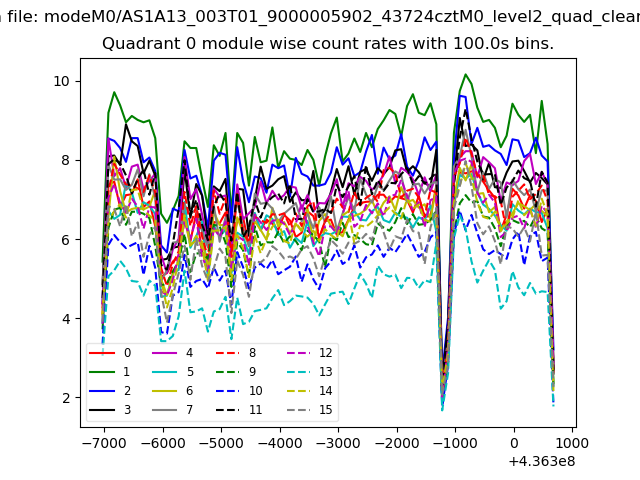 |
 |
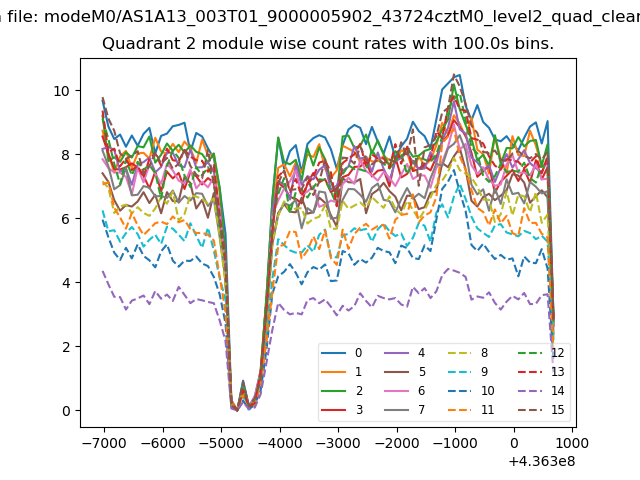
| Module-wise count rates for Quadrant B Data is divided into 100 sec bins |
 |
 |
| Module-wise count rates for Quadrant C Data is divided into 100 sec bins |
 |
 |
| Module-wise count rates for Quadrant D Data is divided into 100 sec bins |
 |
 |
| Parameter | Plot |
|---|---|
| CZT HV Monitor | 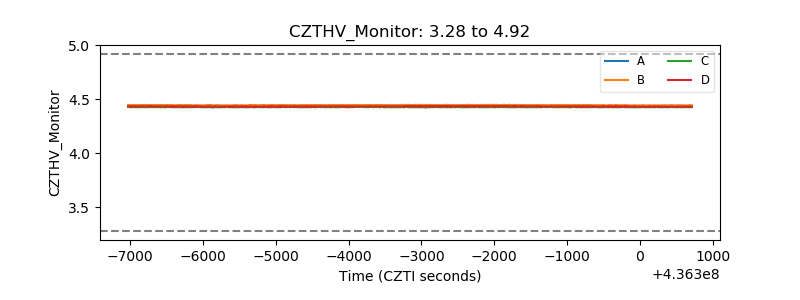 |
| D_VDD | 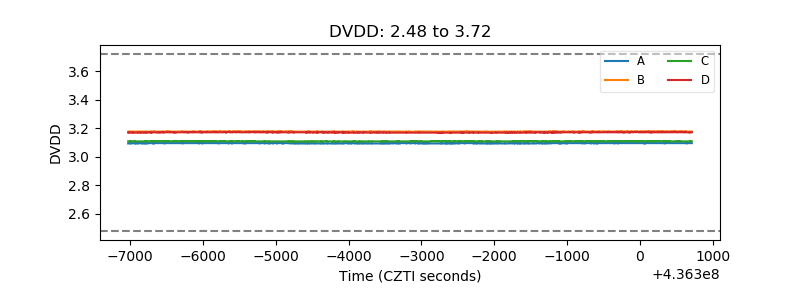 |
| Temperature 1 | 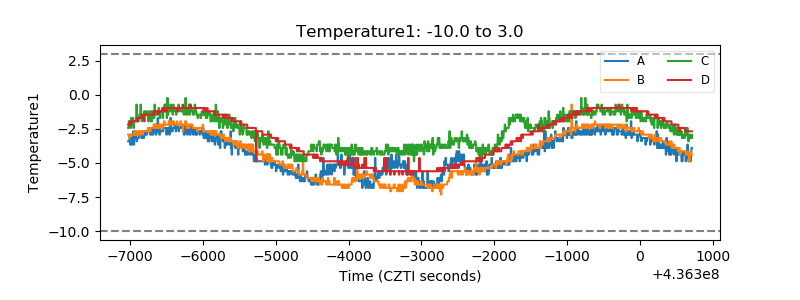 |
| Veto HV Monitor | 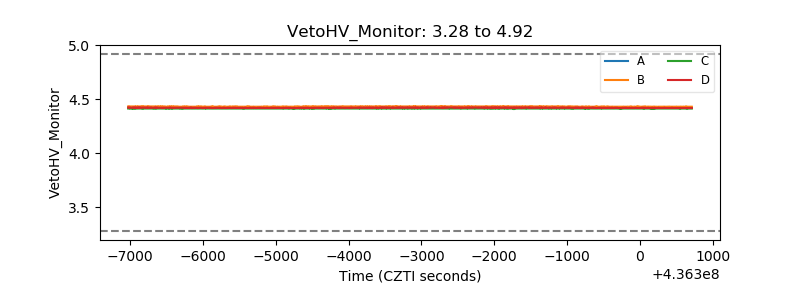 |
| Veto LLD | 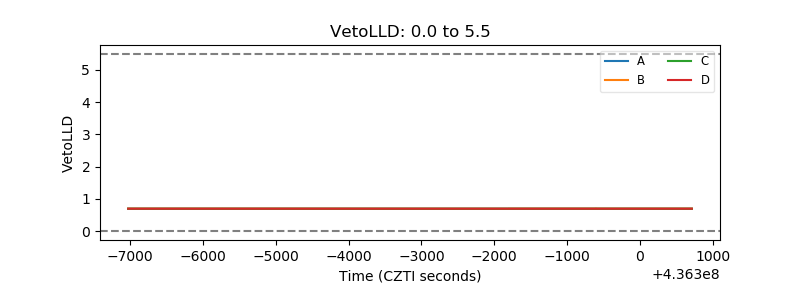 |
| Alpha Counter | 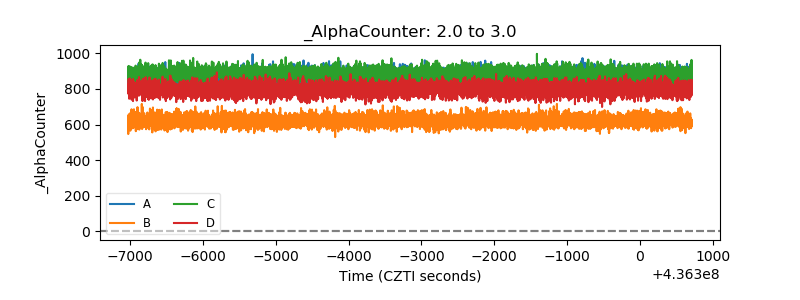 |
| _CPM_Rate | 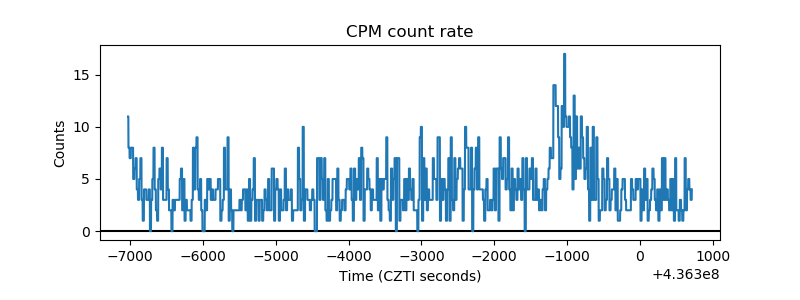 |
| CZT Counter | 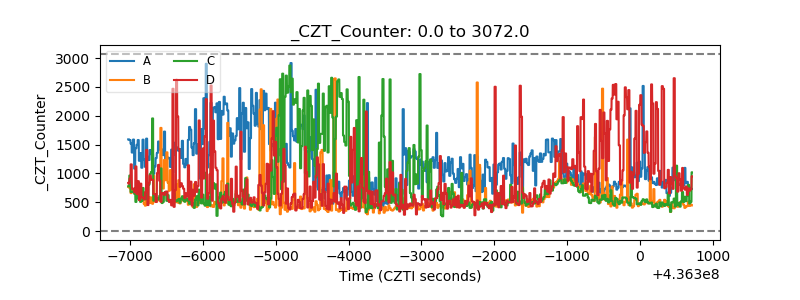 |
| +2.5 Volts monitor | 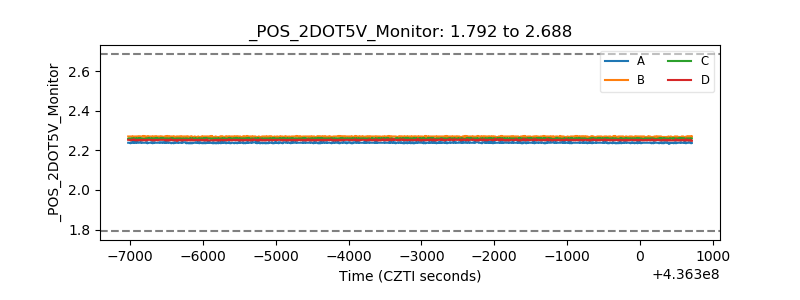 |
| +5 Volts monitor | 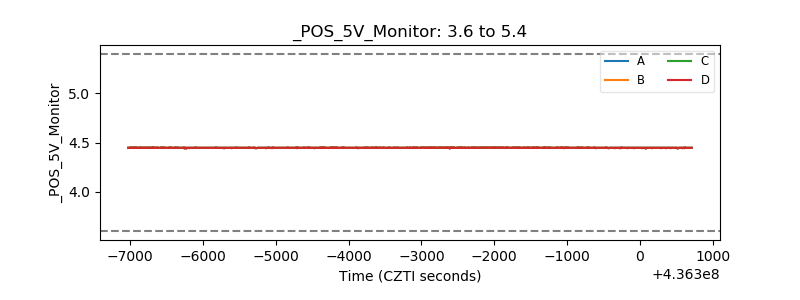 |
| _ROLL_ROT | 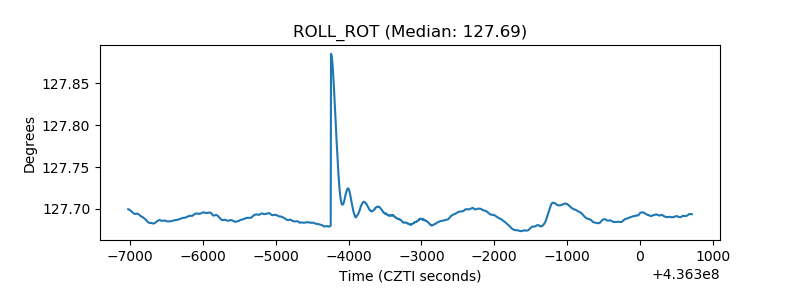 |
| _Roll_DEC | 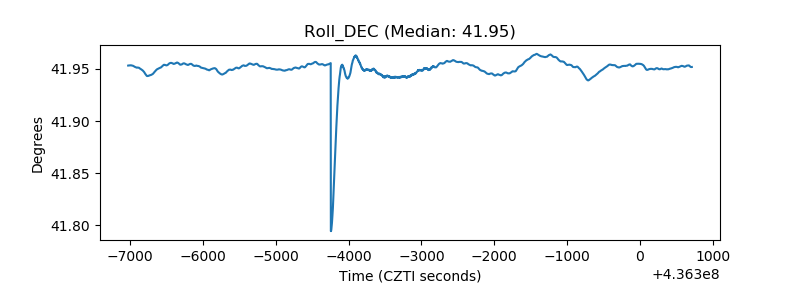 |
| _Roll_RA | 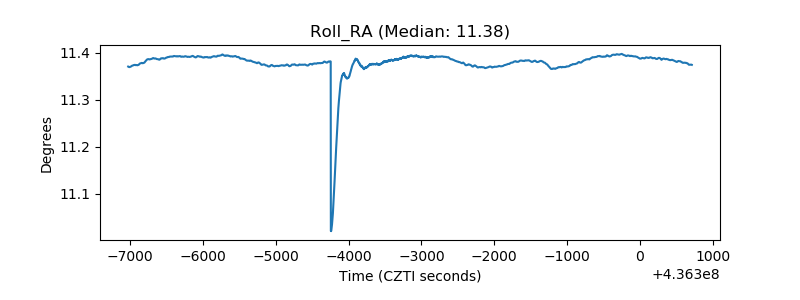 |
| Veto Counter | 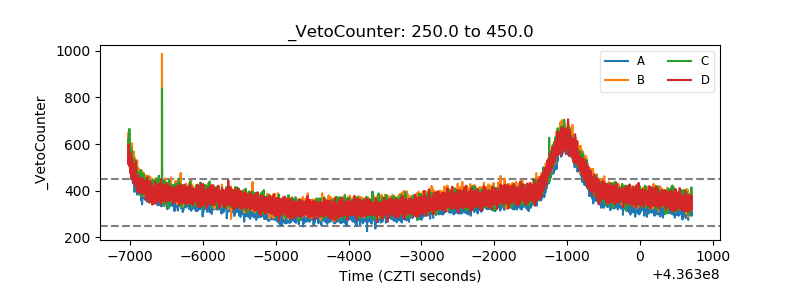 |