| Param | Original file | Final file |
|---|---|---|
| Filename | modeM0/AS1A13_003T01_9000005902_43725cztM0_level2.fits | modeM0/AS1A13_003T01_9000005902_43725cztM0_level2_quad_clean.evt |
| Size (bytes) | 652,095,360 | 120,565,440 |
| Size | 621.9 MB | 115.0 MB |
| Events in quadrant A | 6,223,509 | 807,439 |
| Events in quadrant B | 4,261,292 | 836,555 |
| Events in quadrant C | 5,402,365 | 805,777 |
| Events in quadrant D | 7,665,734 | 674,628 |
| Mode SS | |||
|---|---|---|---|
| Quadrant | BADHDUFLAG | Total packets | Discarded packets |
| A | 0 | 150 | 0 |
| B | 0 | 150 | 0 |
| C | 0 | 150 | 0 |
| D | 0 | 150 | 0 |
| Mode M0 | |||
|---|---|---|---|
| Quadrant | BADHDUFLAG | Total packets | Discarded packets |
| A | 0 | 23661 | 0 |
| B | 0 | 17891 | 0 |
| C | 0 | 21305 | 0 |
| D | 0 | 27985 | 0 |
| Quadrant | Total seconds | Saturated seconds | Saturation percentage |
|---|---|---|---|
| A | 7565 | 320 | 4.230007% |
| B | 7564 | 224 | 2.961396% |
| C | 7565 | 272 | 3.595506% |
| D | 7565 | 989 | 13.073364% |
Noise dominated data is calculated using 1-second bins in cleaned event files. If a bin has >2000 counts, and if more than 50% of those come from <1% of pixels, then it is considered to be noise-dominated and hence unusable.
| Quadrant | # 1 sec bins | Bins with >0 counts | Bins with >2000 counts | High rate bins dominated by noise | Noise dominated (total time) | Noise dominated (detector-on time) | Marked lightcurve |
|---|---|---|---|---|---|---|---|
| A | 7565 | 7565 | 163 | 163 | 2.15% | 2.15% | 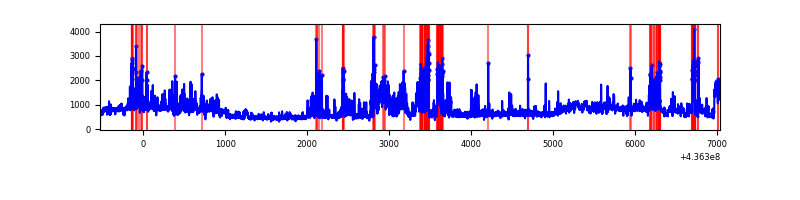 |
| B | 7564 | 7564 | 123 | 123 | 1.63% | 1.63% | 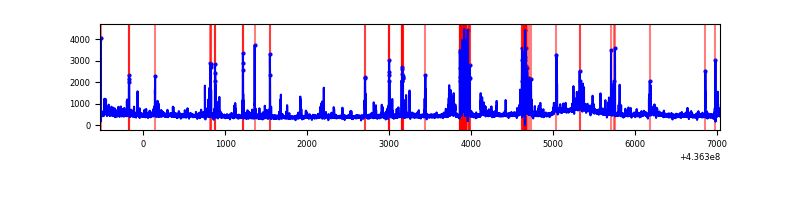 |
| C | 7565 | 7565 | 180 | 180 | 2.38% | 2.38% | 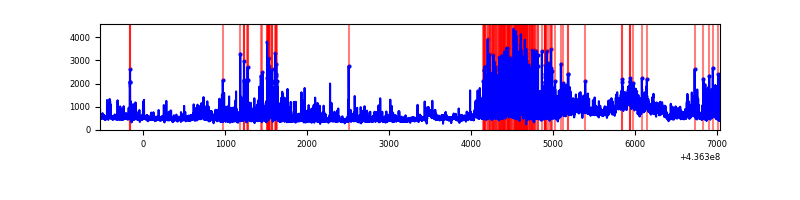 |
| D | 7565 | 7565 | 651 | 651 | 8.61% | 8.61% | 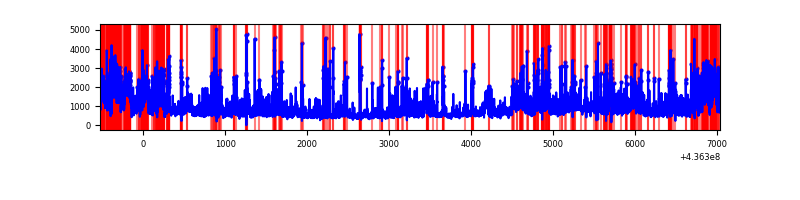 |
Top three noisy pixels from each quadrant. If the there are fewer than three noisy pixels in the level2.evt file, extra rows are filled as -1
| Pixel properties | Quadrant properties | ||||||
|---|---|---|---|---|---|---|---|
| Quadrant | DetID | PixID | Counts | Sigma | Mean | Median | Sigma |
| A | 15 | 223 | 1001276 | 5581.0 | 855 | 837 | 179.3 |
| A | 10 | 83 | 850363 | 4739.12 | 855 | 837 | 179.3 |
| A | 14 | 63 | 763218 | 4252.98 | 855 | 837 | 179.3 |
| B | 5 | 235 | 599635 | 3623.5 | 847 | 820 | 165.3 |
| B | 12 | 3 | 90881 | 544.97 | 847 | 820 | 165.3 |
| B | 4 | 171 | 69529 | 415.77 | 847 | 820 | 165.3 |
| C | 15 | 158 | 1661281 | 8385.21 | 839 | 843 | 198.0 |
| C | 15 | 157 | 232848 | 1171.63 | 839 | 843 | 198.0 |
| C | 3 | 233 | 150913 | 757.85 | 839 | 843 | 198.0 |
| D | 1 | 52 | 1283374 | 5772.95 | 805 | 787 | 222.2 |
| D | 5 | 235 | 890662 | 4005.35 | 805 | 787 | 222.2 |
| D | 14 | 210 | 315110 | 1414.77 | 805 | 787 | 222.2 |
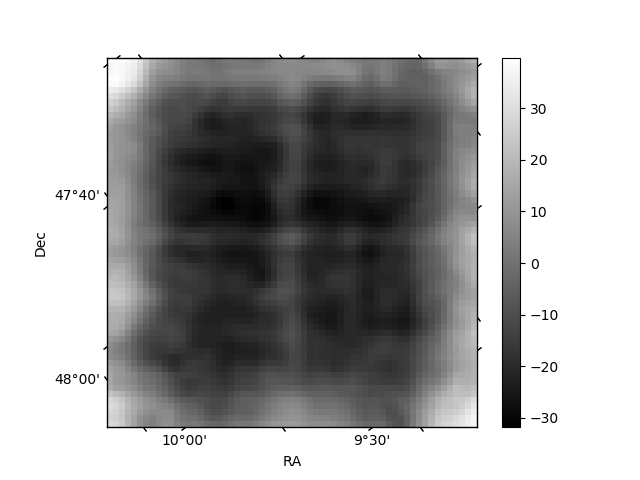
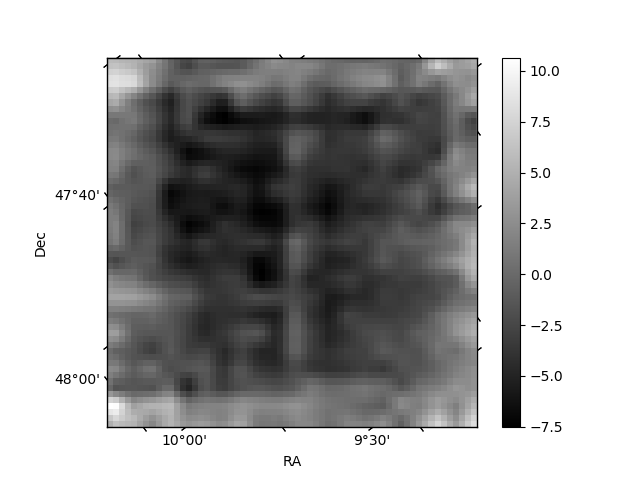
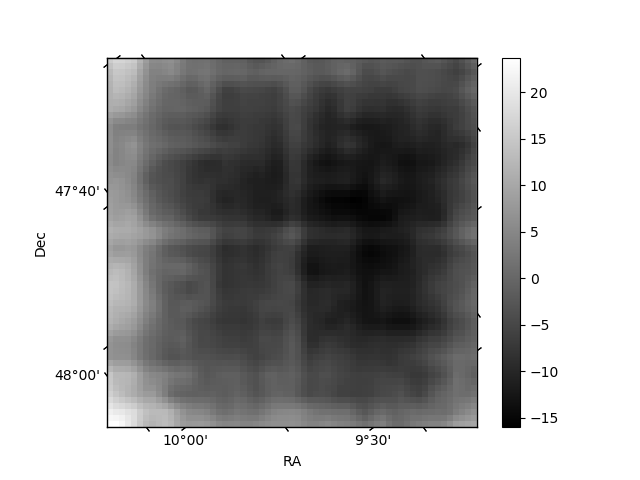
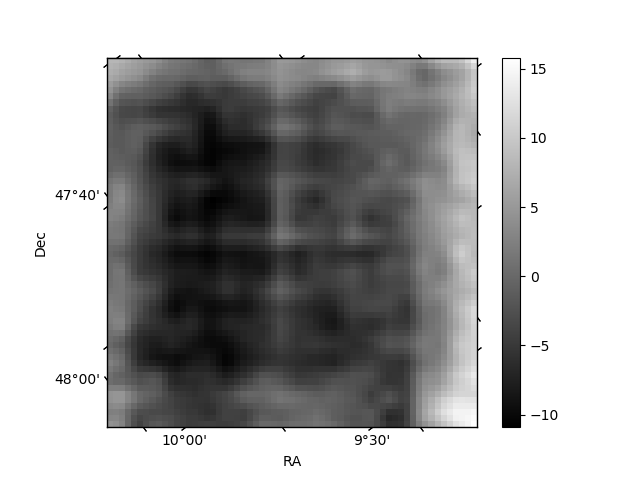
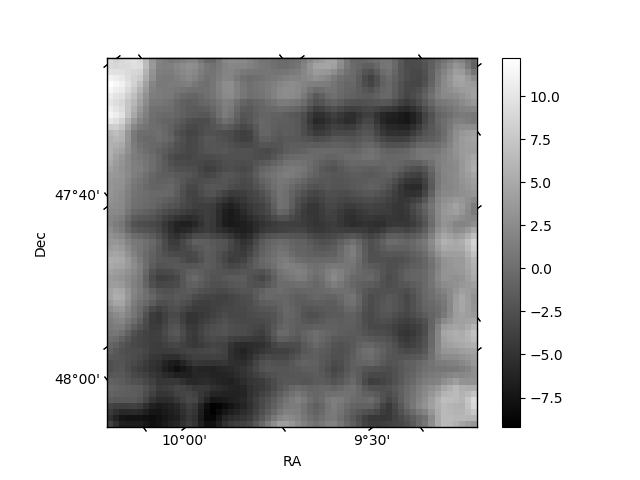
Histogram calculated using DETX and DETY for each event in the final _common_clean file
| Quadrant A | 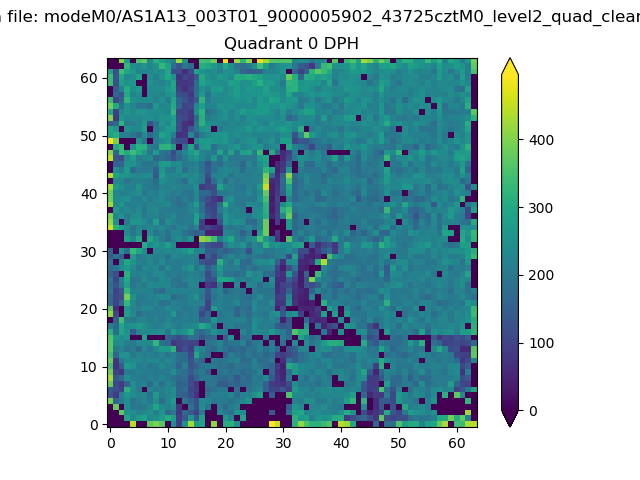 |
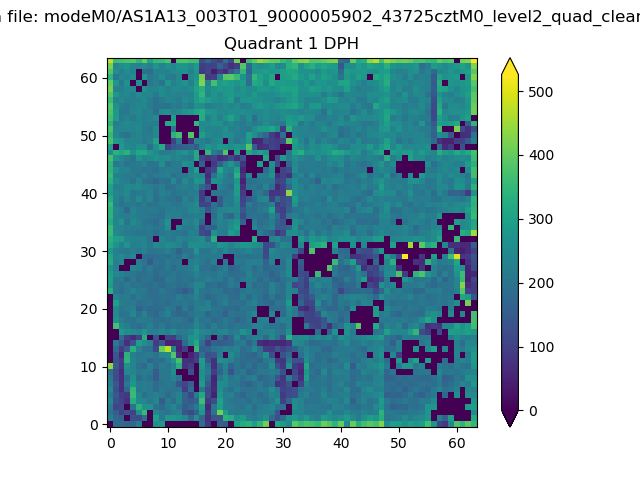 |
Quadrant B |
|---|---|---|---|
| Quadrant D | 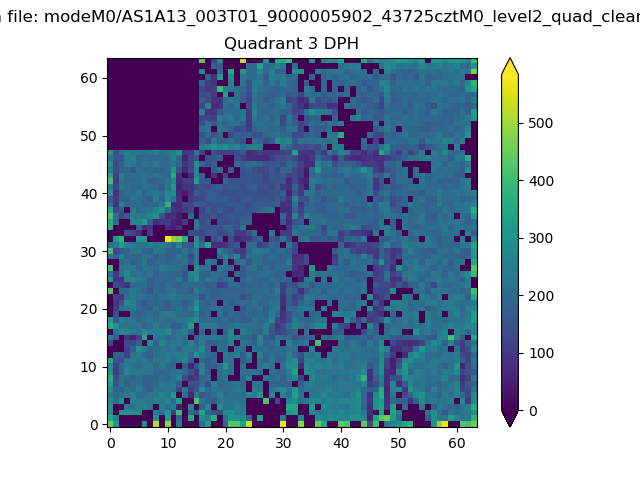 |
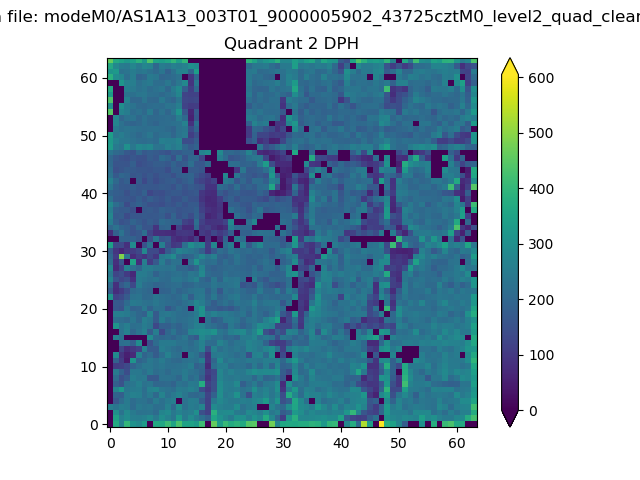 |
Quadrant C |
| Plot type | Count rate plots | Images |
|---|---|---|
| Comparison with Poisson distribution Blue bars denote a histogram of data divided into 1 sec bins. Red curve is a Poisson curve with rate = median count rate of data. |
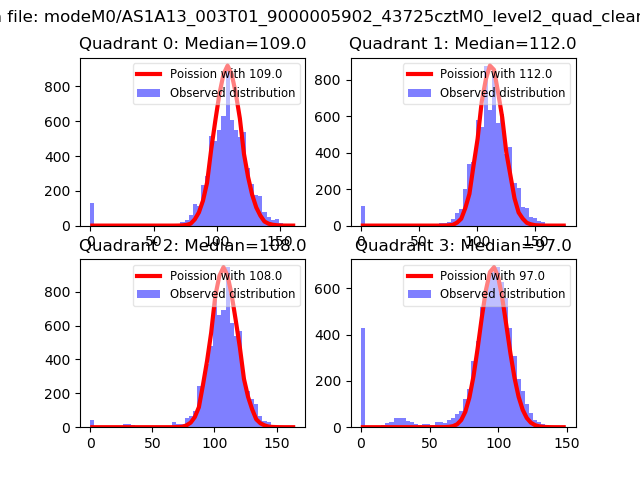 |
 |
| Quadrant-wise count rates Data is divided into 100 sec bins |
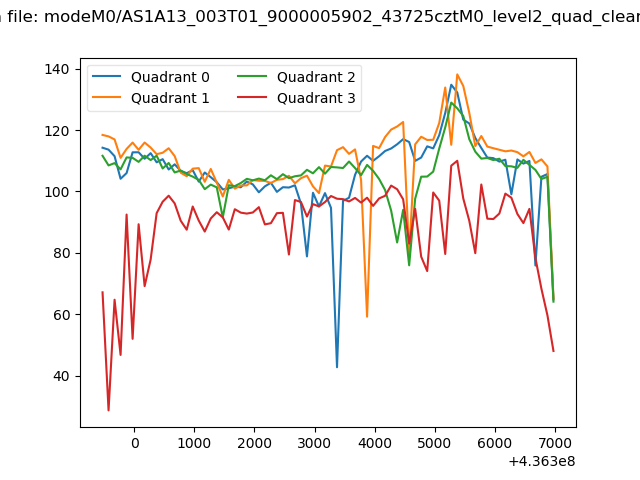 |
|
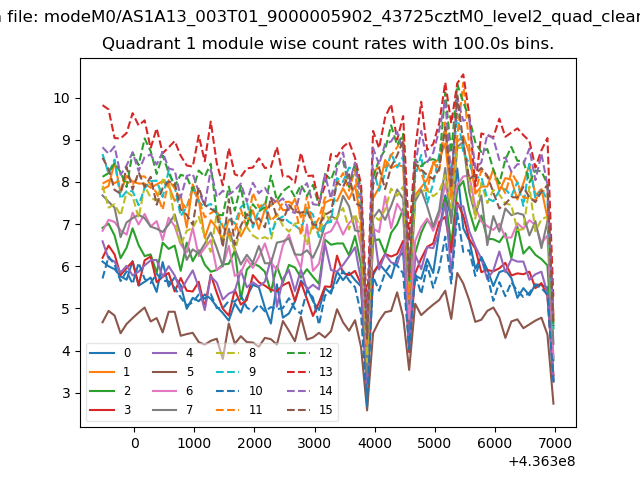
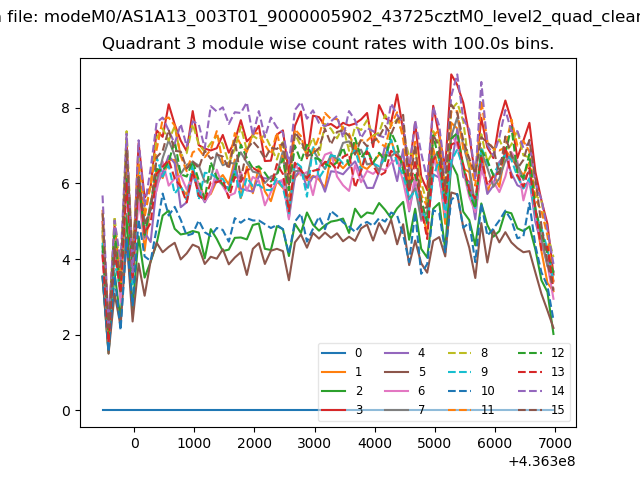
| Module-wise count rates for Quadrant A Data is divided into 100 sec bins |
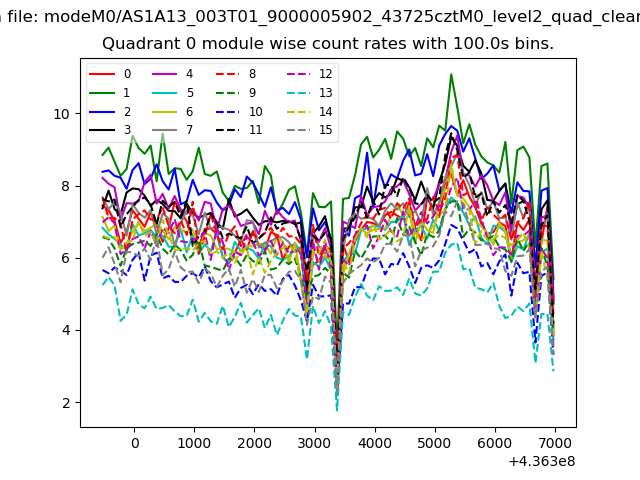 |
 |
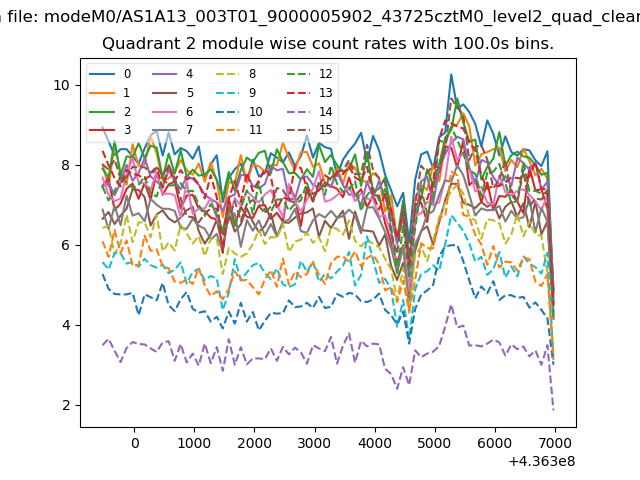
| Module-wise count rates for Quadrant B Data is divided into 100 sec bins |
 |
 |
| Module-wise count rates for Quadrant C Data is divided into 100 sec bins |
 |
 |
| Module-wise count rates for Quadrant D Data is divided into 100 sec bins |
 |
 |
| Parameter | Plot |
|---|---|
| CZT HV Monitor | 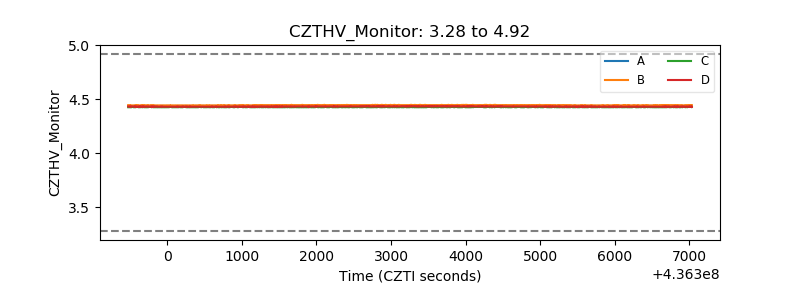 |
| D_VDD | 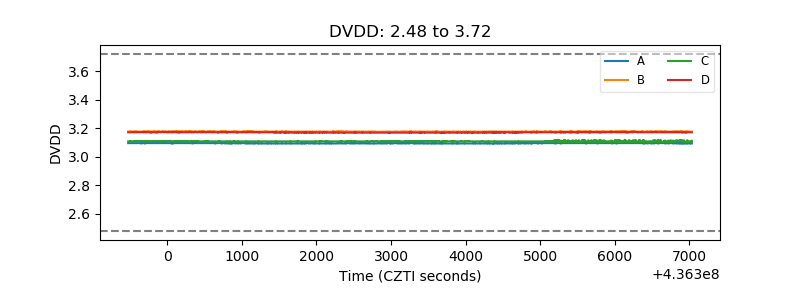 |
| Temperature 1 | 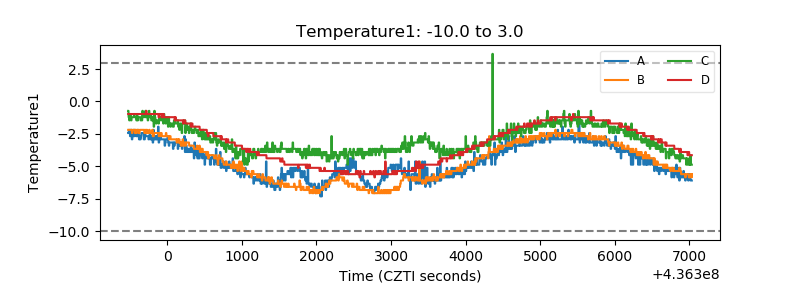 |
| Veto HV Monitor | 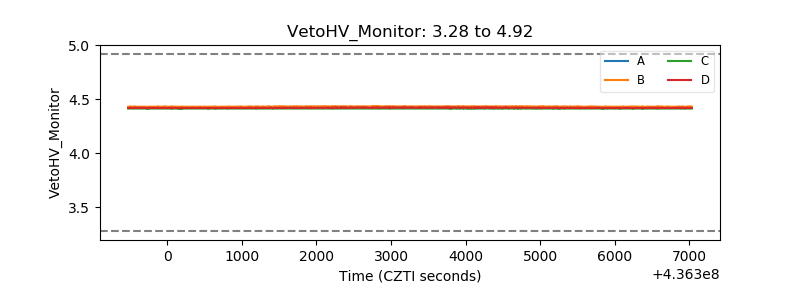 |
| Veto LLD | 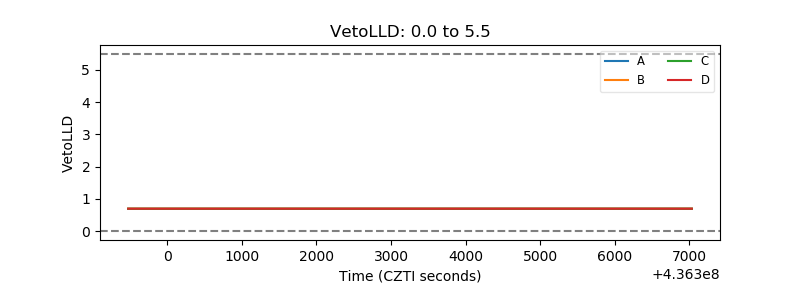 |
| Alpha Counter | 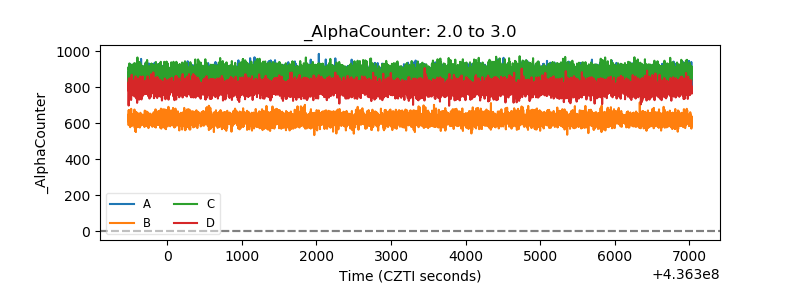 |
| _CPM_Rate | 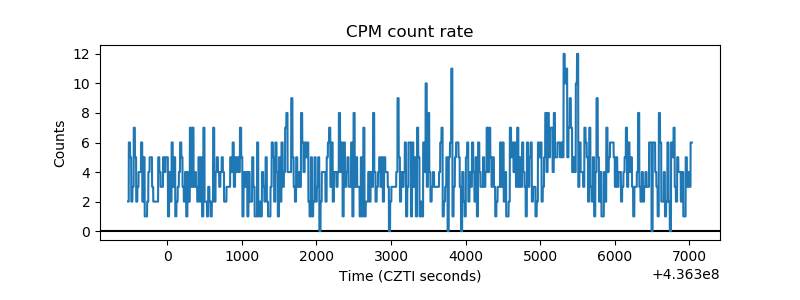 |
| CZT Counter | 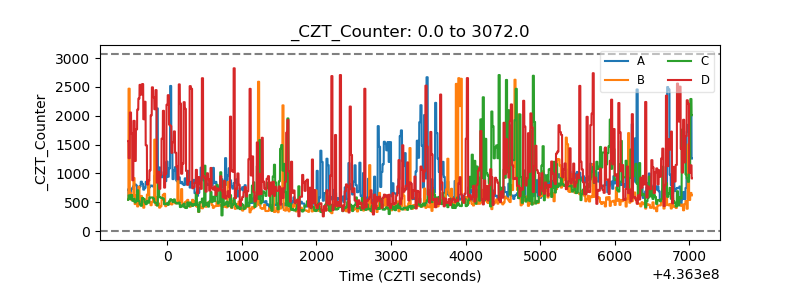 |
| +2.5 Volts monitor | 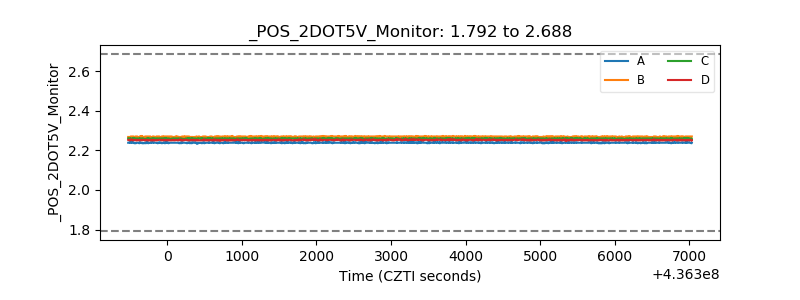 |
| +5 Volts monitor | 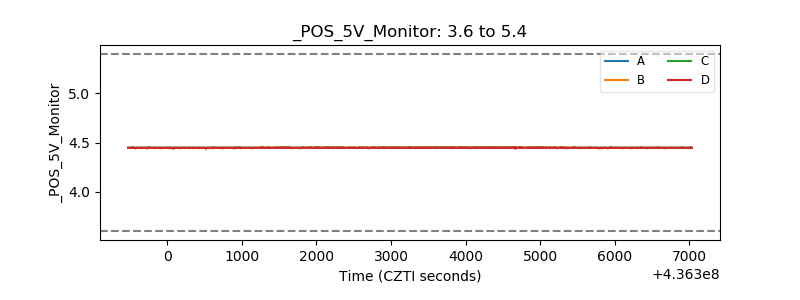 |
| _ROLL_ROT |  |
| _Roll_DEC | 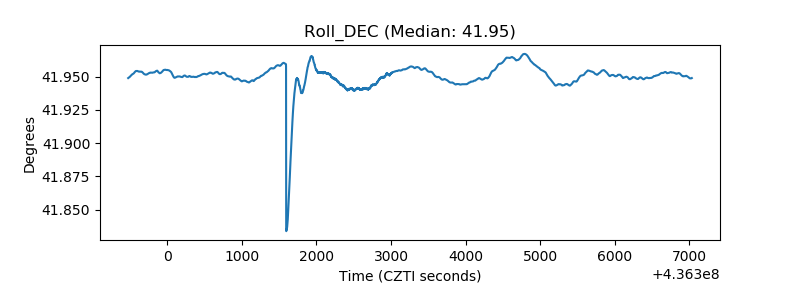 |
| _Roll_RA | 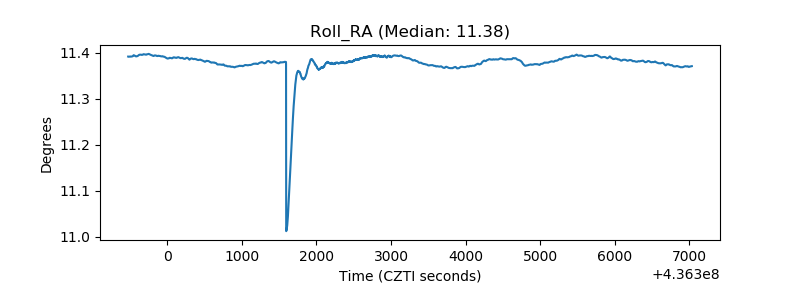 |
| Veto Counter | 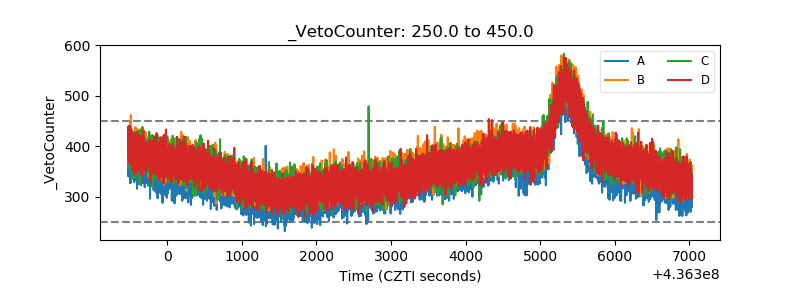 |