| Param | Original file | Final file |
|---|---|---|
| Filename | modeM0/AS1A13_003T01_9000005902_43729cztM0_level2.fits | modeM0/AS1A13_003T01_9000005902_43729cztM0_level2_quad_clean.evt |
| Size (bytes) | 1,673,141,760 | 287,343,360 |
| Size | 1.6 GB | 274.0 MB |
| Events in quadrant A | 13,076,690 | 2,001,110 |
| Events in quadrant B | 10,829,279 | 2,063,212 |
| Events in quadrant C | 18,499,034 | 1,645,606 |
| Events in quadrant D | 18,051,252 | 1,669,523 |
| Mode SS | |||
|---|---|---|---|
| Quadrant | BADHDUFLAG | Total packets | Discarded packets |
| A | 0 | 390 | 0 |
| B | 0 | 390 | 0 |
| C | 0 | 390 | 0 |
| D | 0 | 390 | 0 |
| Mode M0 | |||
|---|---|---|---|
| Quadrant | BADHDUFLAG | Total packets | Discarded packets |
| A | 0 | 51179 | 4 |
| B | 0 | 45675 | 3 |
| C | 0 | 67994 | 3 |
| D | 0 | 66944 | 3 |
| Mode M9 | |||
|---|---|---|---|
| Quadrant | BADHDUFLAG | Total packets | Discarded packets |
| A | 0 | 17 | 0 |
| B | 0 | 17 | 0 |
| C | 0 | 17 | 0 |
| D | 0 | 17 | 0 |
| Quadrant | Total seconds | Saturated seconds | Saturation percentage |
|---|---|---|---|
| A | 19147 | 524 | 2.736721% |
| B | 19148 | 625 | 3.264048% |
| C | 19148 | 3359 | 17.542302% |
| D | 19148 | 1982 | 10.350950% |
Noise dominated data is calculated using 1-second bins in cleaned event files. If a bin has >2000 counts, and if more than 50% of those come from <1% of pixels, then it is considered to be noise-dominated and hence unusable.
| Quadrant | # 1 sec bins | Bins with >0 counts | Bins with >2000 counts | High rate bins dominated by noise | Noise dominated (total time) | Noise dominated (detector-on time) | Marked lightcurve |
|---|---|---|---|---|---|---|---|
| A | 20902 | 19150 | 265 | 265 | 1.27% | 1.38% | 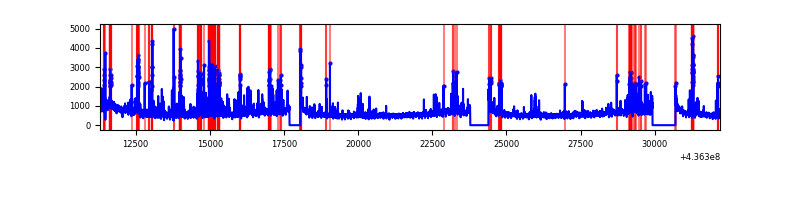 |
| B | 20903 | 19151 | 320 | 320 | 1.53% | 1.67% | 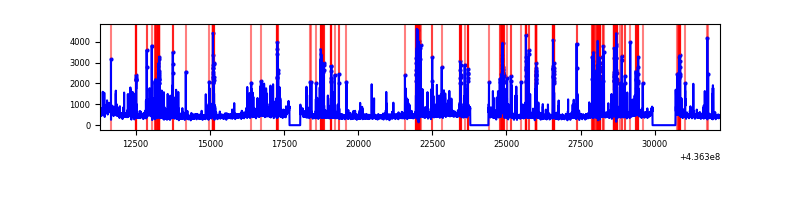 |
| C | 20903 | 19149 | 2254 | 2254 | 10.78% | 11.77% | 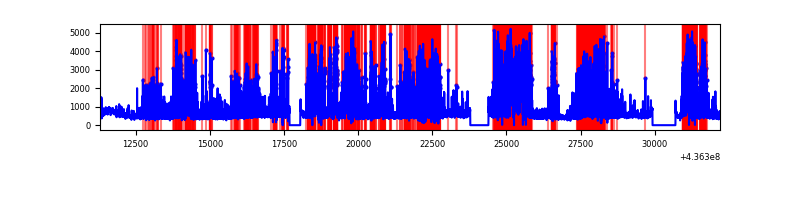 |
| D | 20903 | 19151 | 1423 | 1423 | 6.81% | 7.43% | 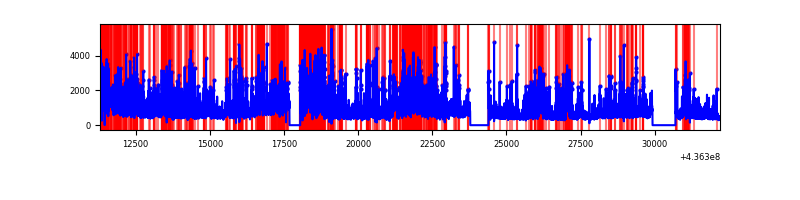 |
Top three noisy pixels from each quadrant. If the there are fewer than three noisy pixels in the level2.evt file, extra rows are filled as -1
| Pixel properties | Quadrant properties | ||||||
|---|---|---|---|---|---|---|---|
| Quadrant | DetID | PixID | Counts | Sigma | Mean | Median | Sigma |
| A | 10 | 83 | 2313157 | 5247.76 | 2138 | 2096 | 440.4 |
| A | 14 | 63 | 1003019 | 2272.81 | 2138 | 2096 | 440.4 |
| A | 15 | 223 | 645859 | 1461.8 | 2138 | 2096 | 440.4 |
| B | 5 | 235 | 1639516 | 3964.14 | 2132 | 2062 | 413.1 |
| B | 5 | 172 | 325054 | 781.94 | 2132 | 2062 | 413.1 |
| B | 4 | 80 | 108655 | 258.05 | 2132 | 2062 | 413.1 |
| C | 15 | 157 | 7326278 | 15923.92 | 1933 | 1945 | 460.0 |
| C | 15 | 158 | 1902503 | 4132.03 | 1933 | 1945 | 460.0 |
| C | 14 | 254 | 504150 | 1091.85 | 1933 | 1945 | 460.0 |
| D | 1 | 52 | 1961836 | 3733.7 | 2044 | 1977 | 524.9 |
| D | 7 | 80 | 1417637 | 2696.95 | 2044 | 1977 | 524.9 |
| D | 8 | 48 | 1032318 | 1962.89 | 2044 | 1977 | 524.9 |
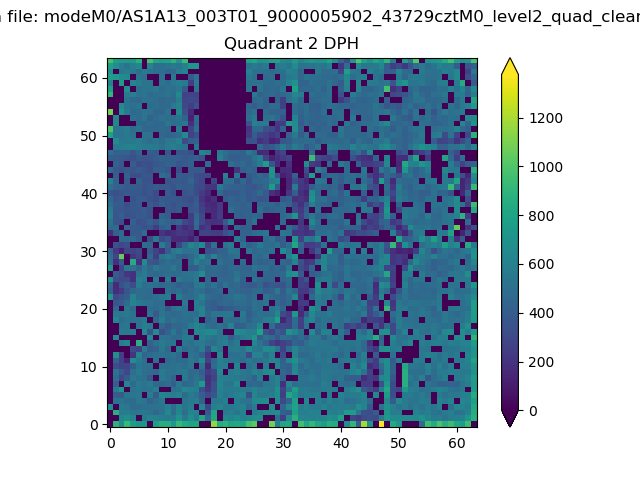
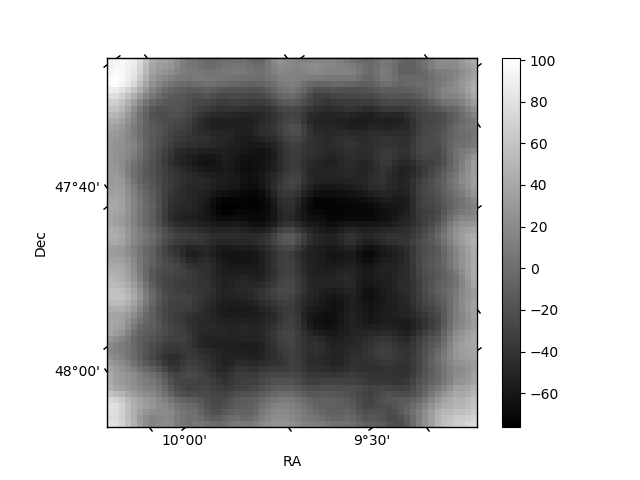
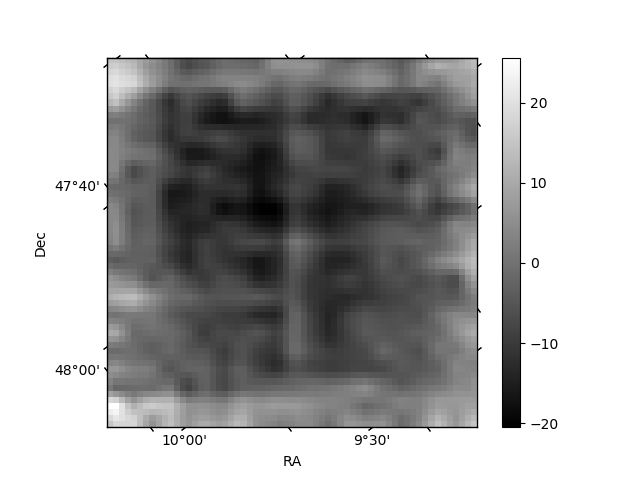
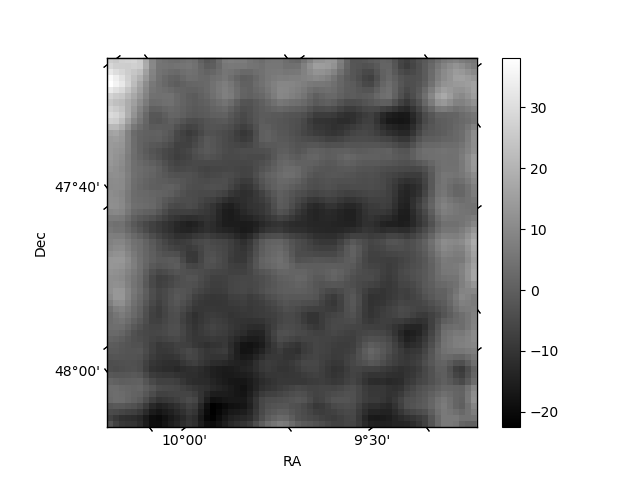
Histogram calculated using DETX and DETY for each event in the final _common_clean file
| Quadrant A | 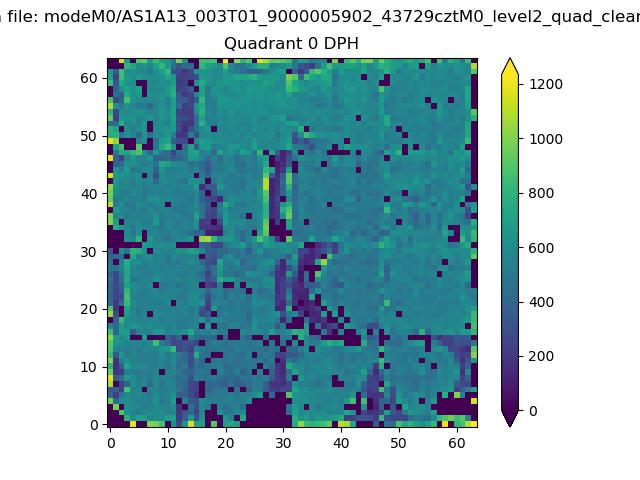 |
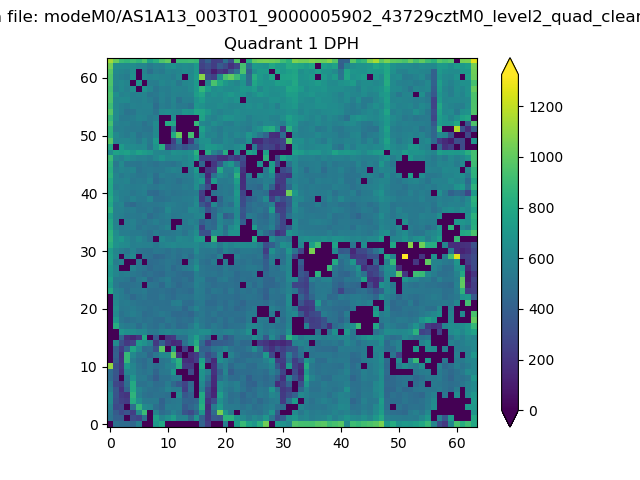 |
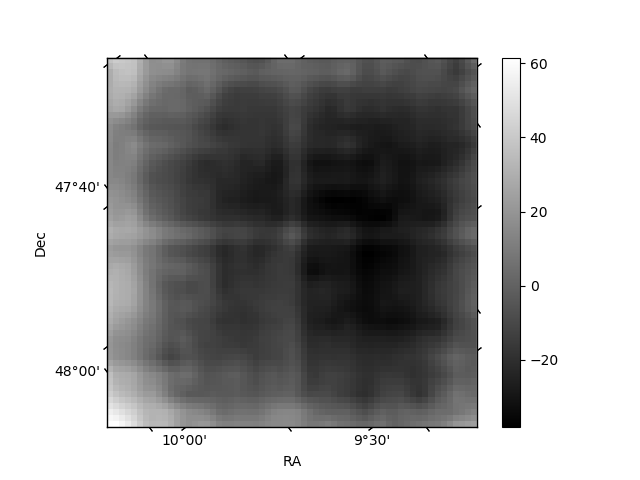
Quadrant B |
|---|---|---|---|
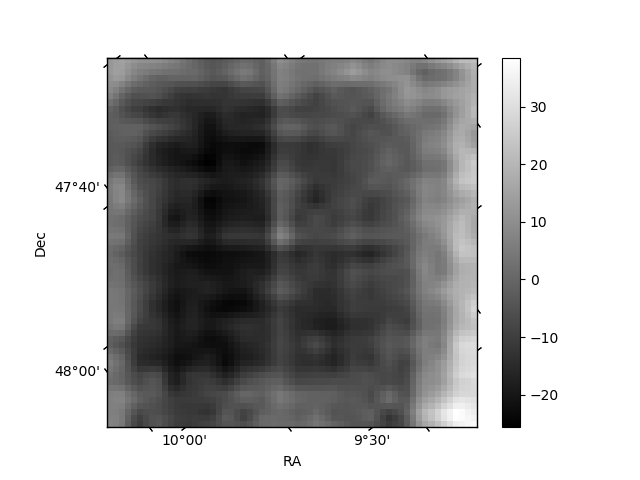
| Quadrant D | 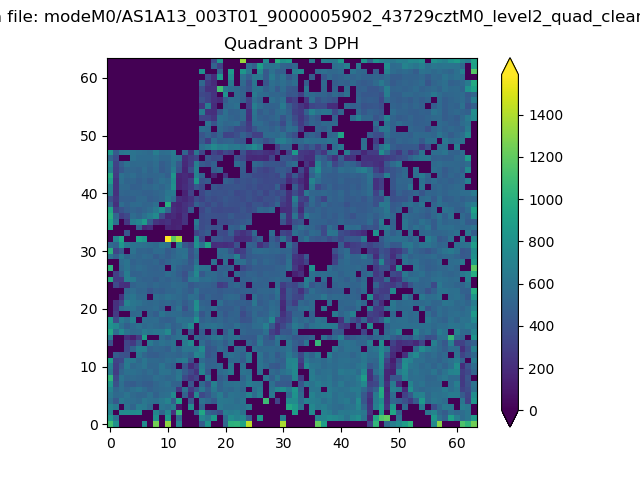 |
 |
Quadrant C |
| Plot type | Count rate plots | Images |
|---|---|---|
| Comparison with Poisson distribution Blue bars denote a histogram of data divided into 1 sec bins. Red curve is a Poisson curve with rate = median count rate of data. |
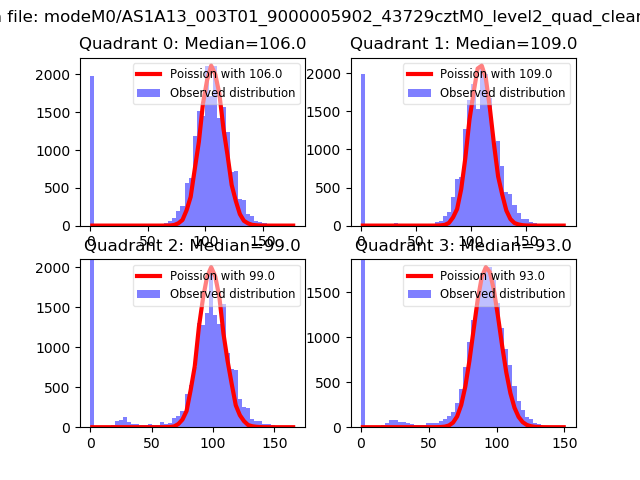 |
 |
| Quadrant-wise count rates Data is divided into 100 sec bins |
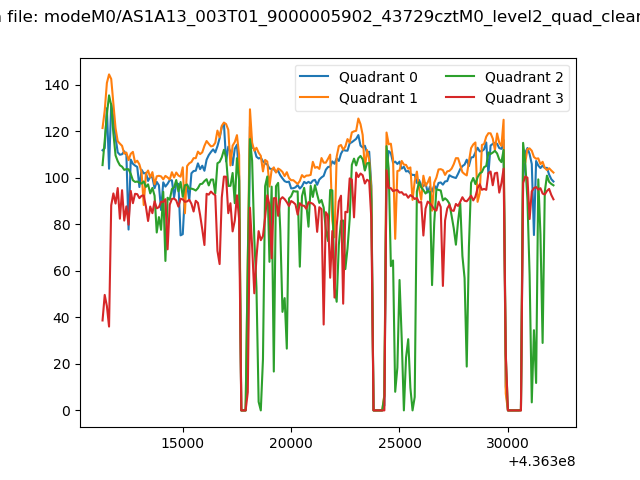 |
|
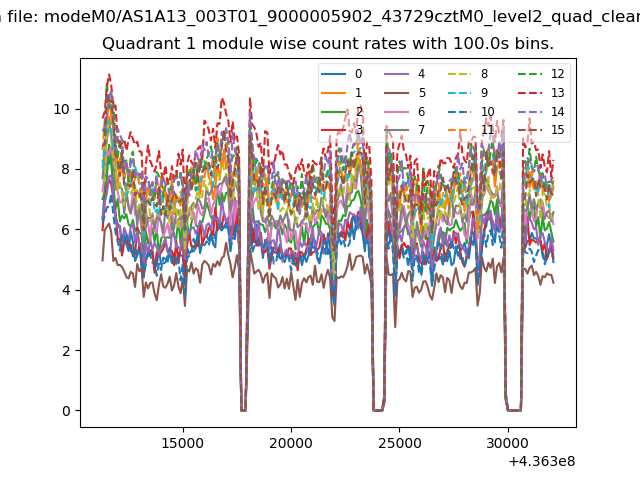
| Module-wise count rates for Quadrant A Data is divided into 100 sec bins |
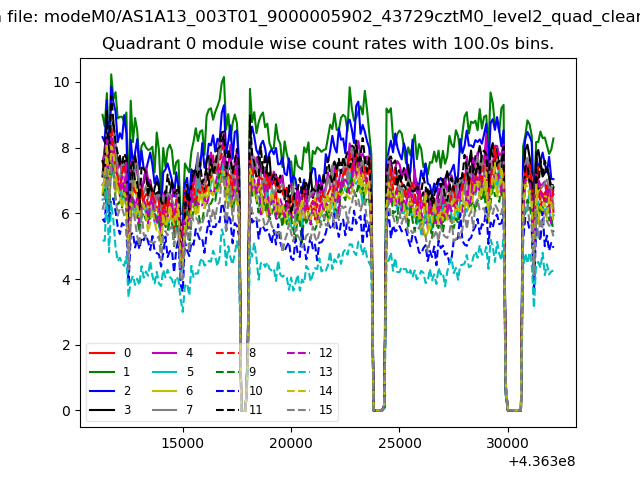 |
 |
| Module-wise count rates for Quadrant B Data is divided into 100 sec bins |
 |
 |
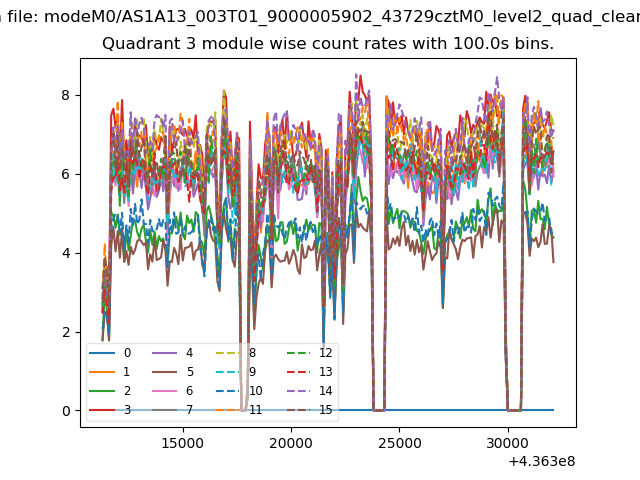
| Module-wise count rates for Quadrant C Data is divided into 100 sec bins |
 |
 |
| Module-wise count rates for Quadrant D Data is divided into 100 sec bins |
 |
 |
| Parameter | Plot |
|---|---|
| CZT HV Monitor | 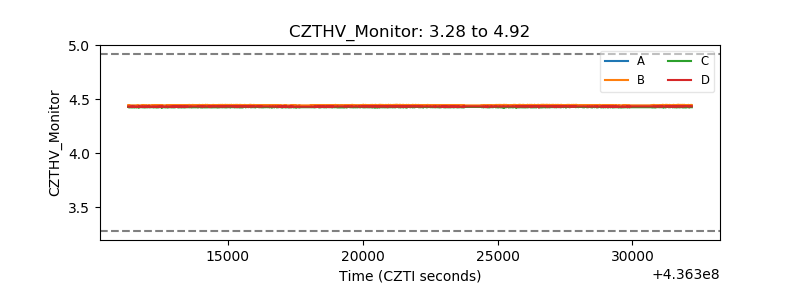 |
| D_VDD | 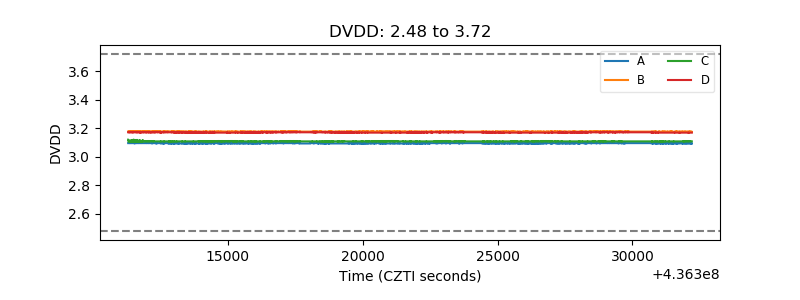 |
| Temperature 1 | 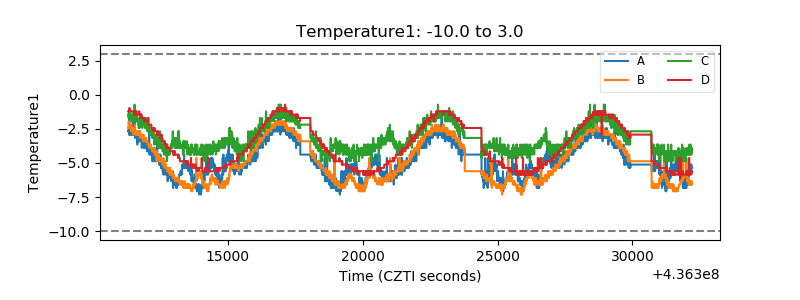 |
| Veto HV Monitor | 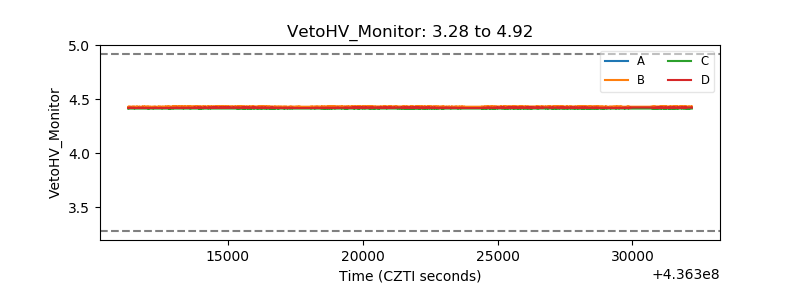 |
| Veto LLD | 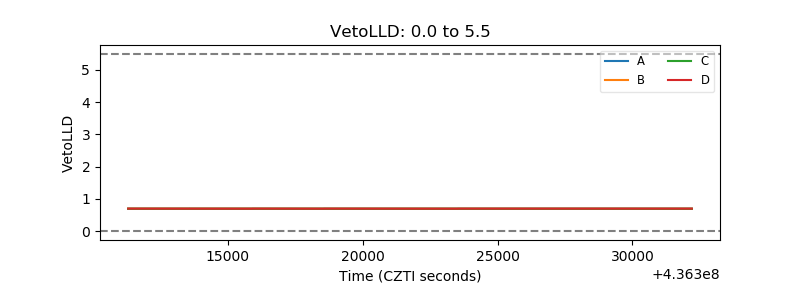 |
| Alpha Counter | 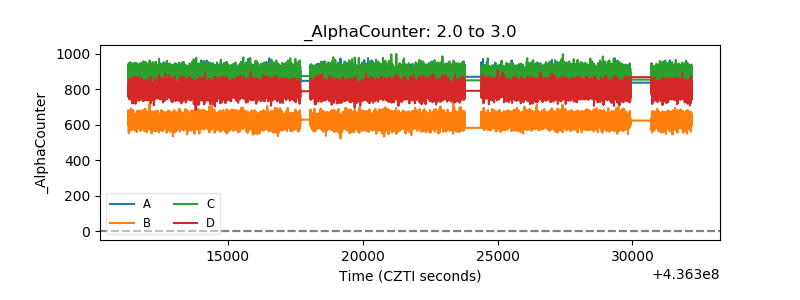 |
| _CPM_Rate | 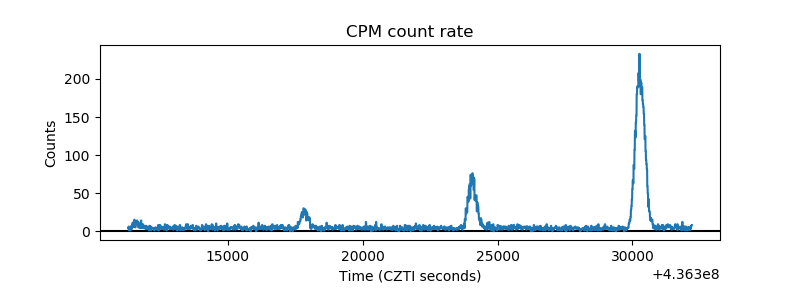 |
| CZT Counter | 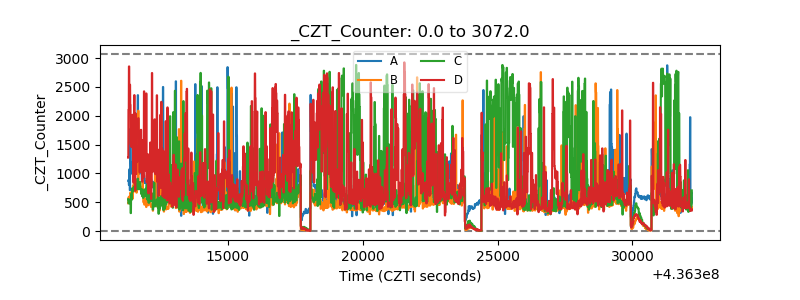 |
| +2.5 Volts monitor | 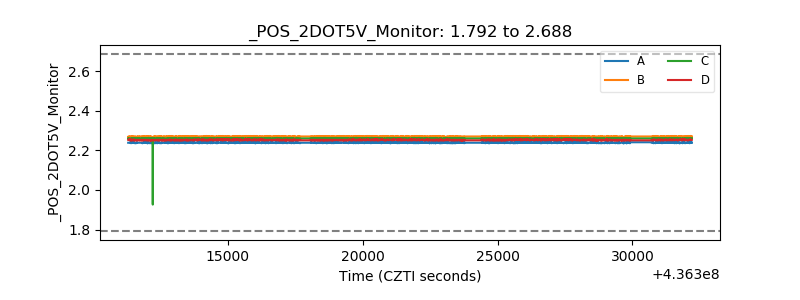 |
| +5 Volts monitor | 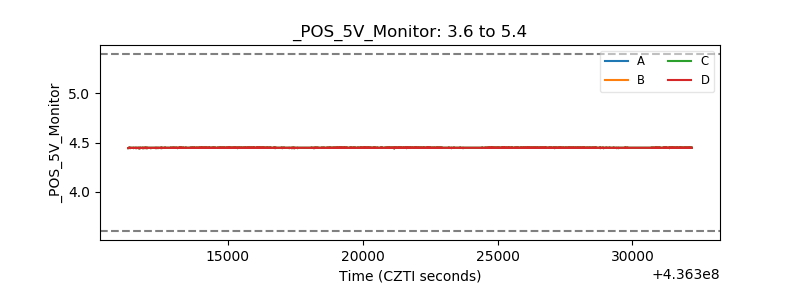 |
| _ROLL_ROT | 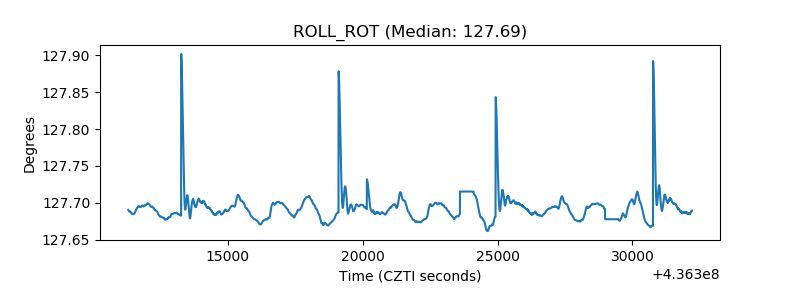 |
| _Roll_DEC | 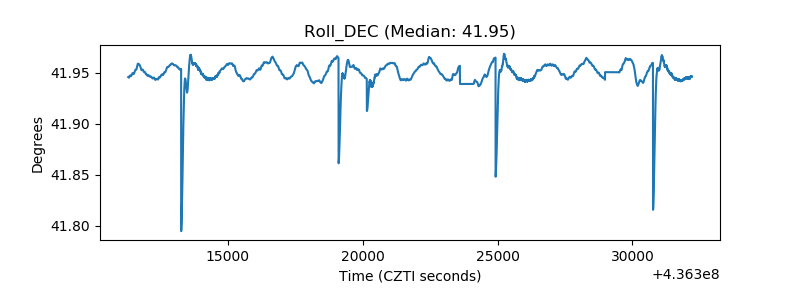 |
| _Roll_RA | 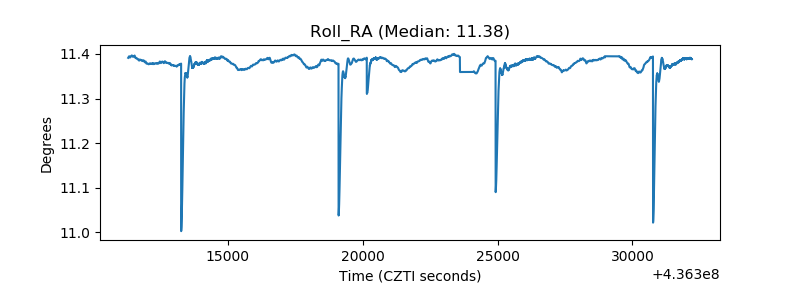 |
| Veto Counter | 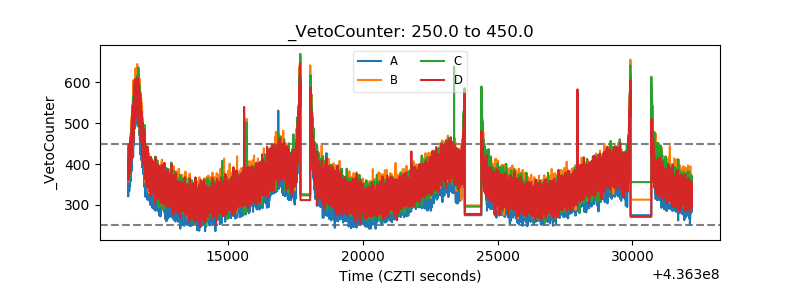 |