| Param | Original file | Final file |
|---|---|---|
| Filename | modeM0/AS1A13_003T01_9000005902_43730cztM0_level2.fits | modeM0/AS1A13_003T01_9000005902_43730cztM0_level2_quad_clean.evt |
| Size (bytes) | 563,126,400 | 111,781,440 |
| Size | 537.0 MB | 106.6 MB |
| Events in quadrant A | 5,264,871 | 744,770 |
| Events in quadrant B | 4,394,326 | 764,205 |
| Events in quadrant C | 5,775,803 | 697,153 |
| Events in quadrant D | 4,857,130 | 682,890 |
| Mode SS | |||
|---|---|---|---|
| Quadrant | BADHDUFLAG | Total packets | Discarded packets |
| A | 0 | 144 | 0 |
| B | 0 | 144 | 0 |
| C | 0 | 144 | 0 |
| D | 0 | 144 | 0 |
| Mode M0 | |||
|---|---|---|---|
| Quadrant | BADHDUFLAG | Total packets | Discarded packets |
| A | 0 | 20395 | 2 |
| B | 0 | 17949 | 2 |
| C | 0 | 22002 | 2 |
| D | 0 | 19464 | 2 |
| Mode M9 | |||
|---|---|---|---|
| Quadrant | BADHDUFLAG | Total packets | Discarded packets |
| A | 0 | 18 | 0 |
| B | 0 | 18 | 0 |
| C | 0 | 18 | 0 |
| D | 0 | 18 | 0 |
| Quadrant | Total seconds | Saturated seconds | Saturation percentage |
|---|---|---|---|
| A | 7123 | 330 | 4.632879% |
| B | 7124 | 378 | 5.306008% |
| C | 7123 | 849 | 11.919135% |
| D | 7123 | 313 | 4.394216% |
Noise dominated data is calculated using 1-second bins in cleaned event files. If a bin has >2000 counts, and if more than 50% of those come from <1% of pixels, then it is considered to be noise-dominated and hence unusable.
| Quadrant | # 1 sec bins | Bins with >0 counts | Bins with >2000 counts | High rate bins dominated by noise | Noise dominated (total time) | Noise dominated (detector-on time) | Marked lightcurve |
|---|---|---|---|---|---|---|---|
| A | 8838 | 7125 | 206 | 206 | 2.33% | 2.89% | 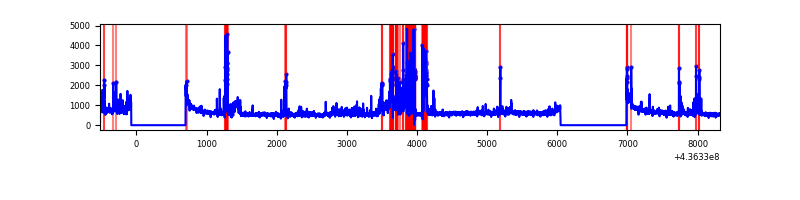 |
| B | 8839 | 7126 | 175 | 175 | 1.98% | 2.46% | 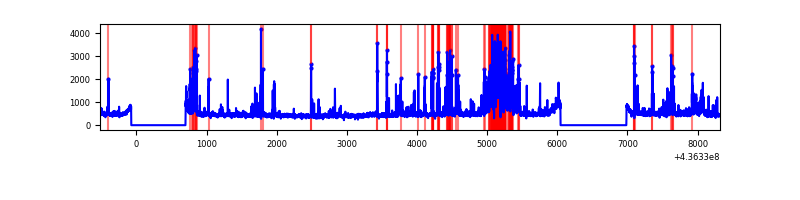 |
| C | 8838 | 7125 | 638 | 638 | 7.22% | 8.95% | 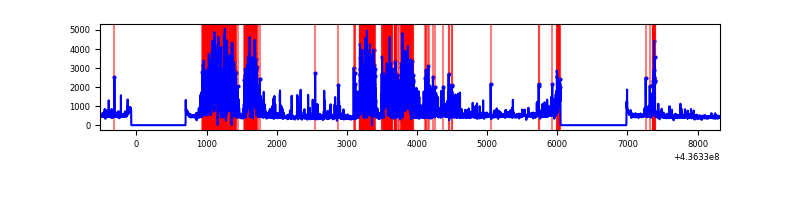 |
| D | 8838 | 7125 | 230 | 230 | 2.60% | 3.23% | 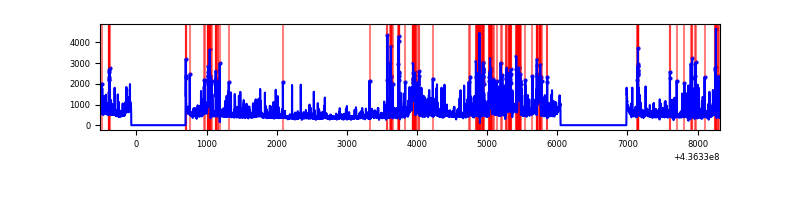 |
Top three noisy pixels from each quadrant. If the there are fewer than three noisy pixels in the level2.evt file, extra rows are filled as -1
| Pixel properties | Quadrant properties | ||||||
|---|---|---|---|---|---|---|---|
| Quadrant | DetID | PixID | Counts | Sigma | Mean | Median | Sigma |
| A | 10 | 83 | 974531 | 5916.65 | 794 | 777 | 164.6 |
| A | 15 | 174 | 633247 | 3842.97 | 794 | 777 | 164.6 |
| A | 15 | 223 | 367146 | 2226.1 | 794 | 777 | 164.6 |
| B | 12 | 3 | 546568 | 3491.06 | 797 | 771 | 156.3 |
| B | 5 | 235 | 511235 | 3265.06 | 797 | 771 | 156.3 |
| B | 5 | 172 | 99479 | 631.36 | 797 | 771 | 156.3 |
| C | 15 | 157 | 1935825 | 10806.6 | 755 | 761 | 179.1 |
| C | 15 | 158 | 396272 | 2208.78 | 755 | 761 | 179.1 |
| C | 15 | 174 | 379423 | 2114.68 | 755 | 761 | 179.1 |
| D | 5 | 235 | 241635 | 1216.23 | 782 | 757 | 198.1 |
| D | 7 | 80 | 236585 | 1190.73 | 782 | 757 | 198.1 |
| D | 13 | 249 | 229011 | 1152.49 | 782 | 757 | 198.1 |
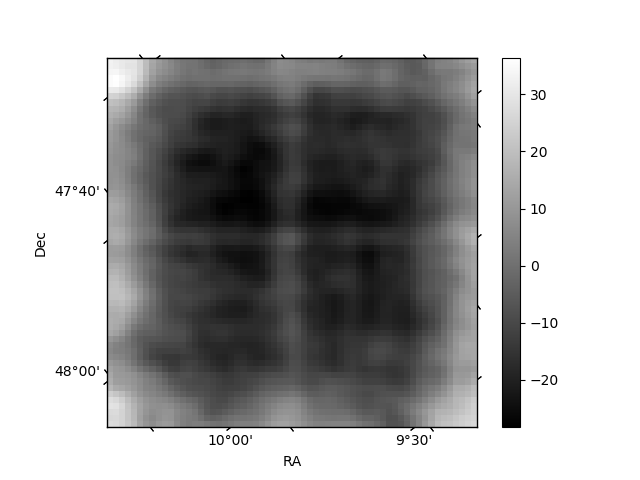
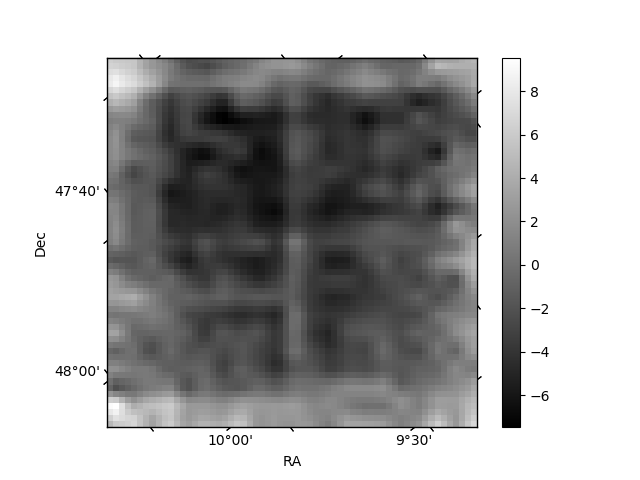
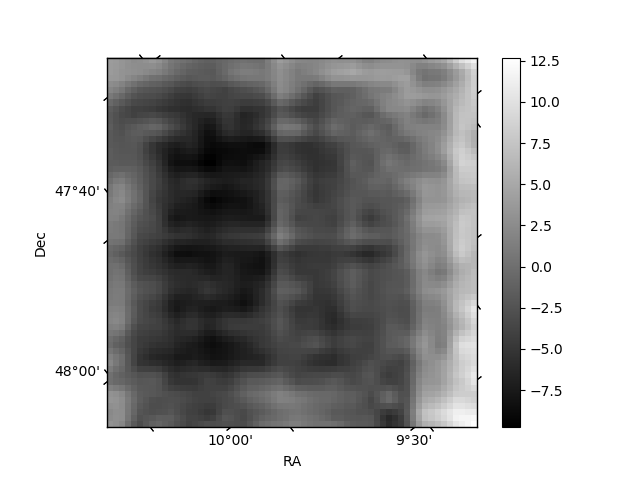
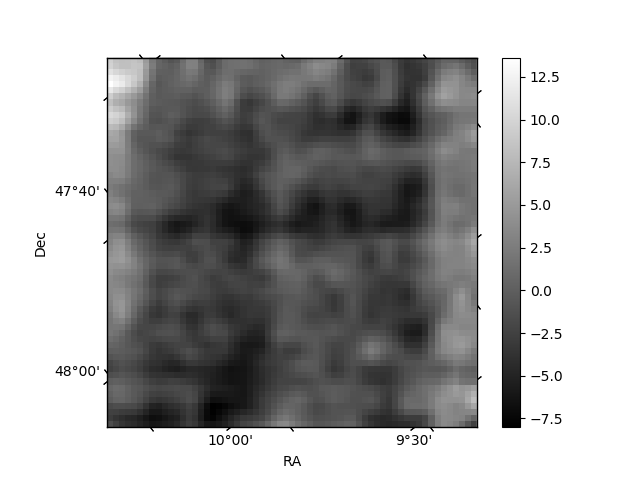
Histogram calculated using DETX and DETY for each event in the final _common_clean file
| Quadrant A | 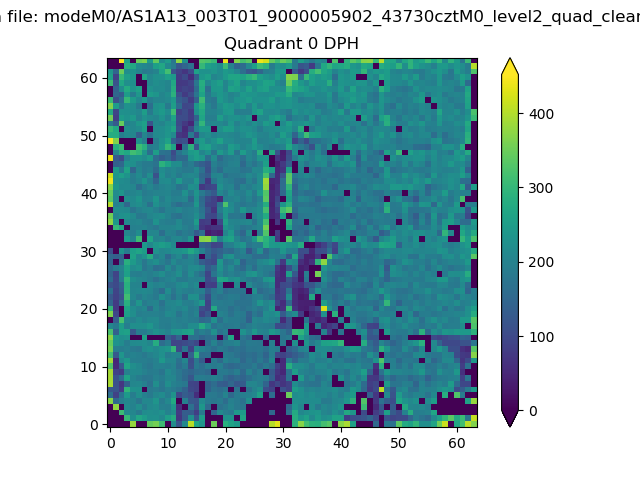 |
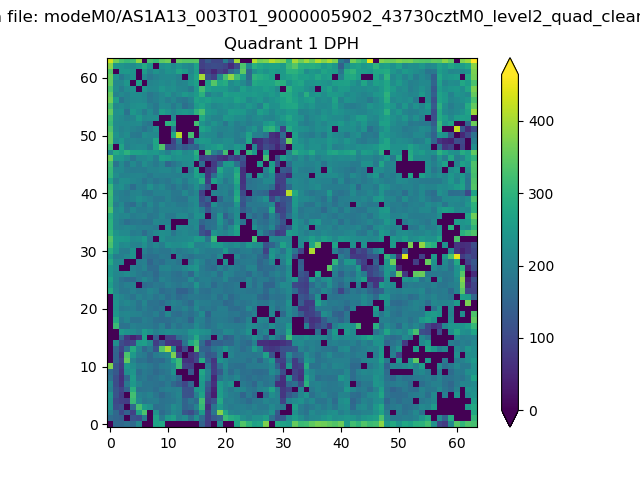 |
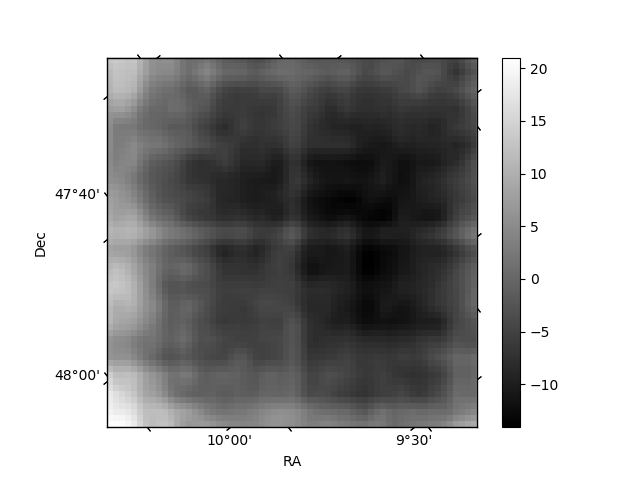
Quadrant B |
|---|---|---|---|
| Quadrant D | 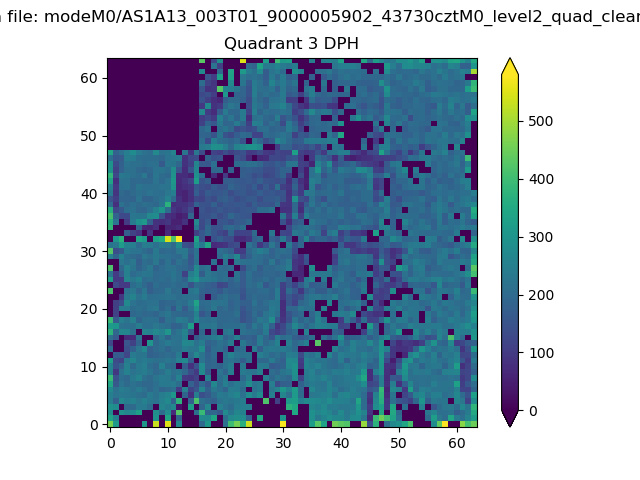 |
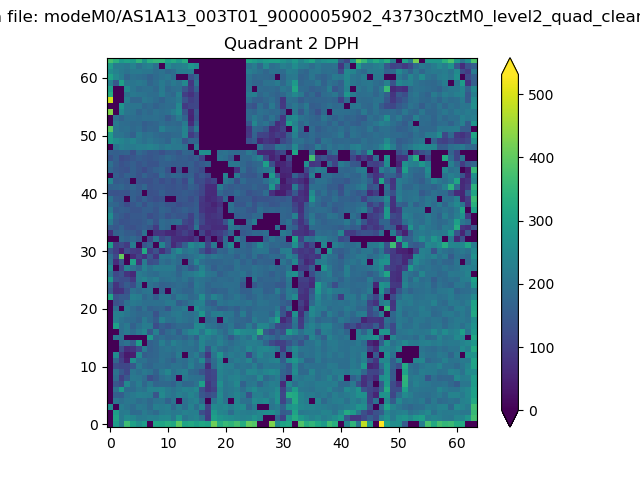 |
Quadrant C |
| Plot type | Count rate plots | Images |
|---|---|---|
| Comparison with Poisson distribution Blue bars denote a histogram of data divided into 1 sec bins. Red curve is a Poisson curve with rate = median count rate of data. |
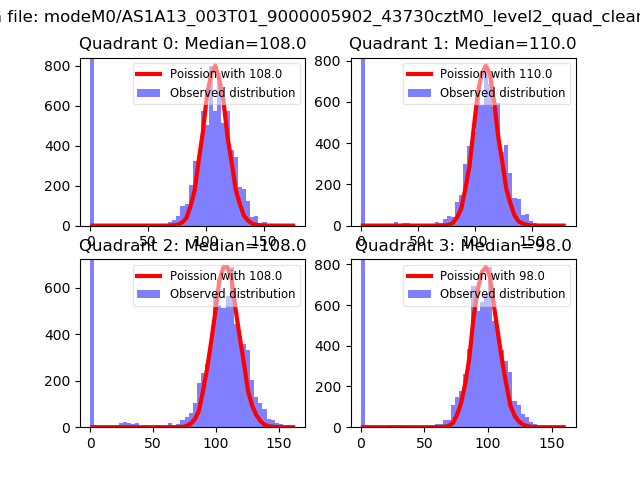 |
 |
| Quadrant-wise count rates Data is divided into 100 sec bins |
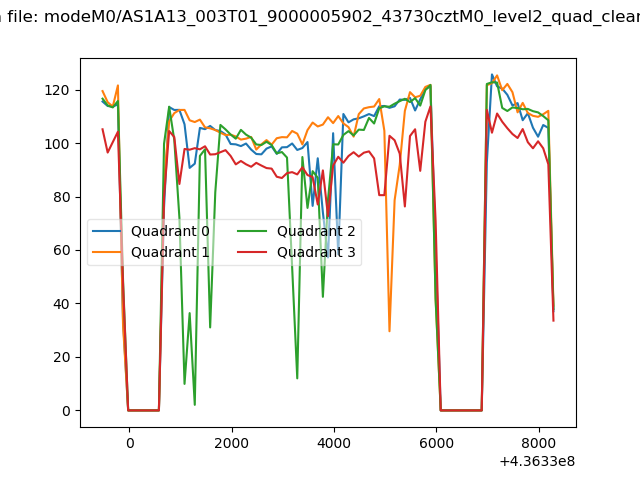 |
|
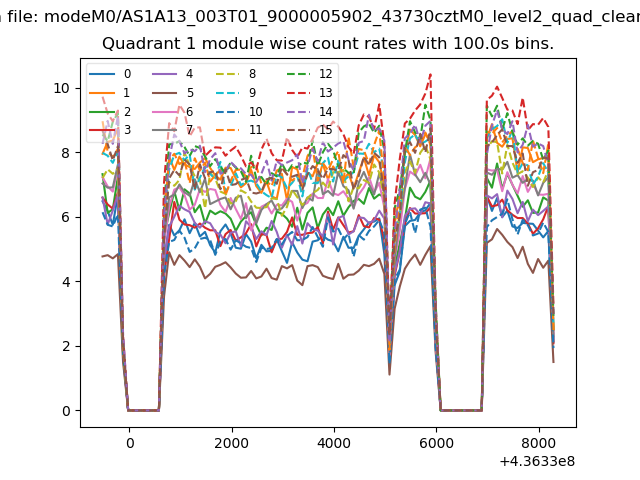
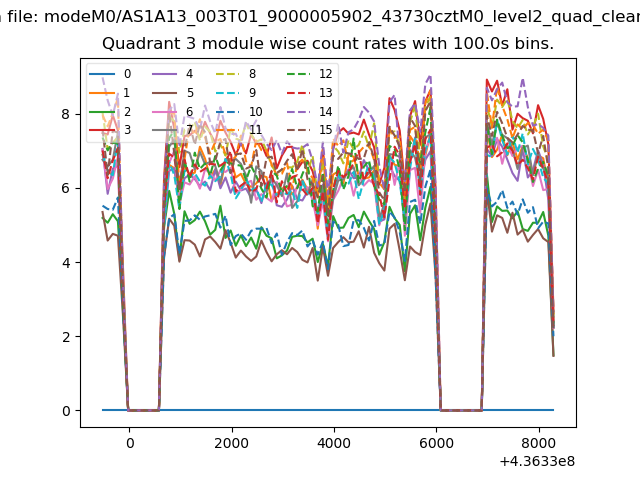
| Module-wise count rates for Quadrant A Data is divided into 100 sec bins |
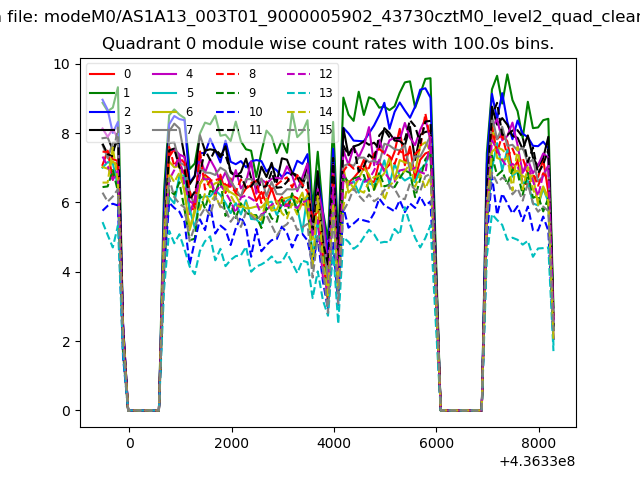 |
 |
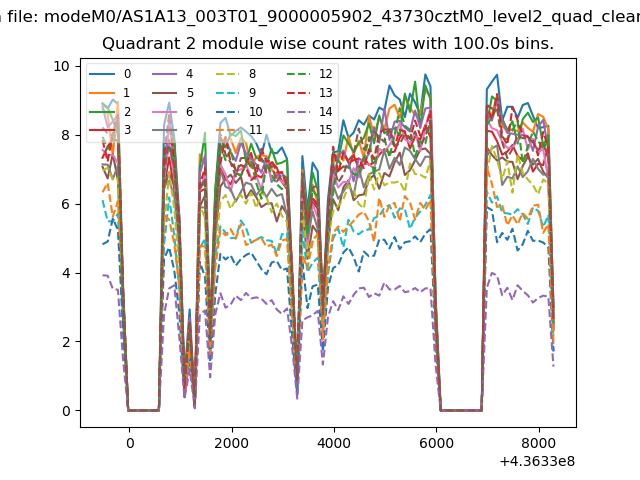
| Module-wise count rates for Quadrant B Data is divided into 100 sec bins |
 |
 |
| Module-wise count rates for Quadrant C Data is divided into 100 sec bins |
 |
 |
| Module-wise count rates for Quadrant D Data is divided into 100 sec bins |
 |
 |
| Parameter | Plot |
|---|---|
| CZT HV Monitor |  |
| D_VDD | 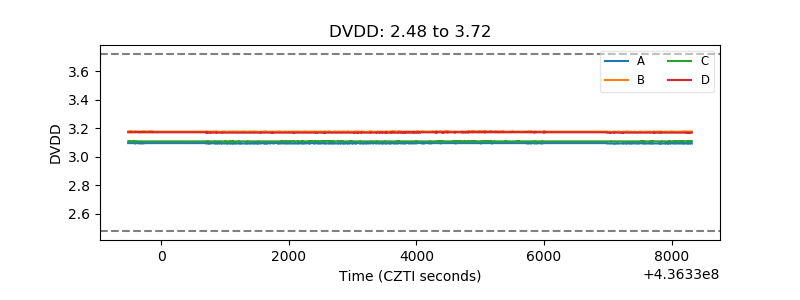 |
| Temperature 1 | 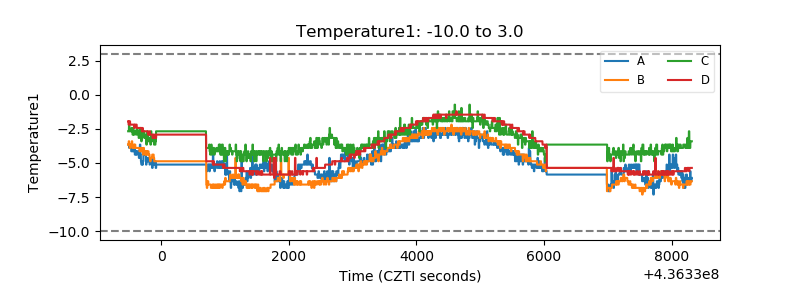 |
| Veto HV Monitor | 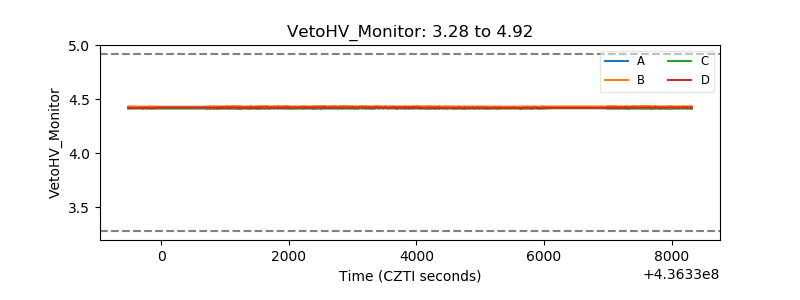 |
| Veto LLD | 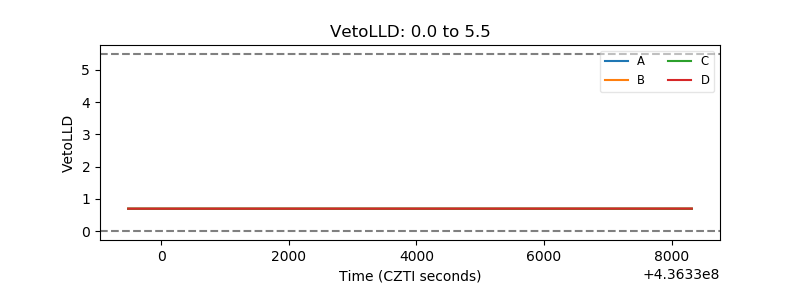 |
| Alpha Counter | 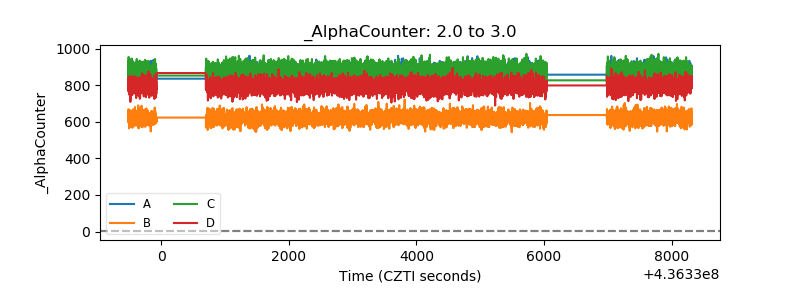 |
| _CPM_Rate | 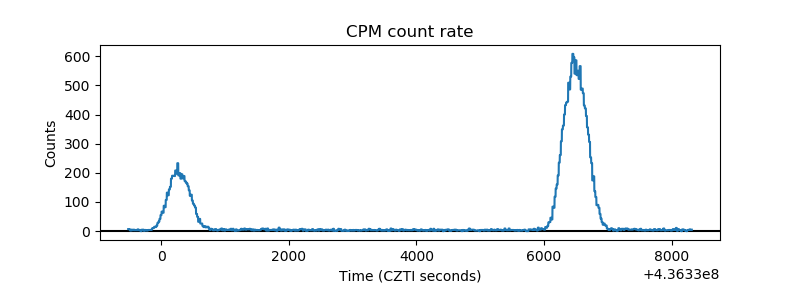 |
| CZT Counter | 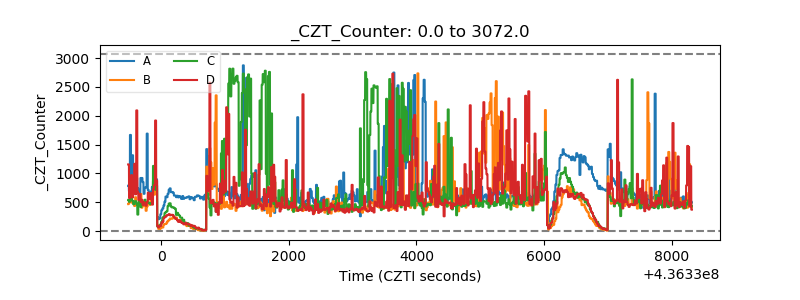 |
| +2.5 Volts monitor | 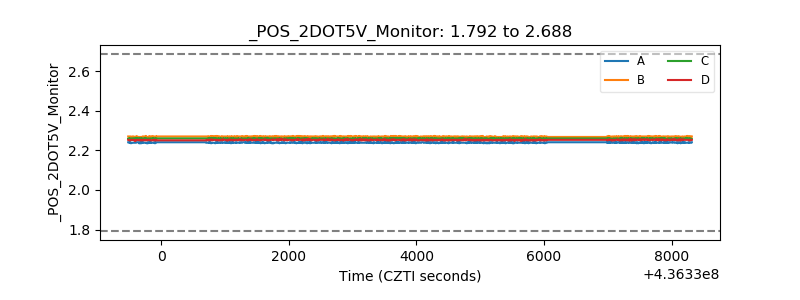 |
| +5 Volts monitor | 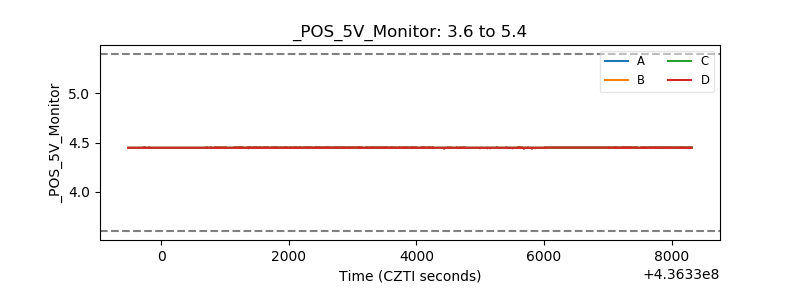 |
| _ROLL_ROT | 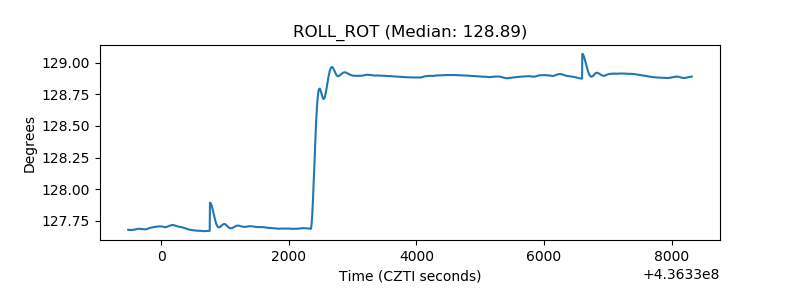 |
| _Roll_DEC | 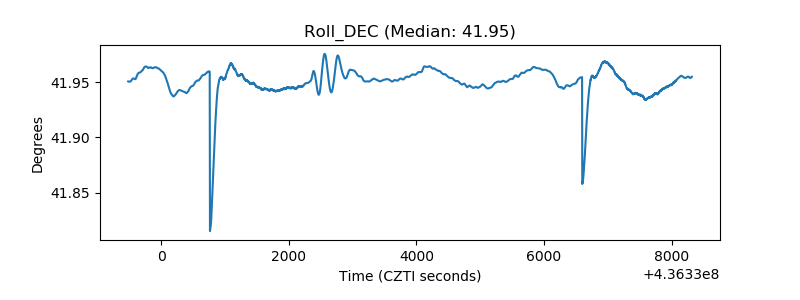 |
| _Roll_RA | 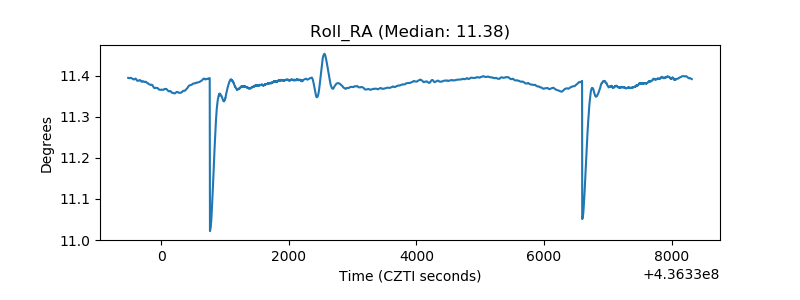 |
| Veto Counter | 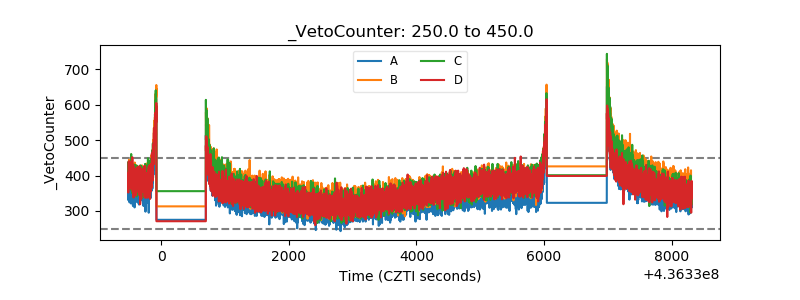 |