| Param | Original file | Final file |
|---|---|---|
| Filename | modeM0/AS1A13_003T01_9000005902_43732cztM0_level2.fits | modeM0/AS1A13_003T01_9000005902_43732cztM0_level2_quad_clean.evt |
| Size (bytes) | 560,698,560 | 106,588,800 |
| Size | 534.7 MB | 101.7 MB |
| Events in quadrant A | 6,415,050 | 676,052 |
| Events in quadrant B | 3,866,032 | 763,638 |
| Events in quadrant C | 3,909,665 | 731,578 |
| Events in quadrant D | 6,050,928 | 594,676 |
| Mode SS | |||
|---|---|---|---|
| Quadrant | BADHDUFLAG | Total packets | Discarded packets |
| A | 0 | 136 | 0 |
| B | 0 | 136 | 0 |
| C | 0 | 136 | 0 |
| D | 0 | 136 | 0 |
| Mode M0 | |||
|---|---|---|---|
| Quadrant | BADHDUFLAG | Total packets | Discarded packets |
| A | 0 | 23473 | 2 |
| B | 0 | 15829 | 2 |
| C | 0 | 16089 | 2 |
| D | 0 | 22521 | 2 |
| Mode M9 | |||
|---|---|---|---|
| Quadrant | BADHDUFLAG | Total packets | Discarded packets |
| A | 0 | 20 | 0 |
| B | 0 | 20 | 0 |
| C | 0 | 20 | 0 |
| D | 0 | 20 | 0 |
| Quadrant | Total seconds | Saturated seconds | Saturation percentage |
|---|---|---|---|
| A | 6618 | 821 | 12.405561% |
| B | 6619 | 253 | 3.822330% |
| C | 6619 | 224 | 3.384197% |
| D | 6619 | 916 | 13.838948% |
Noise dominated data is calculated using 1-second bins in cleaned event files. If a bin has >2000 counts, and if more than 50% of those come from <1% of pixels, then it is considered to be noise-dominated and hence unusable.
| Quadrant | # 1 sec bins | Bins with >0 counts | Bins with >2000 counts | High rate bins dominated by noise | Noise dominated (total time) | Noise dominated (detector-on time) | Marked lightcurve |
|---|---|---|---|---|---|---|---|
| A | 8623 | 6620 | 587 | 587 | 6.81% | 8.87% | 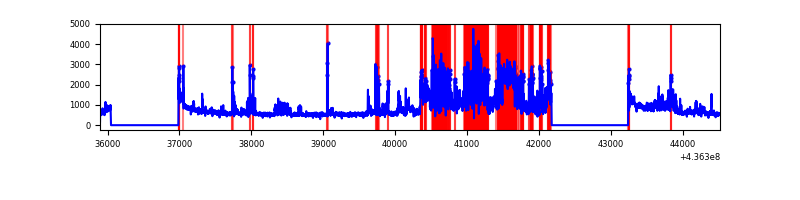 |
| B | 8624 | 6621 | 97 | 97 | 1.12% | 1.47% | 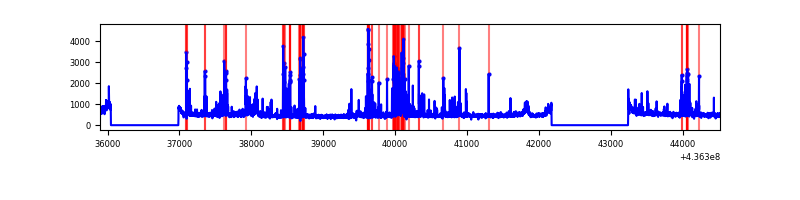 |
| C | 8624 | 6621 | 143 | 143 | 1.66% | 2.16% | 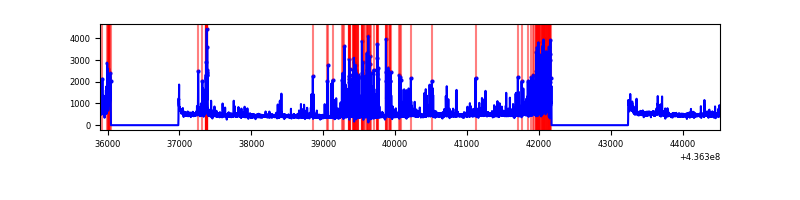 |
| D | 8624 | 6621 | 711 | 711 | 8.24% | 10.74% | 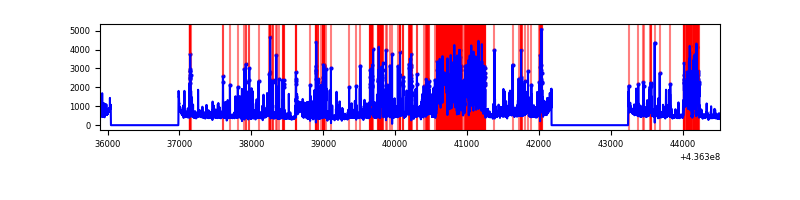 |
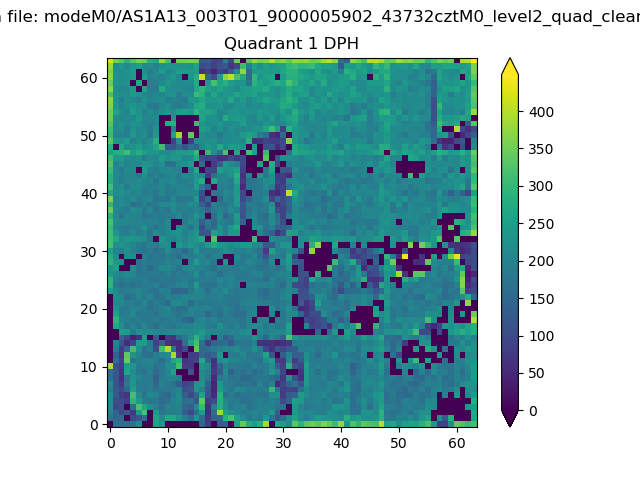
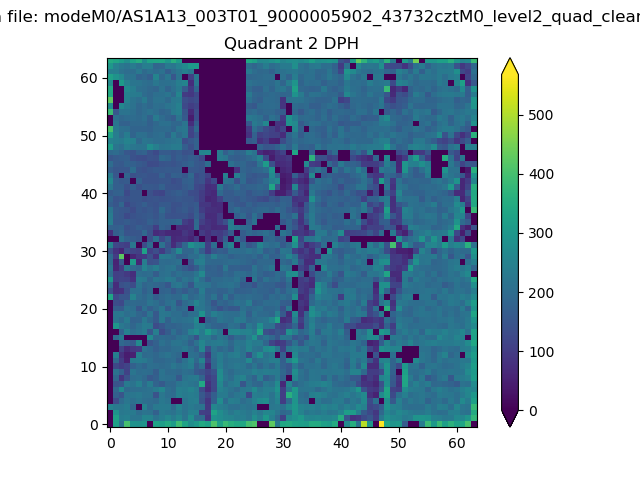
Top three noisy pixels from each quadrant. If the there are fewer than three noisy pixels in the level2.evt file, extra rows are filled as -1
| Pixel properties | Quadrant properties | ||||||
|---|---|---|---|---|---|---|---|
| Quadrant | DetID | PixID | Counts | Sigma | Mean | Median | Sigma |
| A | 15 | 223 | 2085194 | 13539.3 | 748 | 733 | 154.0 |
| A | 10 | 83 | 925943 | 6009.56 | 748 | 733 | 154.0 |
| A | 13 | 248 | 415805 | 2696.04 | 748 | 733 | 154.0 |
| B | 5 | 235 | 522953 | 3483.65 | 772 | 751 | 149.9 |
| B | 12 | 3 | 144239 | 957.22 | 772 | 751 | 149.9 |
| B | 5 | 172 | 73190 | 483.25 | 772 | 751 | 149.9 |
| C | 15 | 158 | 464441 | 2604.08 | 753 | 759 | 178.1 |
| C | 15 | 157 | 320749 | 1797.09 | 753 | 759 | 178.1 |
| C | 3 | 233 | 50881 | 281.49 | 753 | 759 | 178.1 |
| D | 5 | 235 | 1426427 | 7841.6 | 706 | 683 | 181.8 |
| D | 7 | 80 | 745386 | 4095.87 | 706 | 683 | 181.8 |
| D | 13 | 249 | 311987 | 1712.17 | 706 | 683 | 181.8 |
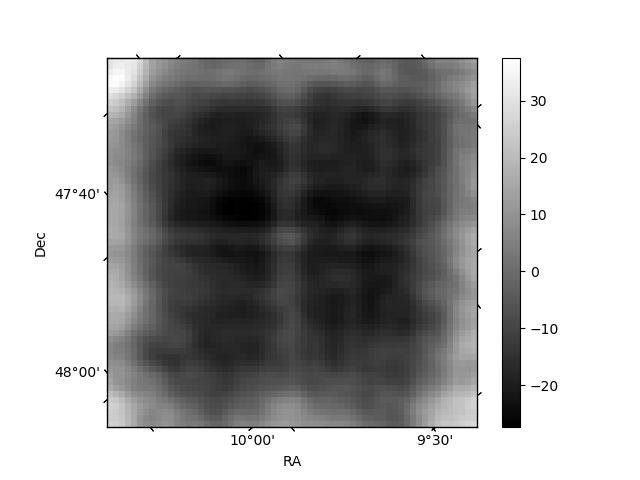
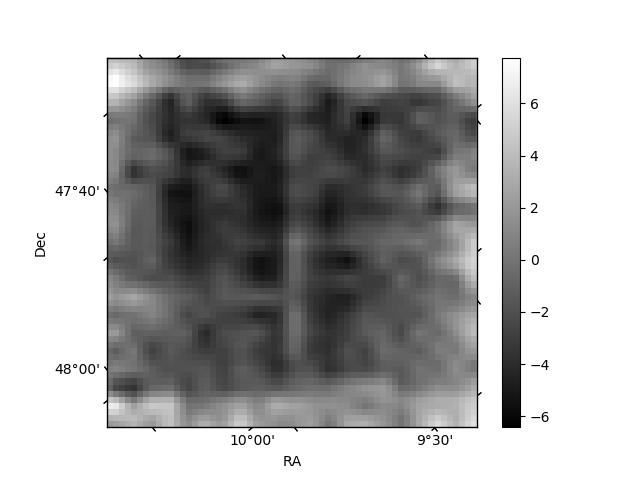
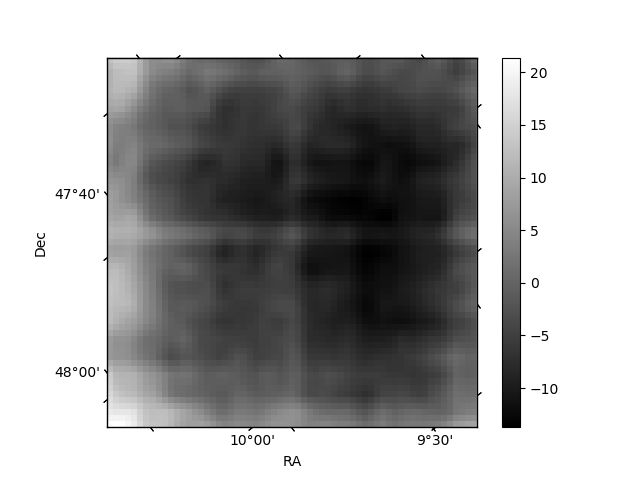
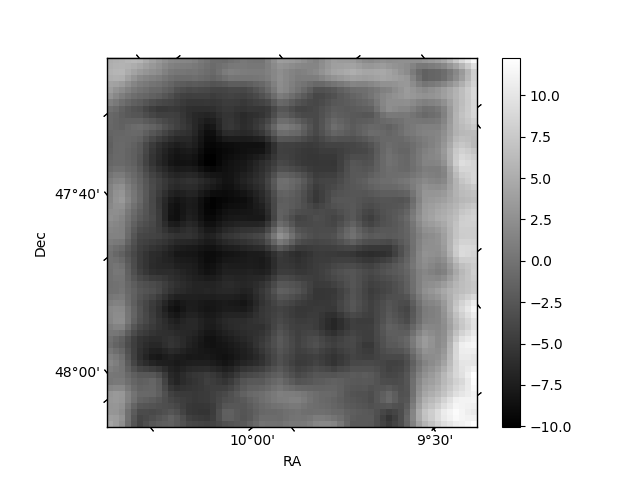
Histogram calculated using DETX and DETY for each event in the final _common_clean file
| Quadrant A | 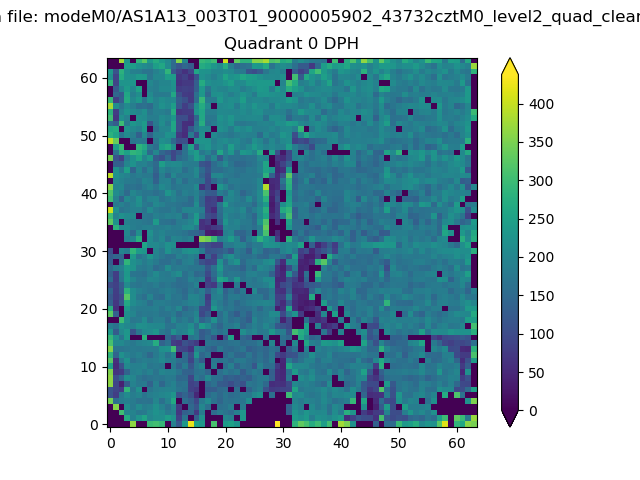 |
 |
Quadrant B |
|---|---|---|---|
| Quadrant D | 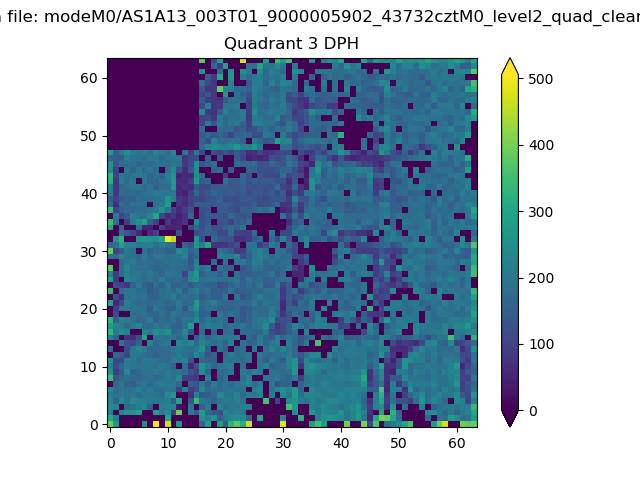 |
 |
Quadrant C |
| Plot type | Count rate plots | Images |
|---|---|---|
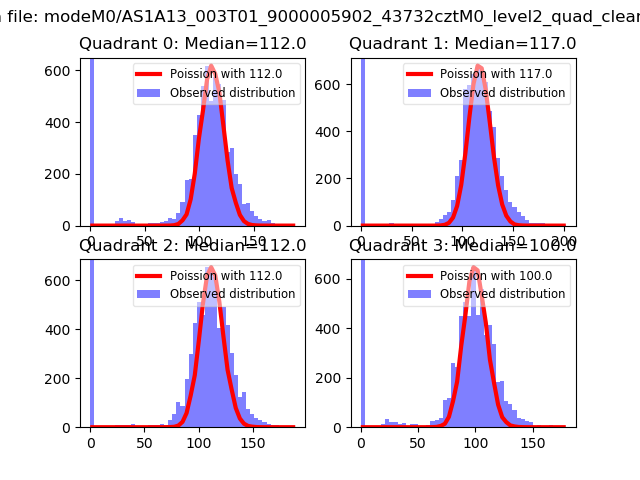
| Comparison with Poisson distribution Blue bars denote a histogram of data divided into 1 sec bins. Red curve is a Poisson curve with rate = median count rate of data. |
 |
 |
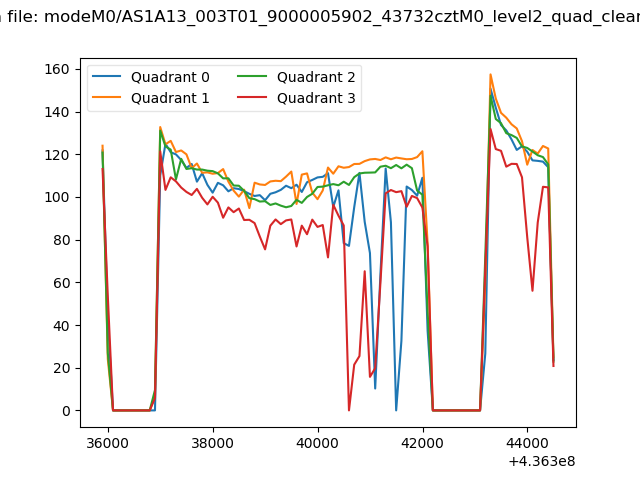
| Quadrant-wise count rates Data is divided into 100 sec bins |
 |
|
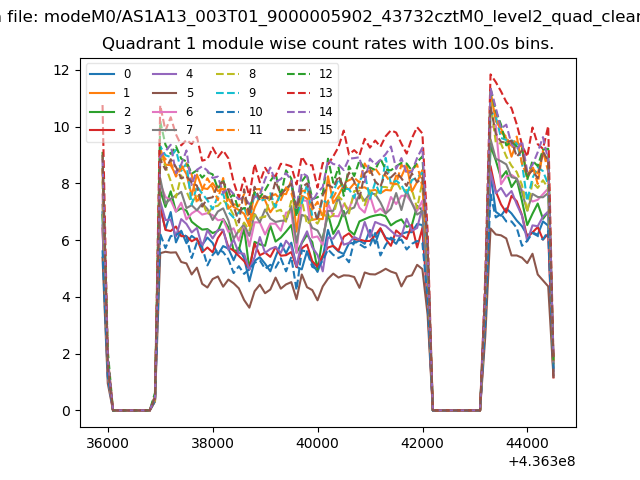
| Module-wise count rates for Quadrant A Data is divided into 100 sec bins |
 |
 |
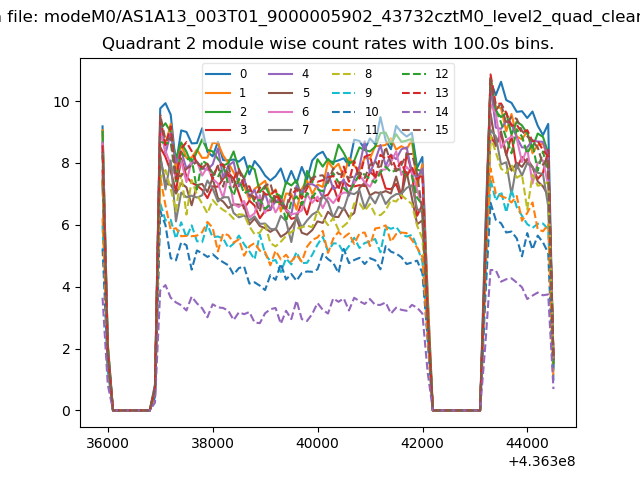
| Module-wise count rates for Quadrant B Data is divided into 100 sec bins |
 |
 |
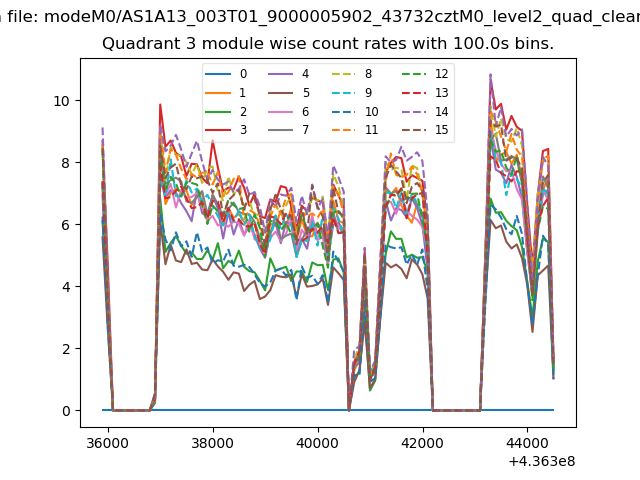
| Module-wise count rates for Quadrant C Data is divided into 100 sec bins |
 |
 |
| Module-wise count rates for Quadrant D Data is divided into 100 sec bins |
 |
 |
| Parameter | Plot |
|---|---|
| CZT HV Monitor |  |
| D_VDD | 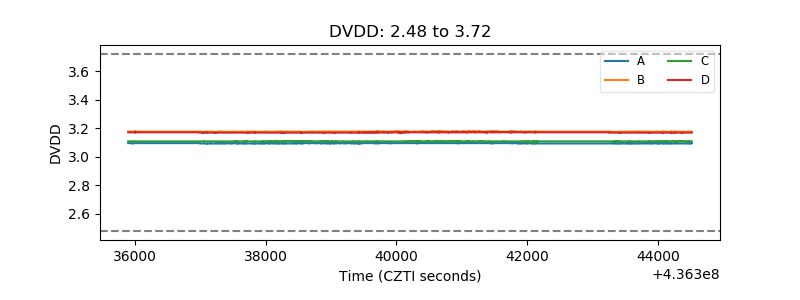 |
| Temperature 1 | 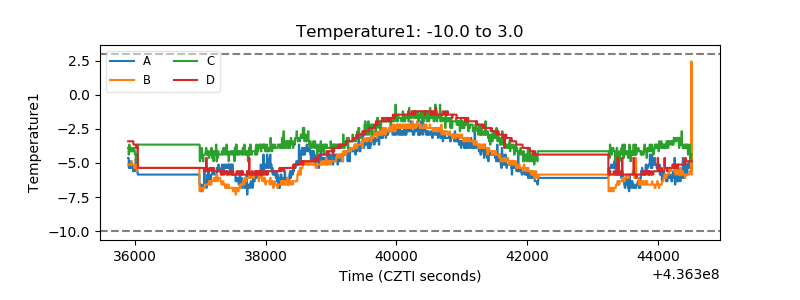 |
| Veto HV Monitor | 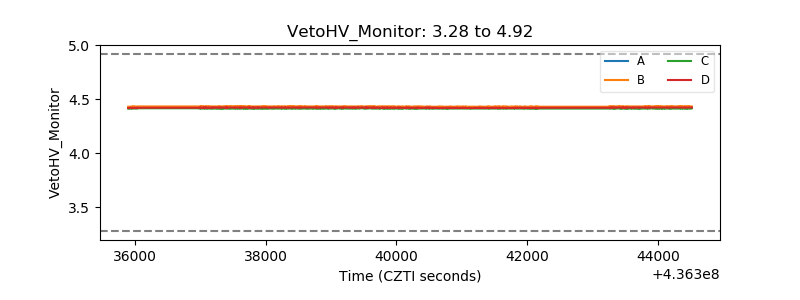 |
| Veto LLD | 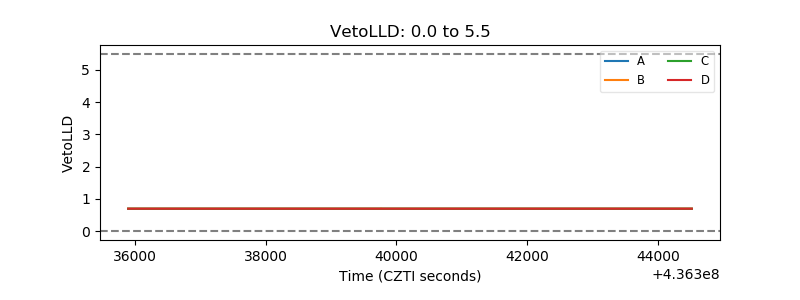 |
| Alpha Counter | 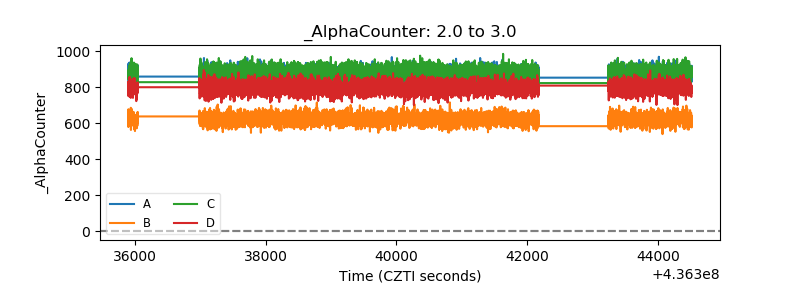 |
| _CPM_Rate | 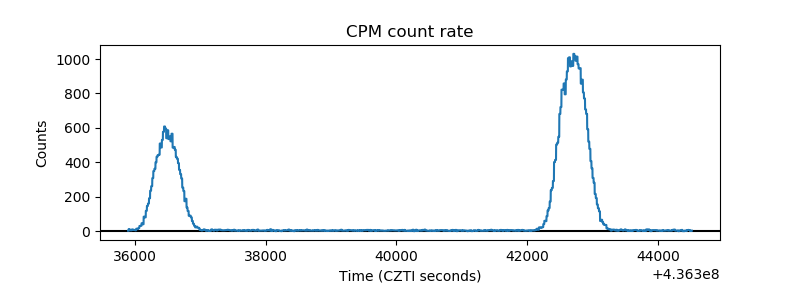 |
| CZT Counter | 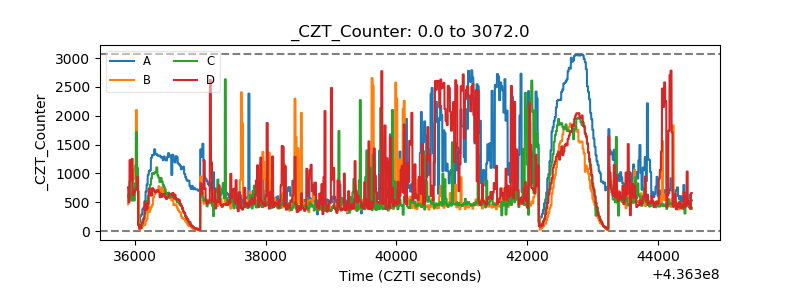 |
| +2.5 Volts monitor | 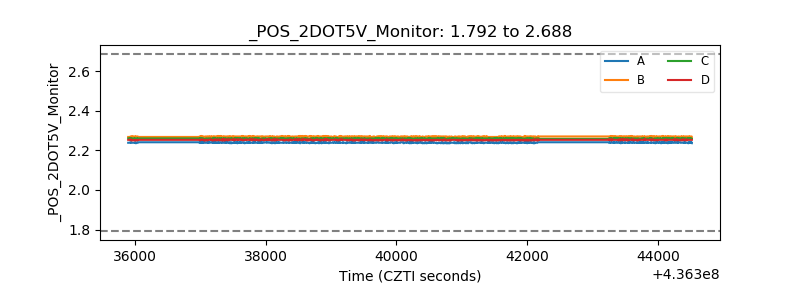 |
| +5 Volts monitor | 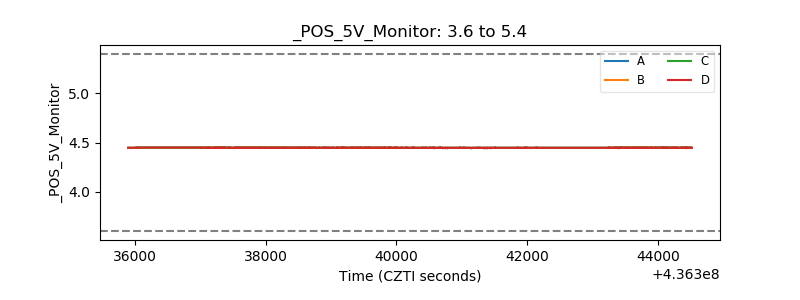 |
| _ROLL_ROT | 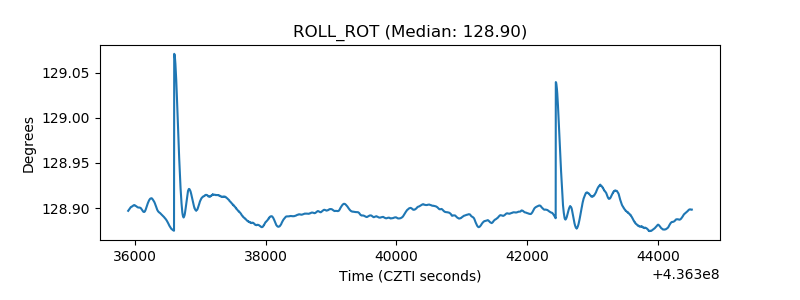 |
| _Roll_DEC | 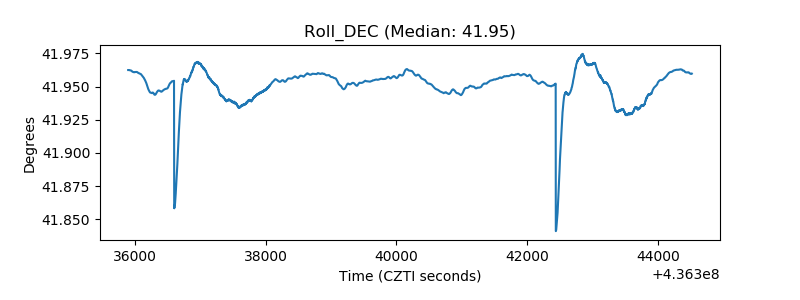 |
| _Roll_RA | 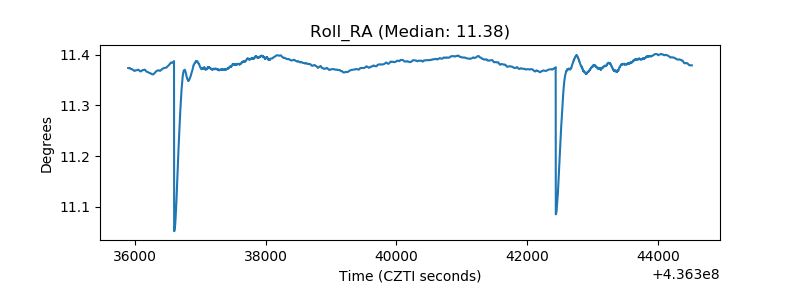 |
| Veto Counter | 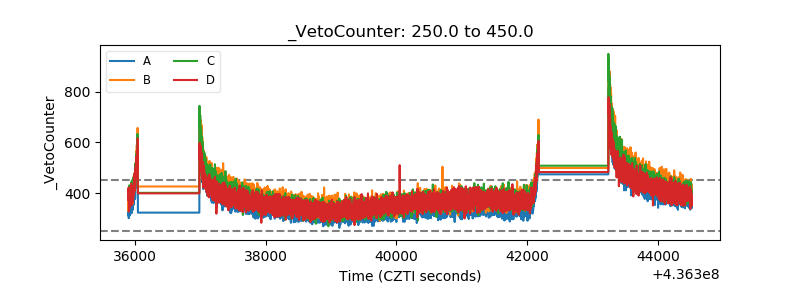 |