| Param | Original file | Final file |
|---|---|---|
| Filename | modeM0/AS1A13_003T01_9000005902_43733cztM0_level2.fits | modeM0/AS1A13_003T01_9000005902_43733cztM0_level2_quad_clean.evt |
| Size (bytes) | 491,425,920 | 81,918,720 |
| Size | 468.7 MB | 78.1 MB |
| Events in quadrant A | 3,550,856 | 589,359 |
| Events in quadrant B | 3,383,208 | 609,204 |
| Events in quadrant C | 3,291,316 | 577,060 |
| Events in quadrant D | 7,565,052 | 343,656 |
| Mode SS | |||
|---|---|---|---|
| Quadrant | BADHDUFLAG | Total packets | Discarded packets |
| A | 0 | 108 | 0 |
| B | 0 | 108 | 0 |
| C | 0 | 108 | 0 |
| D | 0 | 108 | 0 |
| Mode M0 | |||
|---|---|---|---|
| Quadrant | BADHDUFLAG | Total packets | Discarded packets |
| A | 0 | 13841 | 26 |
| B | 0 | 13469 | 13 |
| C | 0 | 13246 | 30 |
| D | 0 | 26148 | 115 |
| Mode M9 | |||
|---|---|---|---|
| Quadrant | BADHDUFLAG | Total packets | Discarded packets |
| A | 0 | 14 | 0 |
| B | 0 | 14 | 0 |
| C | 0 | 14 | 0 |
| D | 0 | 14 | 0 |
| Quadrant | Total seconds | Saturated seconds | Saturation percentage |
|---|---|---|---|
| A | 5150 | 184 | 3.572816% |
| B | 5157 | 255 | 4.944735% |
| C | 5145 | 253 | 4.917396% |
| D | 5141 | 2163 | 42.073527% |
Noise dominated data is calculated using 1-second bins in cleaned event files. If a bin has >2000 counts, and if more than 50% of those come from <1% of pixels, then it is considered to be noise-dominated and hence unusable.
| Quadrant | # 1 sec bins | Bins with >0 counts | Bins with >2000 counts | High rate bins dominated by noise | Noise dominated (total time) | Noise dominated (detector-on time) | Marked lightcurve |
|---|---|---|---|---|---|---|---|
| A | 6229 | 5161 | 37 | 37 | 0.59% | 0.72% | 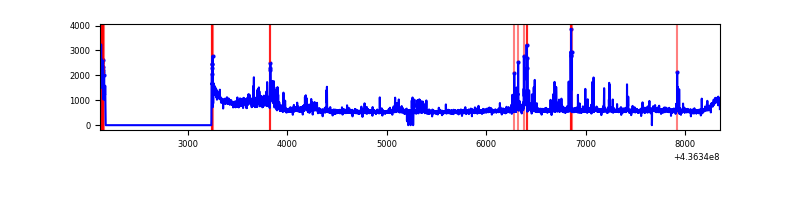 |
| B | 6230 | 5164 | 70 | 70 | 1.12% | 1.36% | 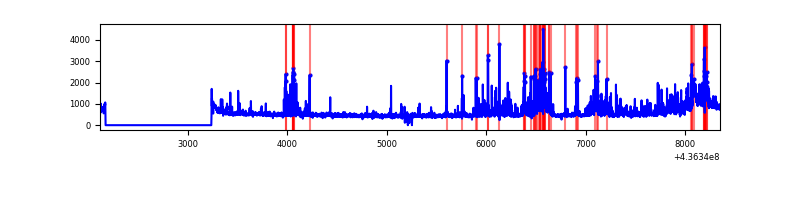 |
| C | 6230 | 5158 | 149 | 149 | 2.39% | 2.89% | 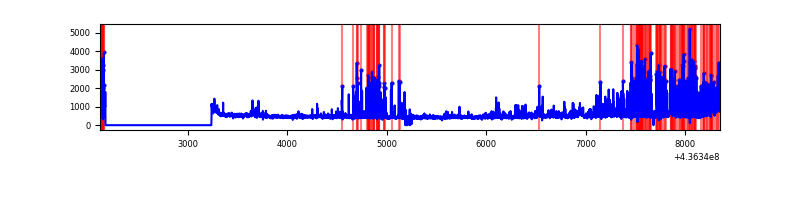 |
| D | 6230 | 5155 | 1507 | 1507 | 24.19% | 29.23% | 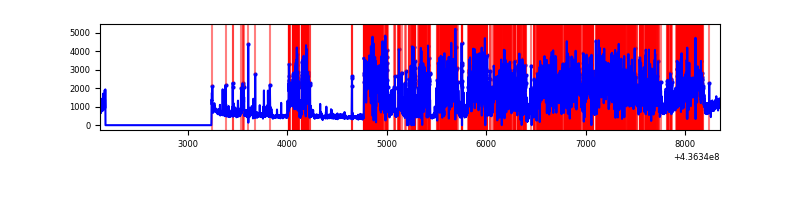 |
Top three noisy pixels from each quadrant. If the there are fewer than three noisy pixels in the level2.evt file, extra rows are filled as -1
| Pixel properties | Quadrant properties | ||||||
|---|---|---|---|---|---|---|---|
| Quadrant | DetID | PixID | Counts | Sigma | Mean | Median | Sigma |
| A | 10 | 83 | 691217 | 5403.78 | 612 | 600 | 127.8 |
| A | 15 | 223 | 348220 | 2719.98 | 612 | 600 | 127.8 |
| A | 13 | 248 | 103255 | 803.23 | 612 | 600 | 127.8 |
| B | 0 | 200 | 379680 | 3168.77 | 611 | 594 | 119.6 |
| B | 5 | 235 | 342024 | 2854.01 | 611 | 594 | 119.6 |
| B | 12 | 3 | 149476 | 1244.5 | 611 | 594 | 119.6 |
| C | 15 | 158 | 623191 | 4423.99 | 593 | 595 | 140.7 |
| C | 15 | 157 | 173801 | 1230.75 | 593 | 595 | 140.7 |
| C | 3 | 233 | 65032 | 457.87 | 593 | 595 | 140.7 |
| D | 7 | 80 | 3655811 | 29503.89 | 478 | 462 | 123.9 |
| D | 1 | 52 | 744505 | 6005.49 | 478 | 462 | 123.9 |
| D | 5 | 235 | 428047 | 3451.22 | 478 | 462 | 123.9 |
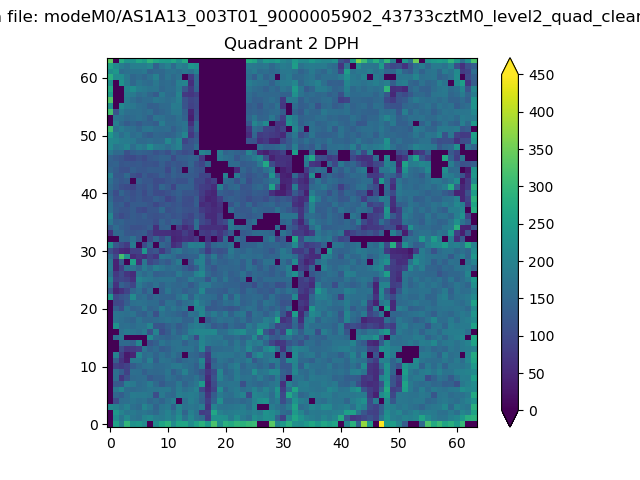
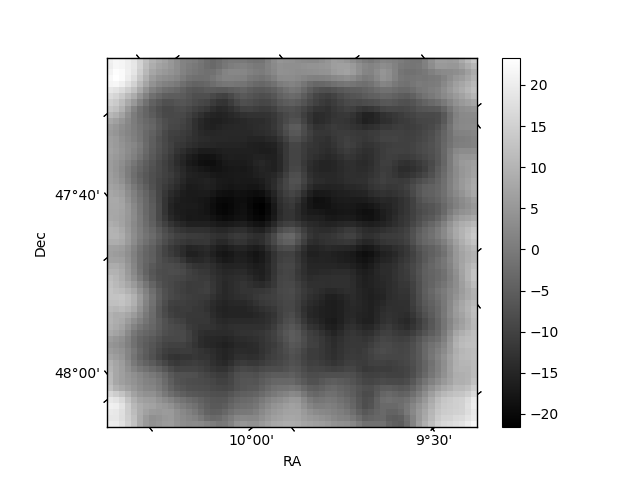
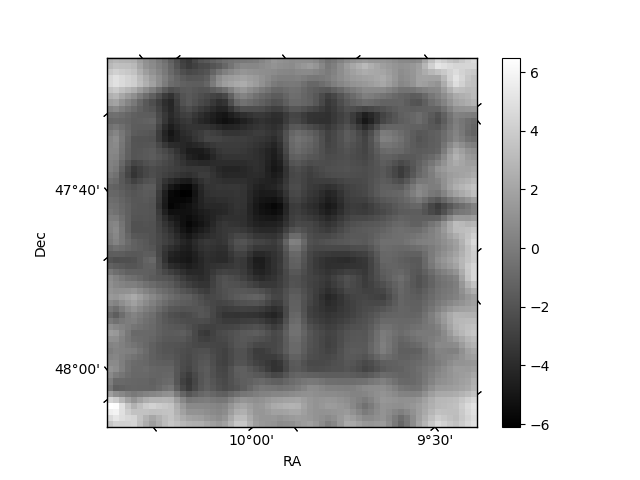
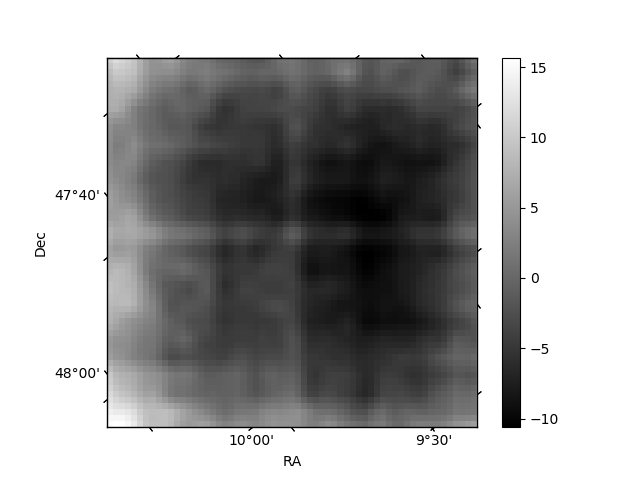
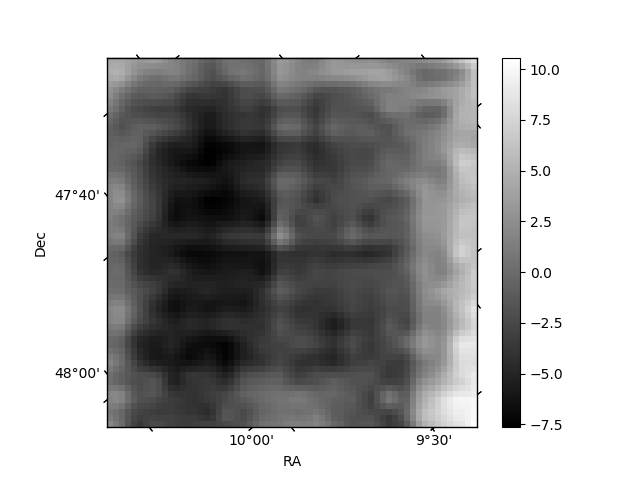
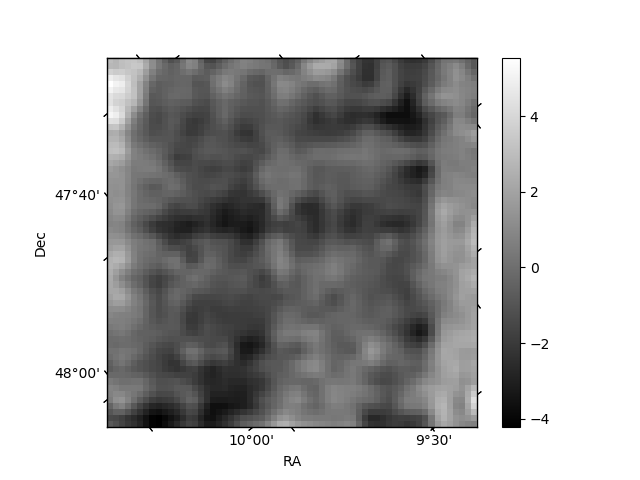
Histogram calculated using DETX and DETY for each event in the final _common_clean file
| Quadrant A | 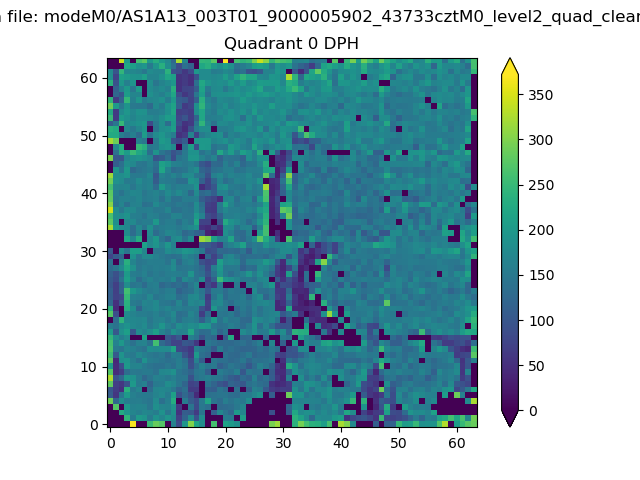 |
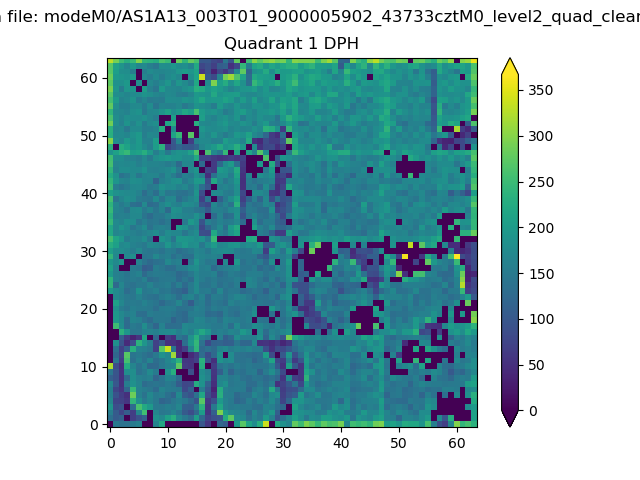 |
Quadrant B |
|---|---|---|---|
| Quadrant D | 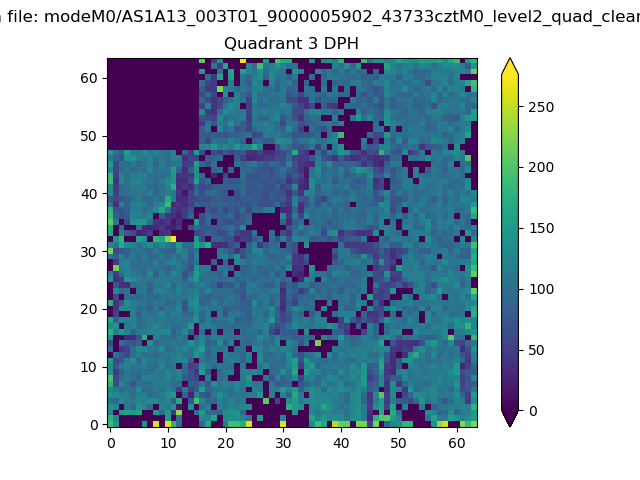 |
 |
Quadrant C |
| Plot type | Count rate plots | Images |
|---|---|---|
| Comparison with Poisson distribution Blue bars denote a histogram of data divided into 1 sec bins. Red curve is a Poisson curve with rate = median count rate of data. |
 |
 |
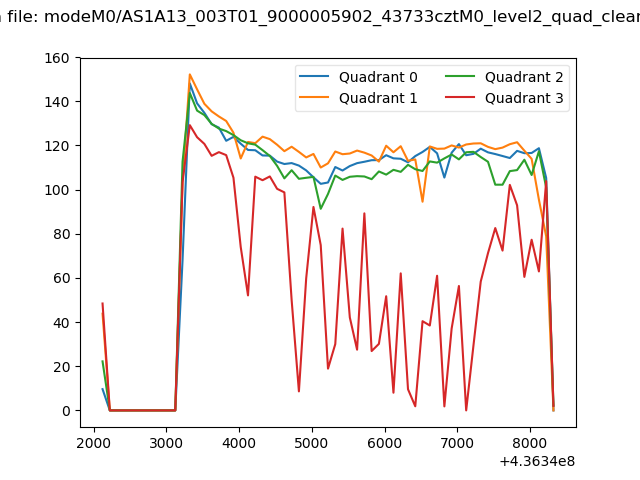
| Quadrant-wise count rates Data is divided into 100 sec bins |
 |
|
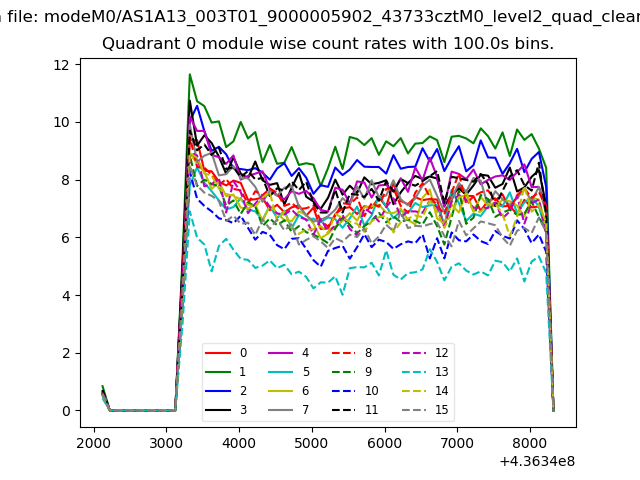
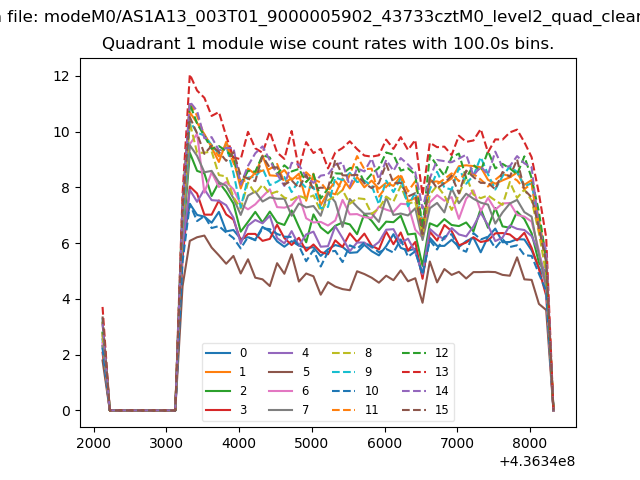
| Module-wise count rates for Quadrant A Data is divided into 100 sec bins |
 |
 |
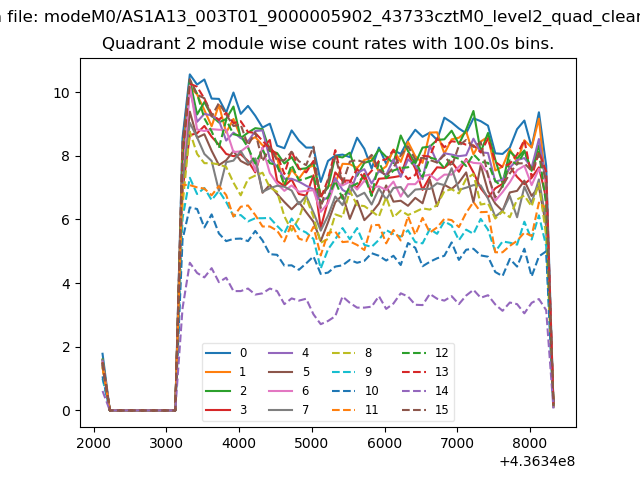
| Module-wise count rates for Quadrant B Data is divided into 100 sec bins |
 |
 |
| Module-wise count rates for Quadrant C Data is divided into 100 sec bins |
 |
 |
| Module-wise count rates for Quadrant D Data is divided into 100 sec bins |
 |
 |
| Parameter | Plot |
|---|---|
| CZT HV Monitor | 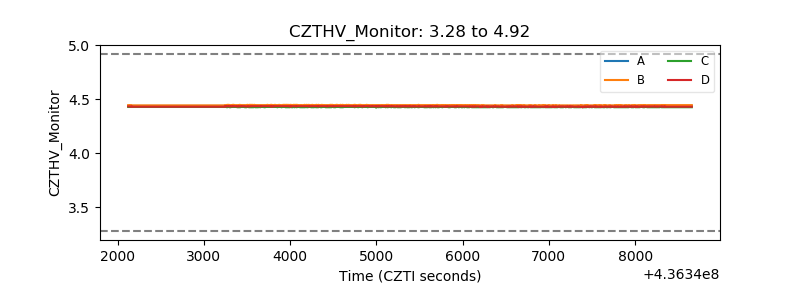 |
| D_VDD | 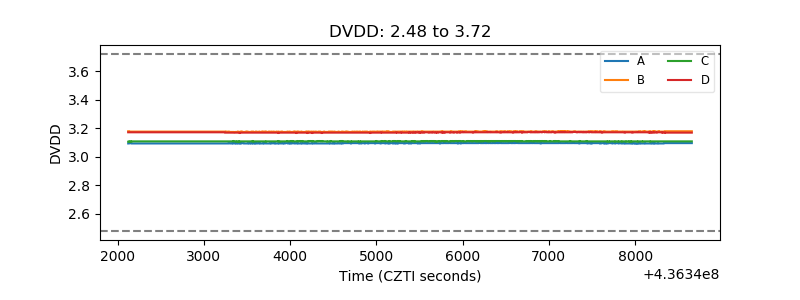 |
| Temperature 1 | 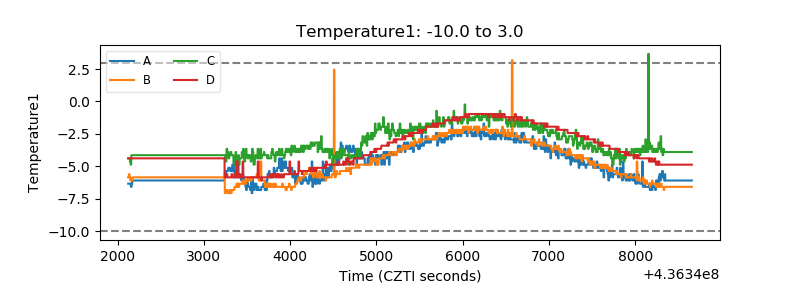 |
| Veto HV Monitor | 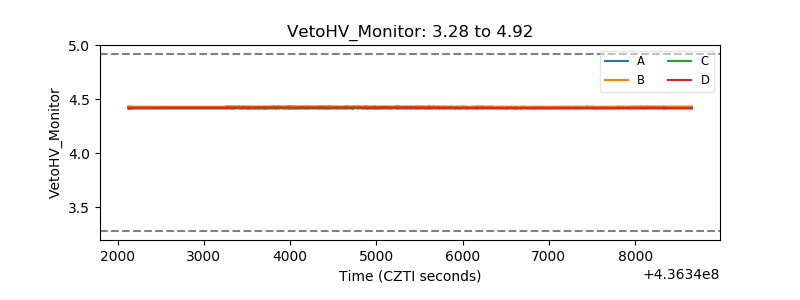 |
| Veto LLD | 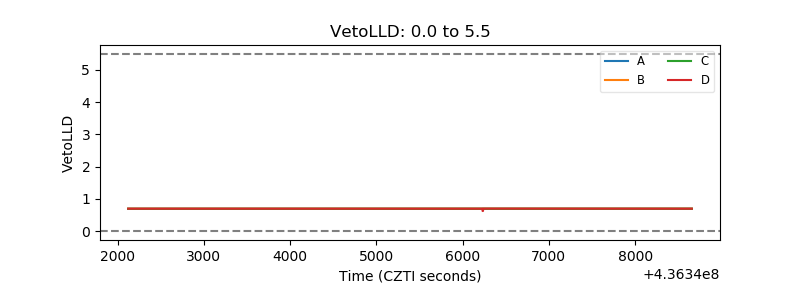 |
| Alpha Counter | 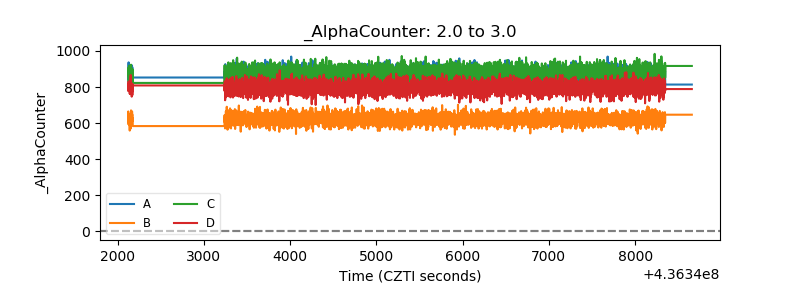 |
| _CPM_Rate | 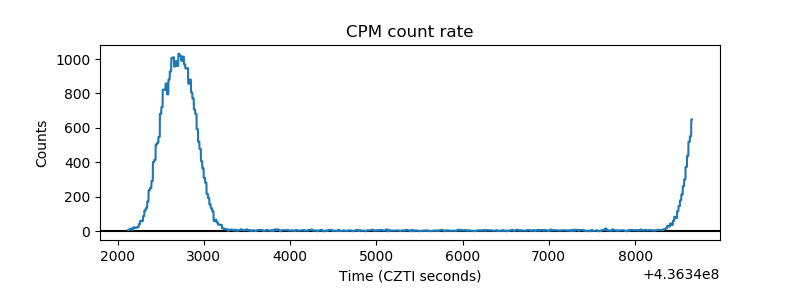 |
| CZT Counter | 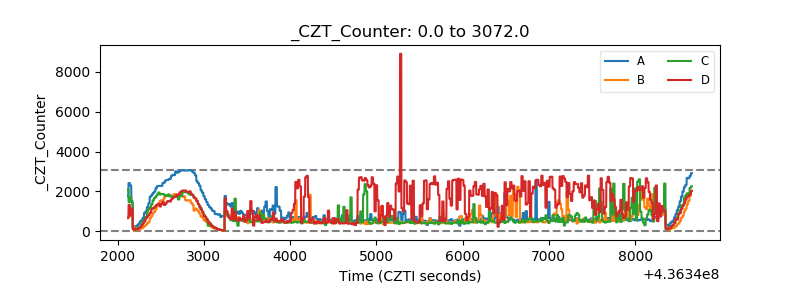 |
| +2.5 Volts monitor | 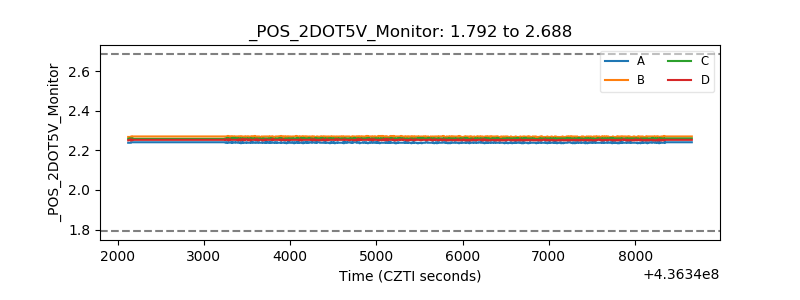 |
| +5 Volts monitor | 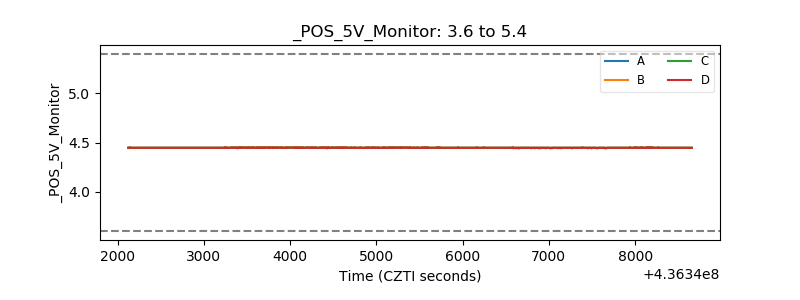 |
| _ROLL_ROT | 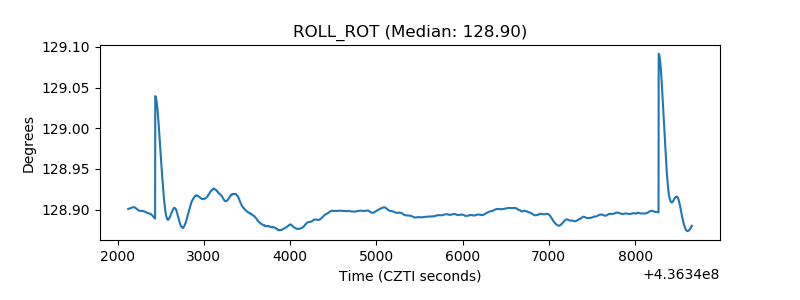 |
| _Roll_DEC | 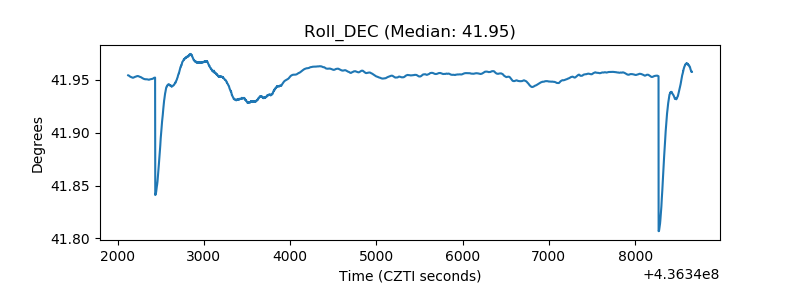 |
| _Roll_RA | 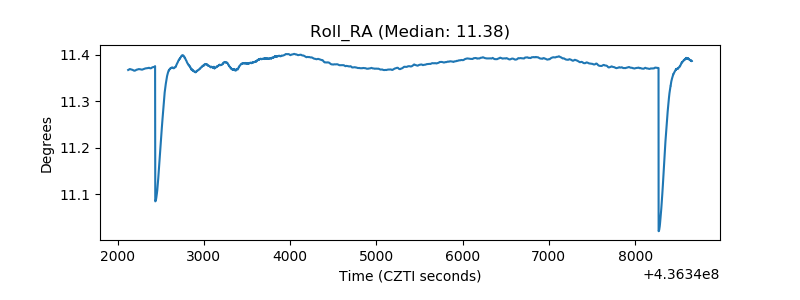 |
| Veto Counter | 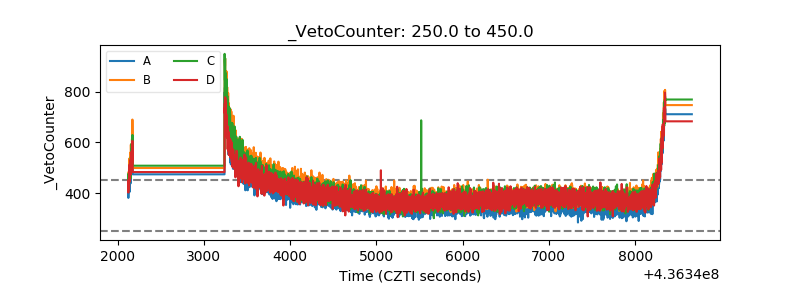 |