| Param | Original file | Final file |
|---|---|---|
| Filename | modeM0/AS1A13_003T01_9000005902_43736cztM0_level2.fits | modeM0/AS1A13_003T01_9000005902_43736cztM0_level2_quad_clean.evt |
| Size (bytes) | 546,808,320 | 112,536,000 |
| Size | 521.5 MB | 107.3 MB |
| Events in quadrant A | 4,375,689 | 781,911 |
| Events in quadrant B | 4,206,515 | 792,993 |
| Events in quadrant C | 3,814,026 | 770,850 |
| Events in quadrant D | 7,334,282 | 603,315 |
| Mode SS | |||
|---|---|---|---|
| Quadrant | BADHDUFLAG | Total packets | Discarded packets |
| A | 0 | 132 | 0 |
| B | 0 | 132 | 0 |
| C | 0 | 132 | 0 |
| D | 0 | 132 | 0 |
| Mode M0 | |||
|---|---|---|---|
| Quadrant | BADHDUFLAG | Total packets | Discarded packets |
| A | 0 | 17332 | 1 |
| B | 0 | 16752 | 1 |
| C | 0 | 15482 | 1 |
| D | 0 | 26284 | 7 |
| Mode M9 | |||
|---|---|---|---|
| Quadrant | BADHDUFLAG | Total packets | Discarded packets |
| A | 0 | 11 | 0 |
| B | 0 | 11 | 0 |
| C | 0 | 11 | 0 |
| D | 0 | 11 | 0 |
| Quadrant | Total seconds | Saturated seconds | Saturation percentage |
|---|---|---|---|
| A | 6580 | 217 | 3.297872% |
| B | 6580 | 358 | 5.440729% |
| C | 6580 | 140 | 2.127660% |
| D | 6580 | 1205 | 18.313070% |
Noise dominated data is calculated using 1-second bins in cleaned event files. If a bin has >2000 counts, and if more than 50% of those come from <1% of pixels, then it is considered to be noise-dominated and hence unusable.
| Quadrant | # 1 sec bins | Bins with >0 counts | Bins with >2000 counts | High rate bins dominated by noise | Noise dominated (total time) | Noise dominated (detector-on time) | Marked lightcurve |
|---|---|---|---|---|---|---|---|
| A | 7675 | 6581 | 62 | 62 | 0.81% | 0.94% | 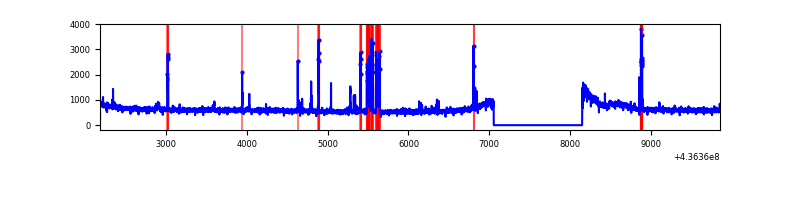 |
| B | 7675 | 6581 | 148 | 148 | 1.93% | 2.25% | 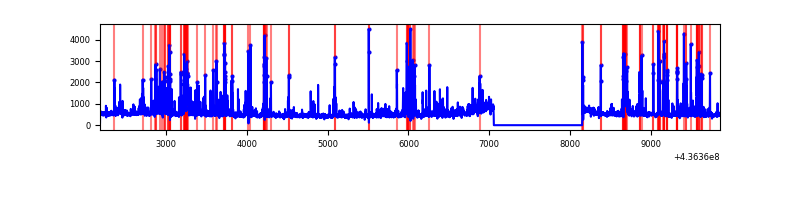 |
| C | 7675 | 6581 | 79 | 79 | 1.03% | 1.20% | 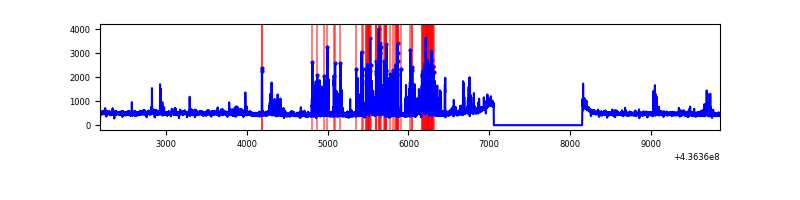 |
| D | 7675 | 6581 | 894 | 894 | 11.65% | 13.58% | 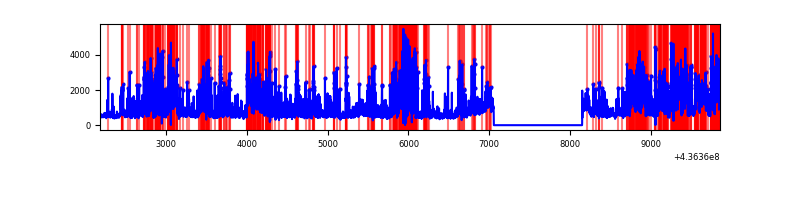 |
Top three noisy pixels from each quadrant. If the there are fewer than three noisy pixels in the level2.evt file, extra rows are filled as -1
| Pixel properties | Quadrant properties | ||||||
|---|---|---|---|---|---|---|---|
| Quadrant | DetID | PixID | Counts | Sigma | Mean | Median | Sigma |
| A | 10 | 83 | 880926 | 5321.09 | 800 | 784 | 165.4 |
| A | 15 | 223 | 192763 | 1160.65 | 800 | 784 | 165.4 |
| A | 15 | 174 | 107304 | 643.99 | 800 | 784 | 165.4 |
| B | 5 | 235 | 475510 | 3108.77 | 780 | 757 | 152.7 |
| B | 0 | 200 | 267238 | 1744.97 | 780 | 757 | 152.7 |
| B | 5 | 172 | 116285 | 756.5 | 780 | 757 | 152.7 |
| C | 15 | 158 | 552477 | 3016.17 | 778 | 782 | 182.9 |
| C | 3 | 233 | 79609 | 430.95 | 778 | 782 | 182.9 |
| C | 15 | 173 | 45455 | 244.23 | 778 | 782 | 182.9 |
| D | 7 | 80 | 1995849 | 10603.62 | 731 | 708 | 188.2 |
| D | 5 | 235 | 689173 | 3659.0 | 731 | 708 | 188.2 |
| D | 1 | 52 | 554308 | 2942.23 | 731 | 708 | 188.2 |
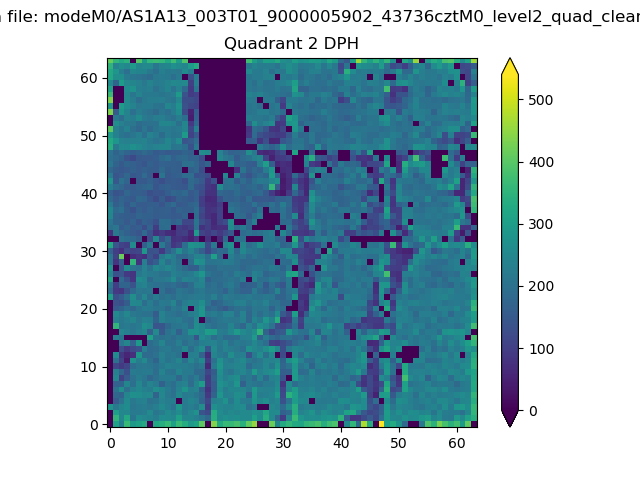
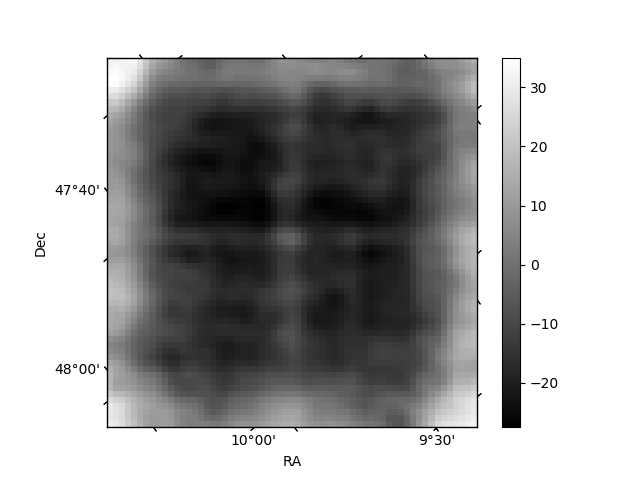
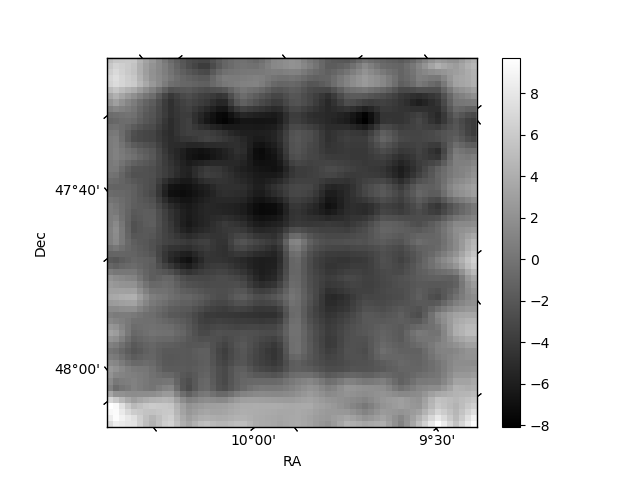
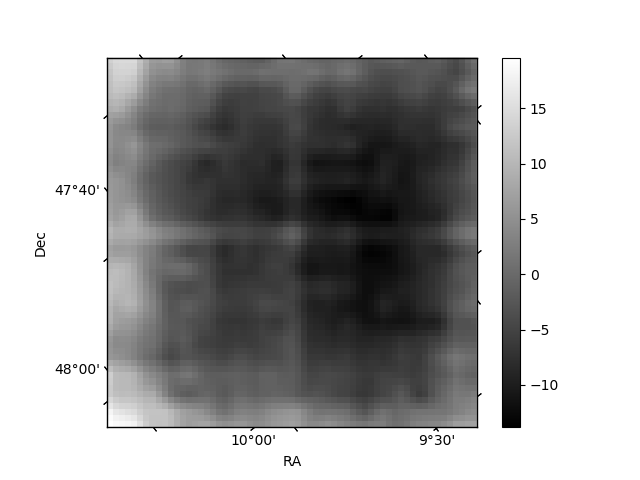
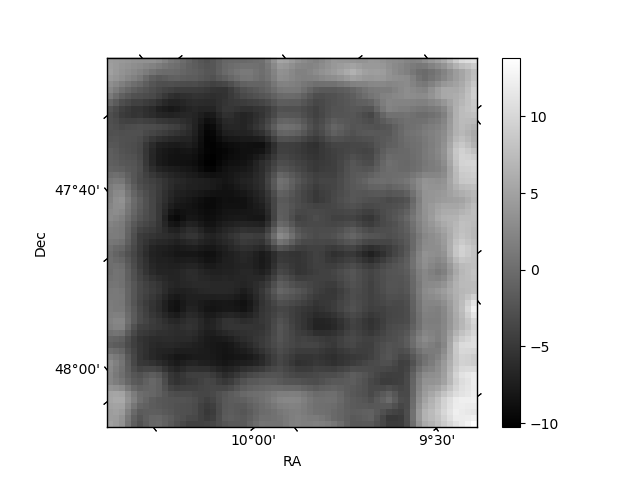
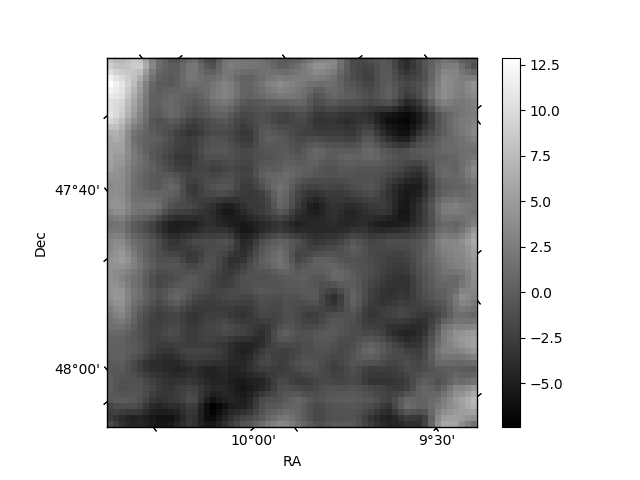
Histogram calculated using DETX and DETY for each event in the final _common_clean file
| Quadrant A | 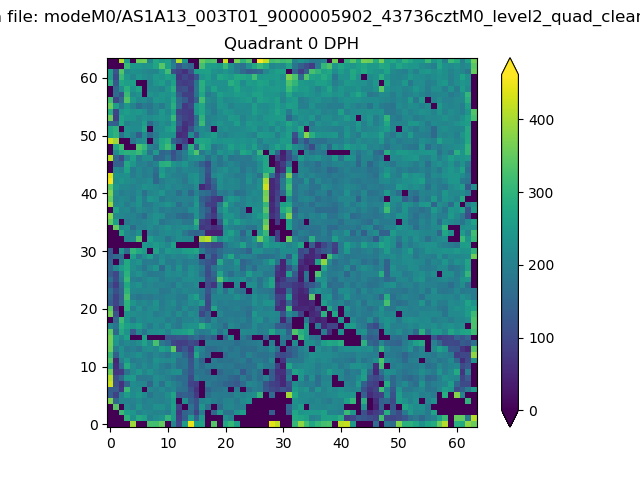 |
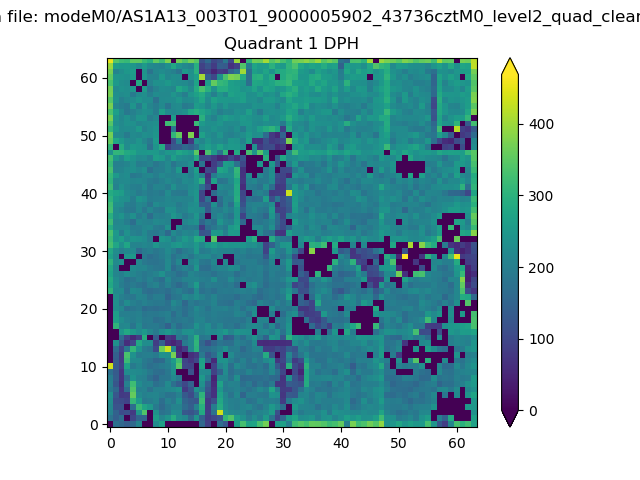 |
Quadrant B |
|---|---|---|---|
| Quadrant D | 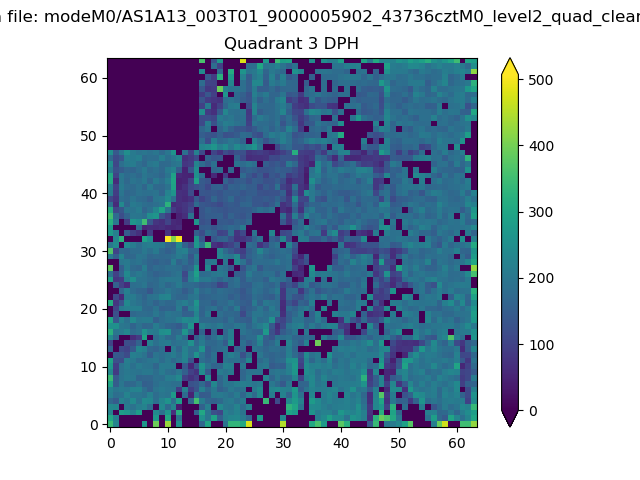 |
 |
Quadrant C |
| Plot type | Count rate plots | Images |
|---|---|---|
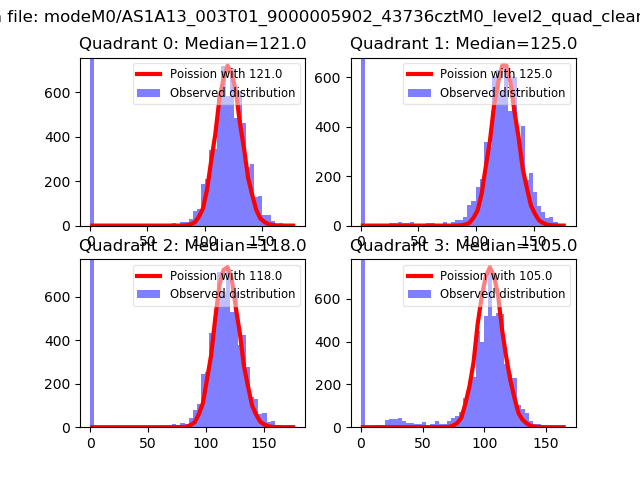
| Comparison with Poisson distribution Blue bars denote a histogram of data divided into 1 sec bins. Red curve is a Poisson curve with rate = median count rate of data. |
 |
 |
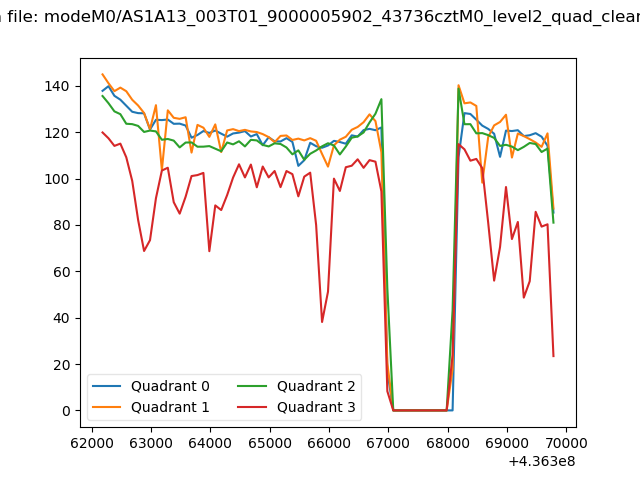
| Quadrant-wise count rates Data is divided into 100 sec bins |
 |
|
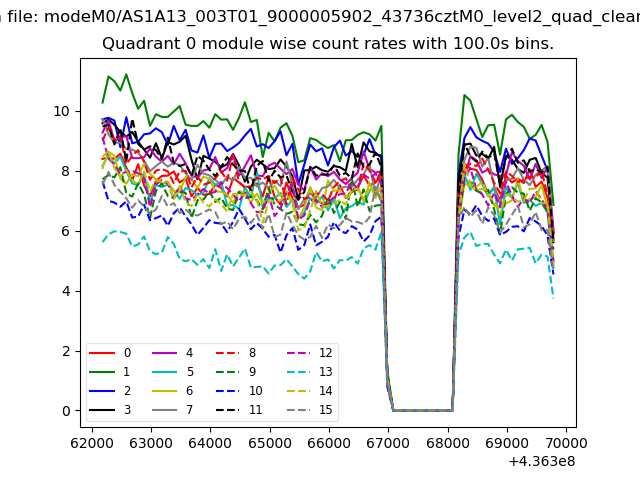
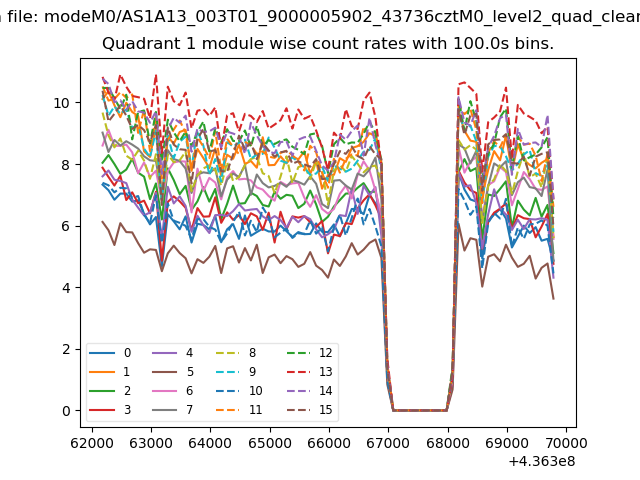
| Module-wise count rates for Quadrant A Data is divided into 100 sec bins |
 |
 |
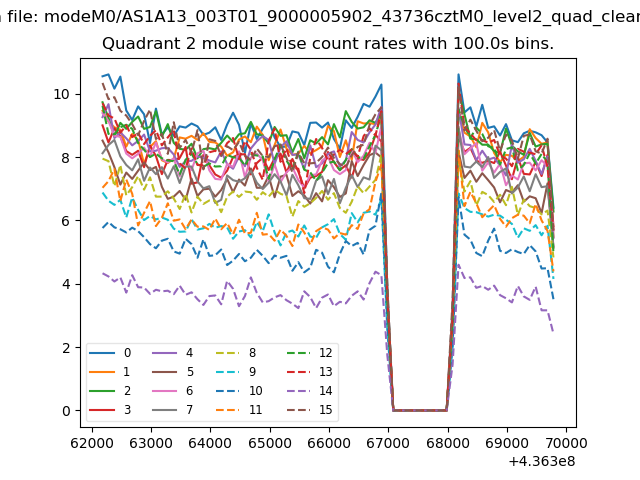
| Module-wise count rates for Quadrant B Data is divided into 100 sec bins |
 |
 |
| Module-wise count rates for Quadrant C Data is divided into 100 sec bins |
 |
 |
| Module-wise count rates for Quadrant D Data is divided into 100 sec bins |
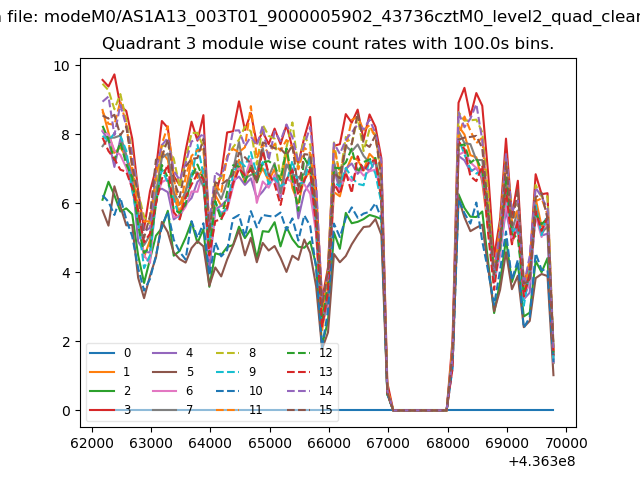 |
 |
| Parameter | Plot |
|---|---|
| CZT HV Monitor | 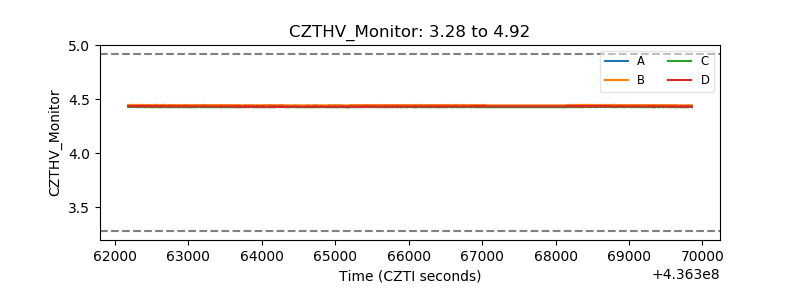 |
| D_VDD | 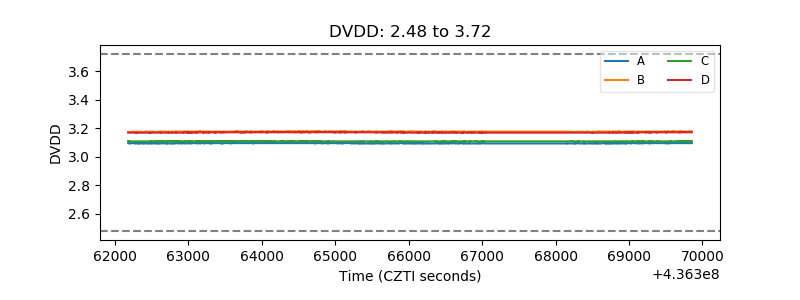 |
| Temperature 1 | 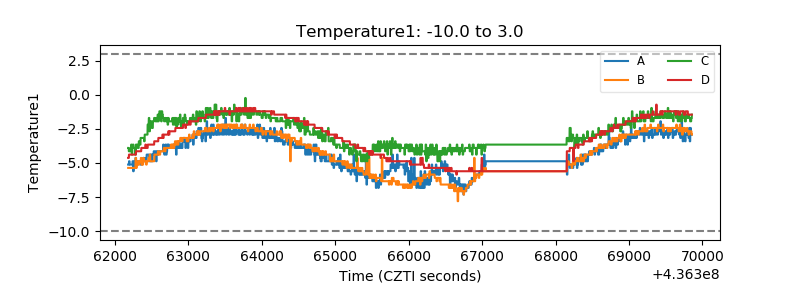 |
| Veto HV Monitor | 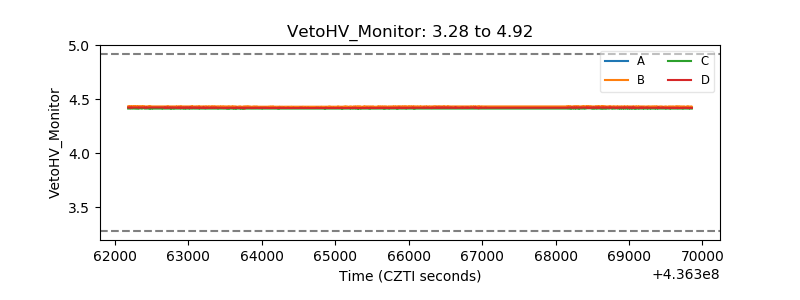 |
| Veto LLD | 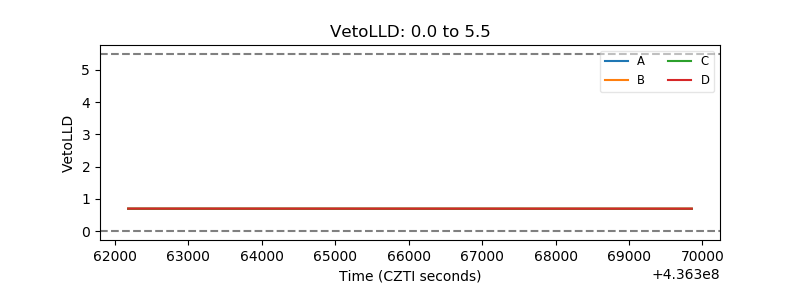 |
| Alpha Counter | 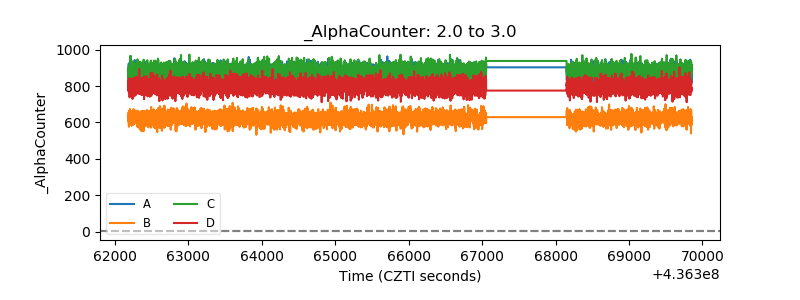 |
| _CPM_Rate | 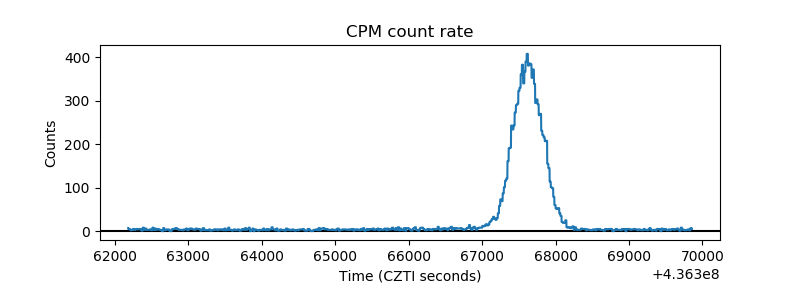 |
| CZT Counter | 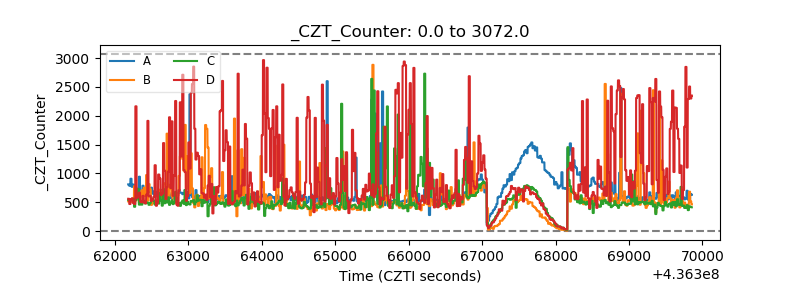 |
| +2.5 Volts monitor |  |
| +5 Volts monitor | 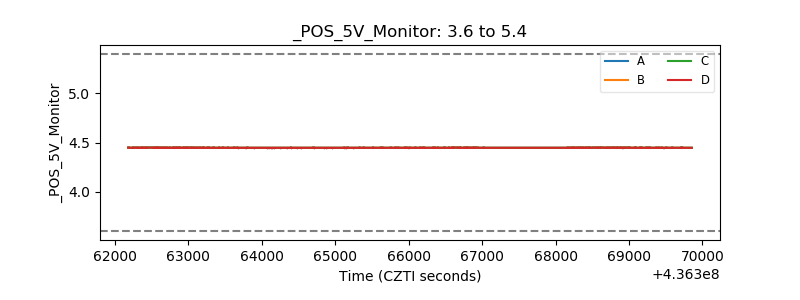 |
| _ROLL_ROT | 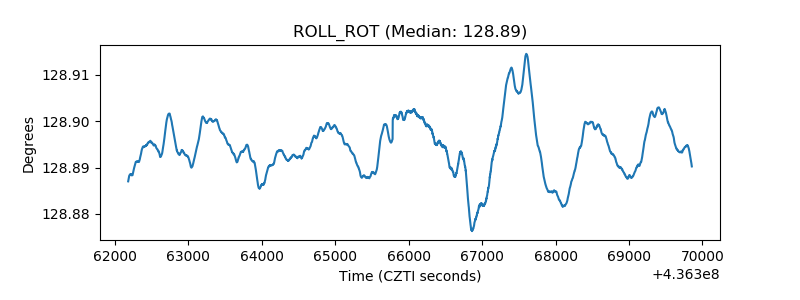 |
| _Roll_DEC | 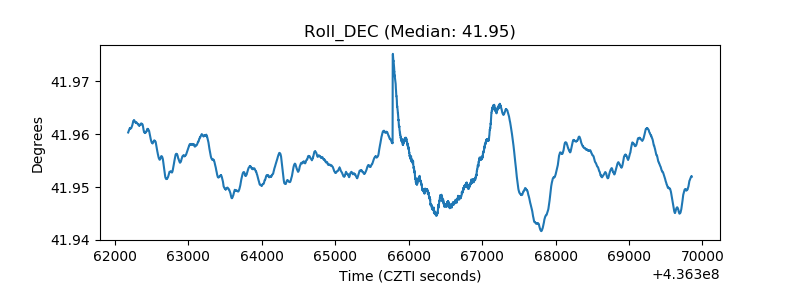 |
| _Roll_RA | 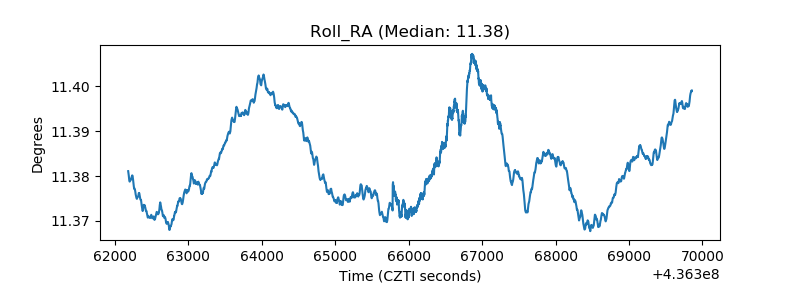 |
| Veto Counter | 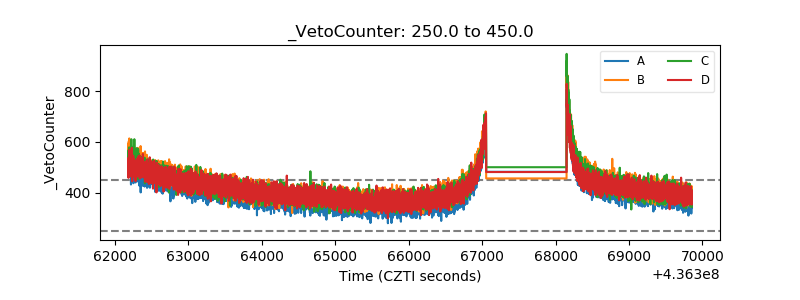 |