| Param | Original file | Final file |
|---|---|---|
| Filename | modeM0/AS1A13_003T01_9000005902_43737cztM0_level2.fits | modeM0/AS1A13_003T01_9000005902_43737cztM0_level2_quad_clean.evt |
| Size (bytes) | 542,738,880 | 99,866,880 |
| Size | 517.6 MB | 95.2 MB |
| Events in quadrant A | 3,909,179 | 703,258 |
| Events in quadrant B | 4,979,180 | 668,983 |
| Events in quadrant C | 3,209,844 | 696,410 |
| Events in quadrant D | 7,508,156 | 519,573 |
| Mode SS | |||
|---|---|---|---|
| Quadrant | BADHDUFLAG | Total packets | Discarded packets |
| A | 0 | 128 | 0 |
| B | 0 | 128 | 0 |
| C | 0 | 128 | 0 |
| D | 0 | 128 | 0 |
| Mode M0 | |||
|---|---|---|---|
| Quadrant | BADHDUFLAG | Total packets | Discarded packets |
| A | 0 | 15647 | 1 |
| B | 0 | 18996 | 1 |
| C | 0 | 13767 | 1 |
| D | 0 | 26654 | 5 |
| Mode M9 | |||
|---|---|---|---|
| Quadrant | BADHDUFLAG | Total packets | Discarded packets |
| A | 0 | 9 | 0 |
| B | 0 | 9 | 0 |
| C | 0 | 9 | 0 |
| D | 0 | 9 | 0 |
| Quadrant | Total seconds | Saturated seconds | Saturation percentage |
|---|---|---|---|
| A | 6235 | 174 | 2.790698% |
| B | 6236 | 759 | 12.171264% |
| C | 6236 | 103 | 1.651700% |
| D | 6235 | 1387 | 22.245389% |
Noise dominated data is calculated using 1-second bins in cleaned event files. If a bin has >2000 counts, and if more than 50% of those come from <1% of pixels, then it is considered to be noise-dominated and hence unusable.
| Quadrant | # 1 sec bins | Bins with >0 counts | Bins with >2000 counts | High rate bins dominated by noise | Noise dominated (total time) | Noise dominated (detector-on time) | Marked lightcurve |
|---|---|---|---|---|---|---|---|
| A | 7120 | 6236 | 45 | 45 | 0.63% | 0.72% | 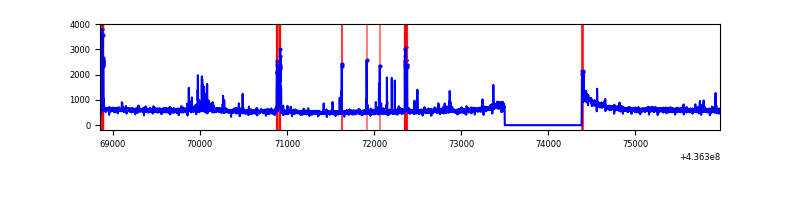 |
| B | 7121 | 6237 | 490 | 490 | 6.88% | 7.86% | 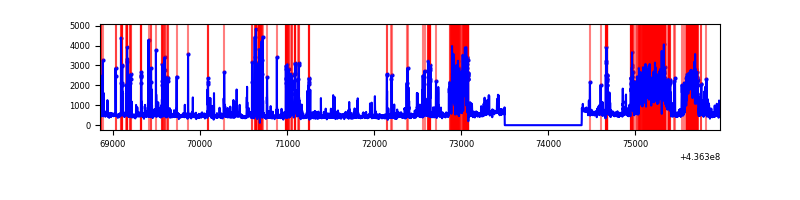 |
| C | 7121 | 6237 | 27 | 27 | 0.38% | 0.43% | 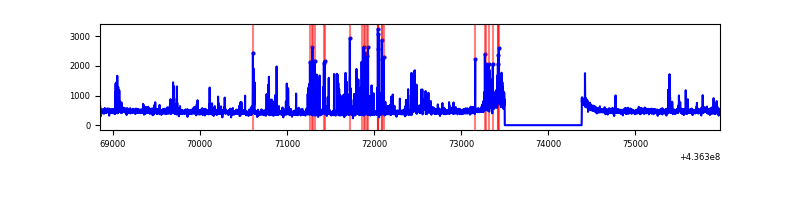 |
| D | 7120 | 6236 | 1163 | 1163 | 16.33% | 18.65% | 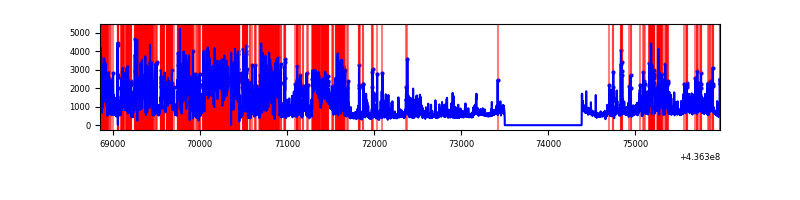 |
Top three noisy pixels from each quadrant. If the there are fewer than three noisy pixels in the level2.evt file, extra rows are filled as -1
| Pixel properties | Quadrant properties | ||||||
|---|---|---|---|---|---|---|---|
| Quadrant | DetID | PixID | Counts | Sigma | Mean | Median | Sigma |
| A | 10 | 83 | 789142 | 5244.14 | 721 | 706 | 150.3 |
| A | 2 | 79 | 81000 | 534.06 | 721 | 706 | 150.3 |
| A | 15 | 223 | 69653 | 458.59 | 721 | 706 | 150.3 |
| B | 0 | 200 | 1039694 | 7693.53 | 689 | 669 | 135.1 |
| B | 5 | 235 | 839255 | 6209.37 | 689 | 669 | 135.1 |
| B | 0 | 183 | 162842 | 1200.82 | 689 | 669 | 135.1 |
| C | 15 | 158 | 264112 | 1581.61 | 708 | 712 | 166.5 |
| C | 14 | 254 | 71207 | 423.29 | 708 | 712 | 166.5 |
| C | 3 | 233 | 42344 | 249.98 | 708 | 712 | 166.5 |
| D | 7 | 80 | 1893919 | 11406.04 | 649 | 631 | 166.0 |
| D | 5 | 235 | 1568065 | 9442.95 | 649 | 631 | 166.0 |
| D | 1 | 52 | 379438 | 2282.11 | 649 | 631 | 166.0 |
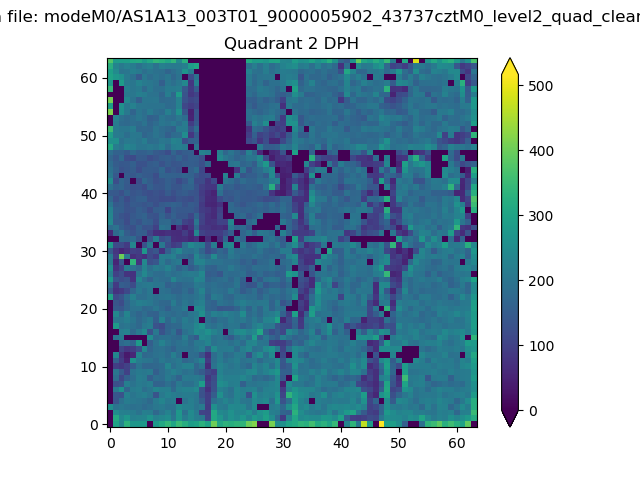
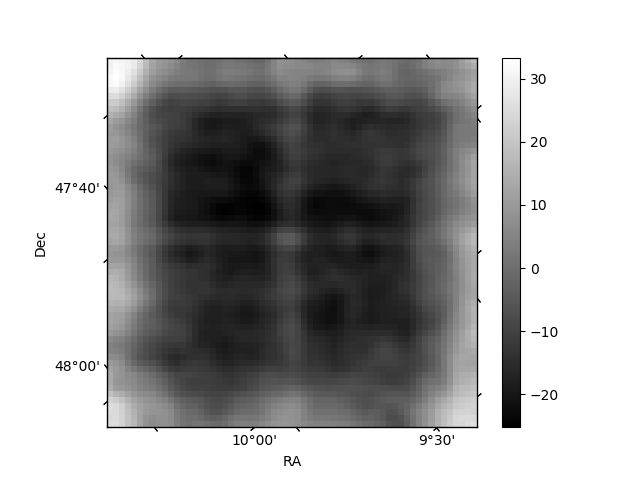
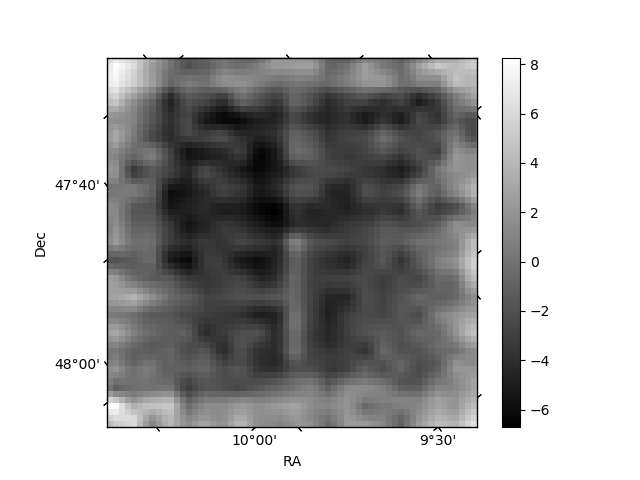
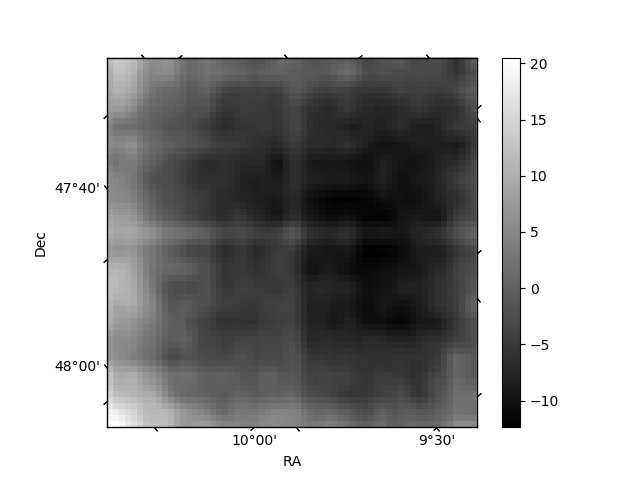
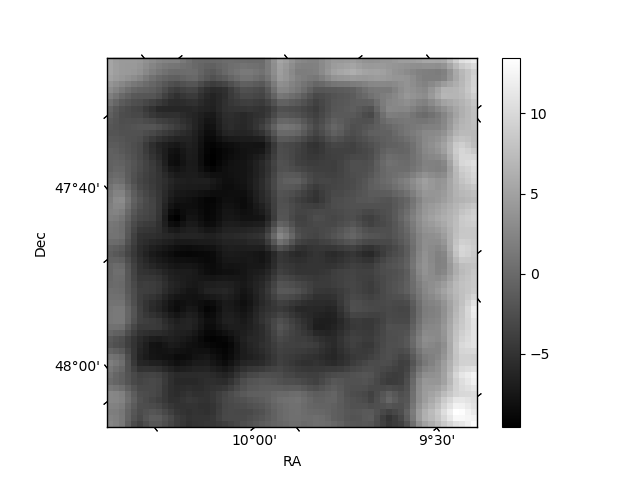
Histogram calculated using DETX and DETY for each event in the final _common_clean file
| Quadrant A | 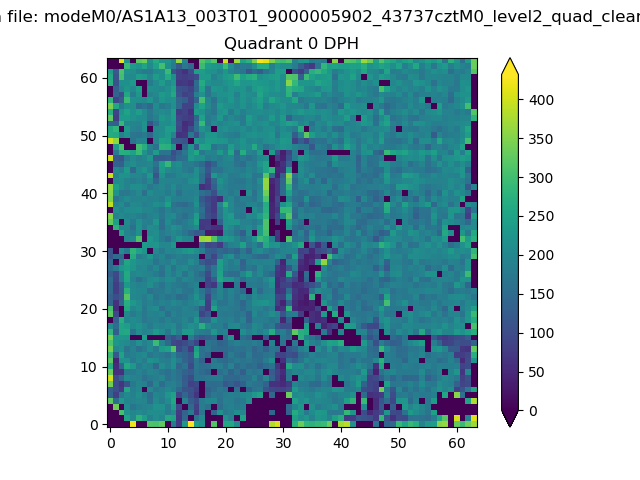 |
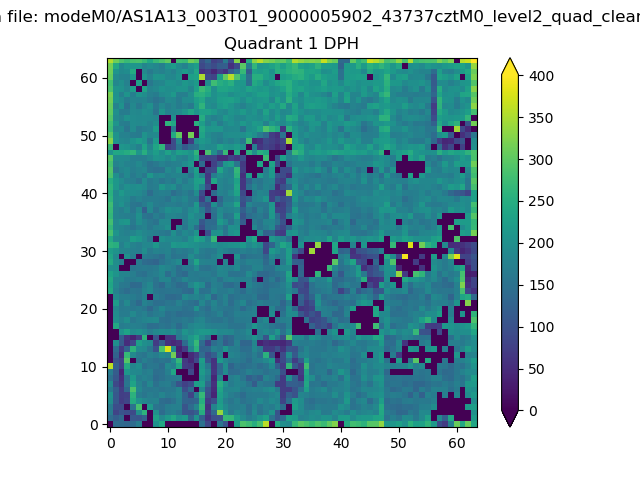 |
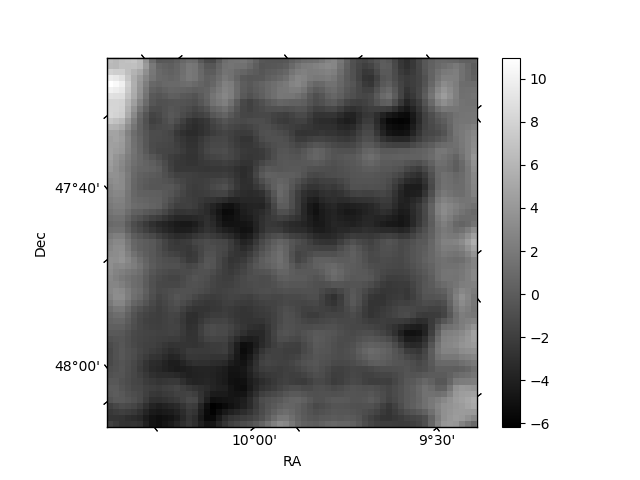
Quadrant B |
|---|---|---|---|
| Quadrant D | 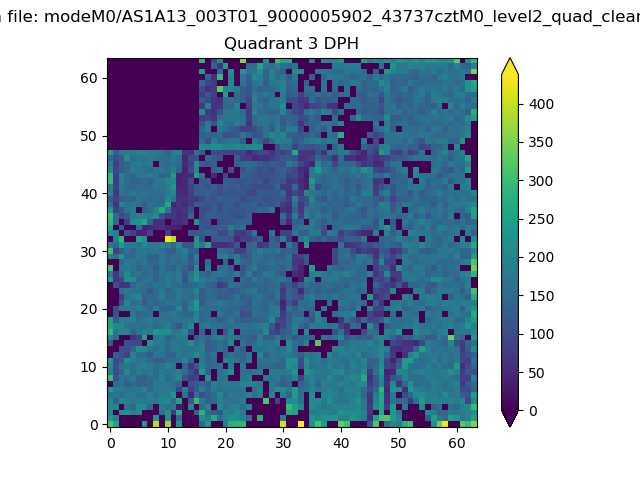 |
 |
Quadrant C |
| Plot type | Count rate plots | Images |
|---|---|---|
| Comparison with Poisson distribution Blue bars denote a histogram of data divided into 1 sec bins. Red curve is a Poisson curve with rate = median count rate of data. |
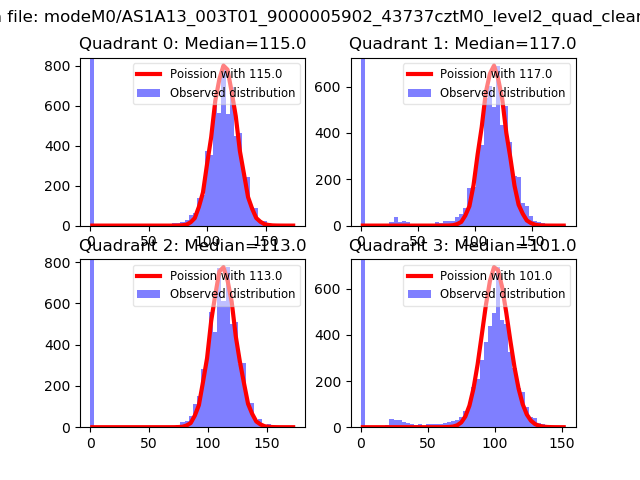 |
 |
| Quadrant-wise count rates Data is divided into 100 sec bins |
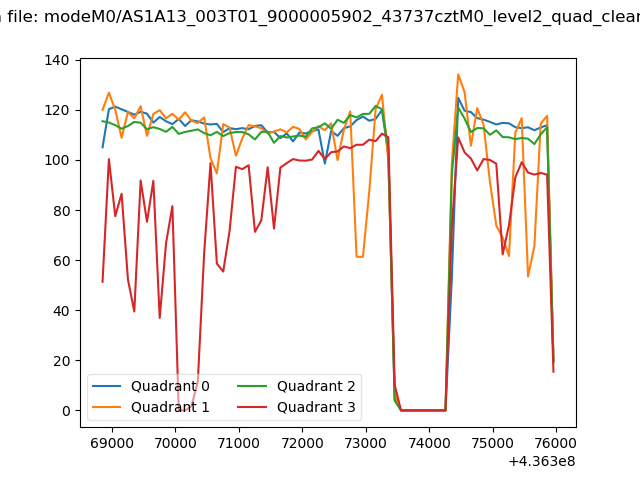 |
|
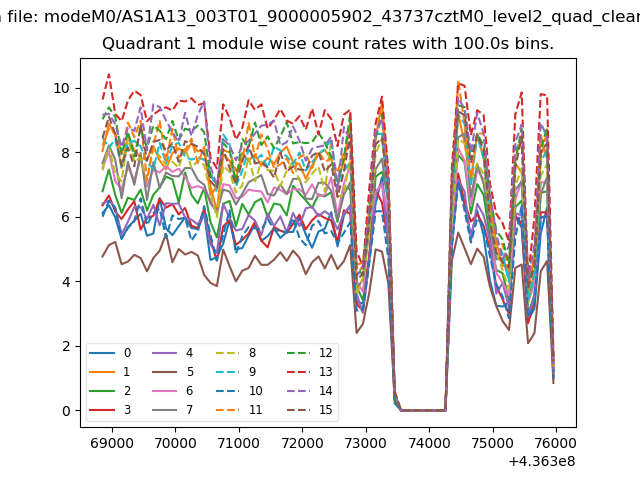
| Module-wise count rates for Quadrant A Data is divided into 100 sec bins |
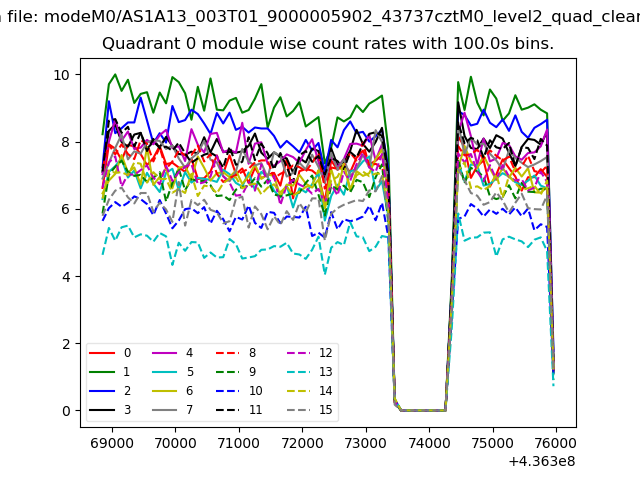 |
 |
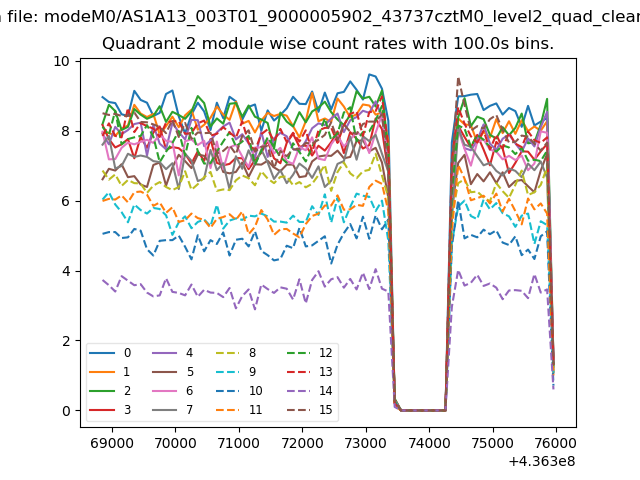
| Module-wise count rates for Quadrant B Data is divided into 100 sec bins |
 |
 |
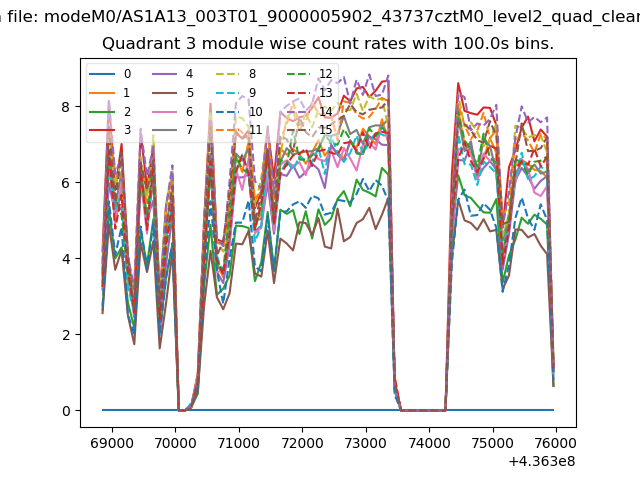
| Module-wise count rates for Quadrant C Data is divided into 100 sec bins |
 |
 |
| Module-wise count rates for Quadrant D Data is divided into 100 sec bins |
 |
 |
| Parameter | Plot |
|---|---|
| CZT HV Monitor | 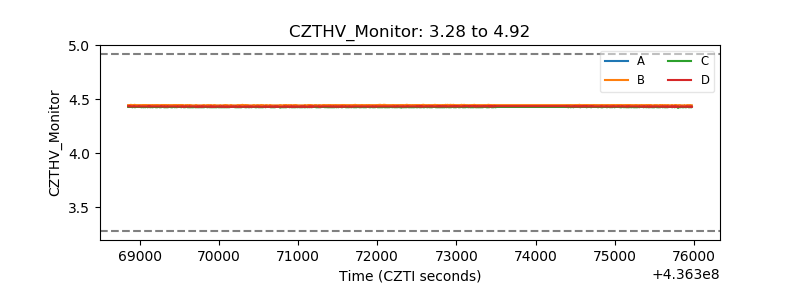 |
| D_VDD | 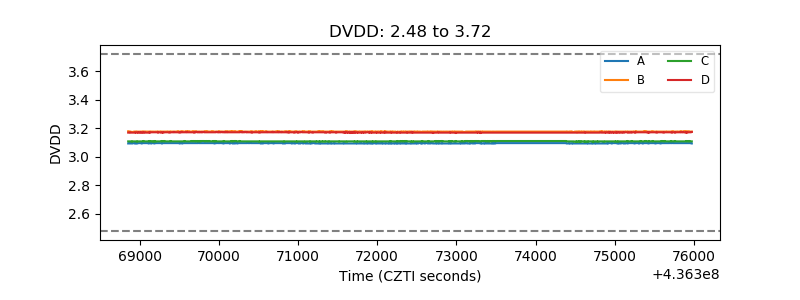 |
| Temperature 1 | 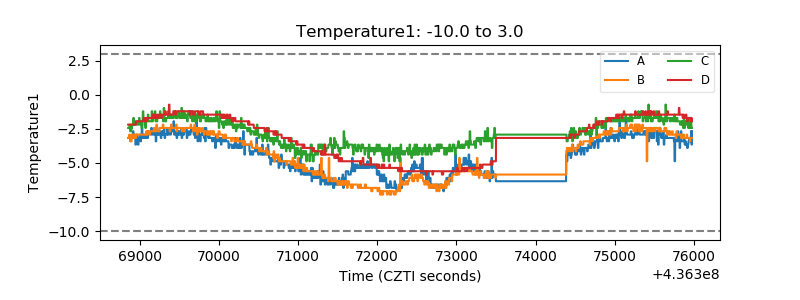 |
| Veto HV Monitor | 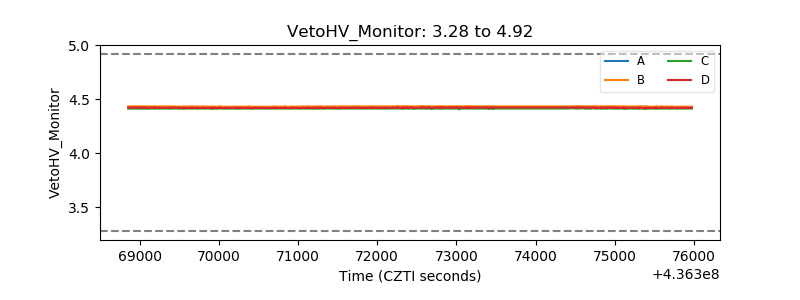 |
| Veto LLD | 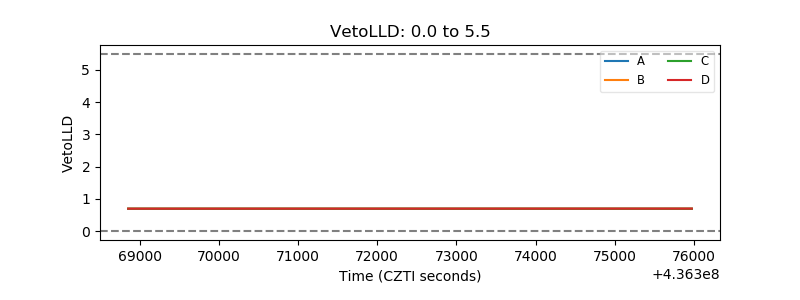 |
| Alpha Counter | 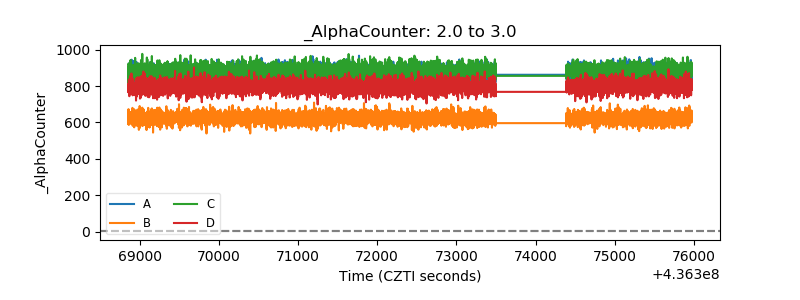 |
| _CPM_Rate | 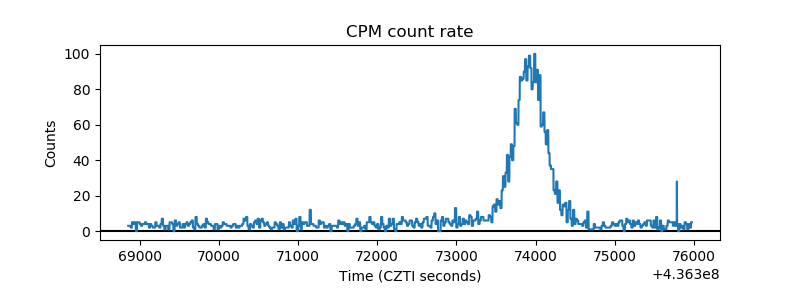 |
| CZT Counter |  |
| +2.5 Volts monitor | 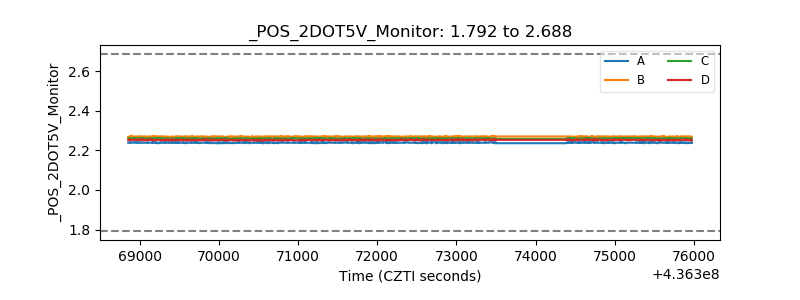 |
| +5 Volts monitor | 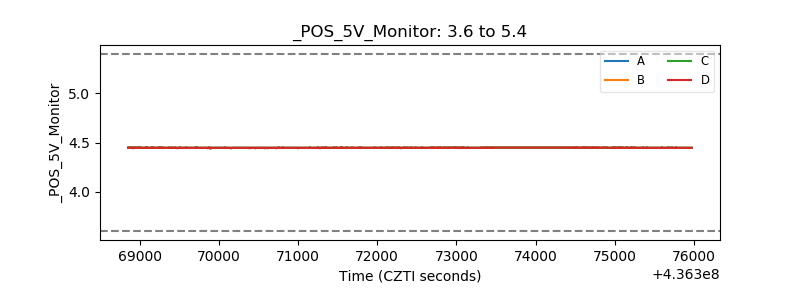 |
| _ROLL_ROT | 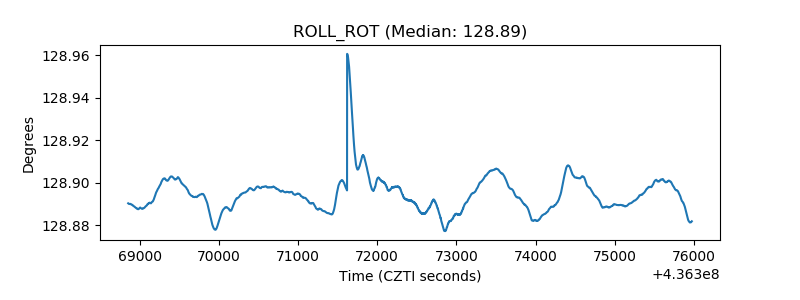 |
| _Roll_DEC | 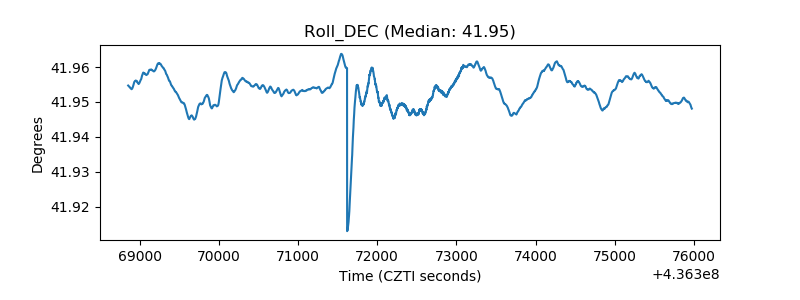 |
| _Roll_RA | 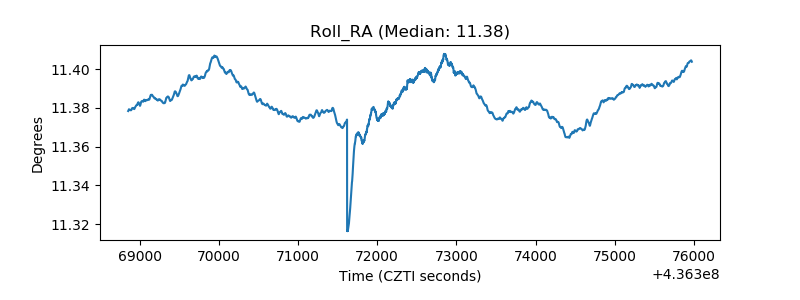 |
| Veto Counter | 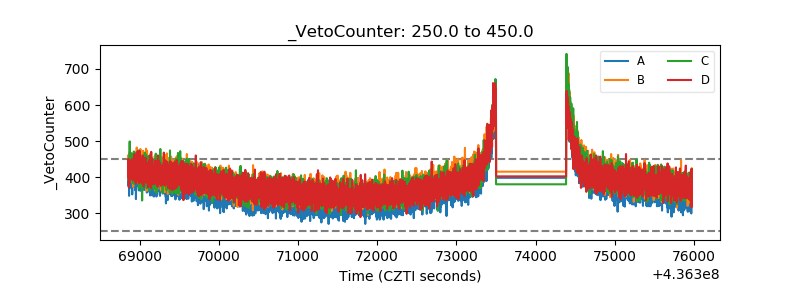 |