| Param | Original file | Final file |
|---|---|---|
| Filename | modeM0/AS1A13_003T01_9000005902_43741cztM0_level2.fits | modeM0/AS1A13_003T01_9000005902_43741cztM0_level2_quad_clean.evt |
| Size (bytes) | 621,144,000 | 119,862,720 |
| Size | 592.4 MB | 114.3 MB |
| Events in quadrant A | 4,764,375 | 825,873 |
| Events in quadrant B | 5,351,830 | 805,103 |
| Events in quadrant C | 5,126,035 | 790,618 |
| Events in quadrant D | 7,152,812 | 671,401 |
| Mode SS | |||
|---|---|---|---|
| Quadrant | BADHDUFLAG | Total packets | Discarded packets |
| A | 0 | 156 | 0 |
| B | 0 | 156 | 0 |
| C | 0 | 156 | 0 |
| D | 0 | 156 | 0 |
| Mode M0 | |||
|---|---|---|---|
| Quadrant | BADHDUFLAG | Total packets | Discarded packets |
| A | 0 | 19188 | 1 |
| B | 0 | 21232 | 1 |
| C | 0 | 20546 | 1 |
| D | 0 | 26615 | 1 |
| Mode M9 | |||
|---|---|---|---|
| Quadrant | BADHDUFLAG | Total packets | Discarded packets |
| A | 0 | 2 | 0 |
| B | 0 | 2 | 0 |
| C | 0 | 2 | 0 |
| D | 0 | 2 | 0 |
| Quadrant | Total seconds | Saturated seconds | Saturation percentage |
|---|---|---|---|
| A | 7706 | 130 | 1.686997% |
| B | 7706 | 590 | 7.656372% |
| C | 7707 | 447 | 5.799922% |
| D | 7706 | 986 | 12.795225% |
Noise dominated data is calculated using 1-second bins in cleaned event files. If a bin has >2000 counts, and if more than 50% of those come from <1% of pixels, then it is considered to be noise-dominated and hence unusable.
| Quadrant | # 1 sec bins | Bins with >0 counts | Bins with >2000 counts | High rate bins dominated by noise | Noise dominated (total time) | Noise dominated (detector-on time) | Marked lightcurve |
|---|---|---|---|---|---|---|---|
| A | 7896 | 7707 | 61 | 61 | 0.77% | 0.79% | 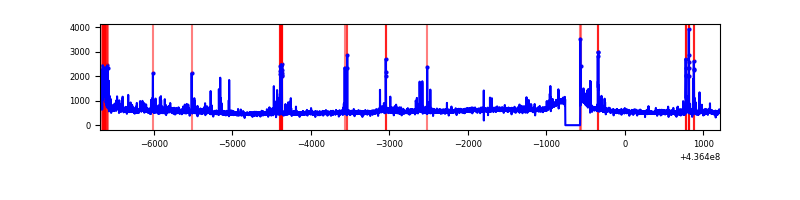 |
| B | 7896 | 7706 | 358 | 358 | 4.53% | 4.65% | 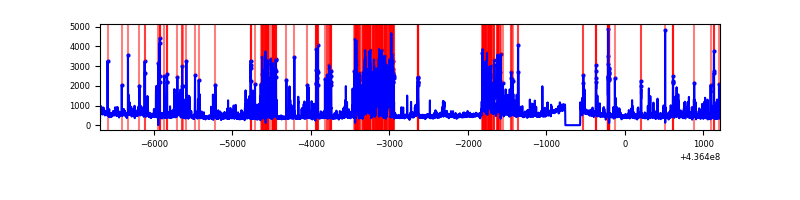 |
| C | 7897 | 7708 | 285 | 285 | 3.61% | 3.70% | 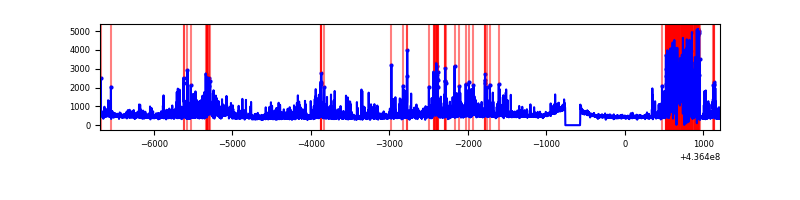 |
| D | 7896 | 7707 | 614 | 614 | 7.78% | 7.97% | 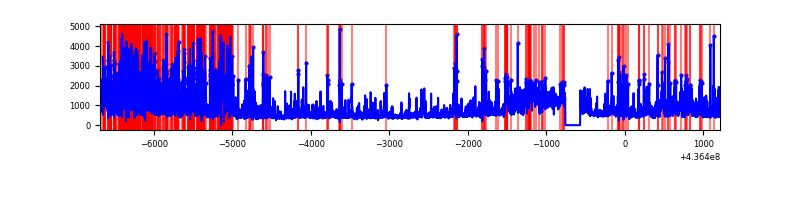 |
Top three noisy pixels from each quadrant. If the there are fewer than three noisy pixels in the level2.evt file, extra rows are filled as -1
| Pixel properties | Quadrant properties | ||||||
|---|---|---|---|---|---|---|---|
| Quadrant | DetID | PixID | Counts | Sigma | Mean | Median | Sigma |
| A | 10 | 83 | 903863 | 4983.54 | 860 | 839 | 181.2 |
| A | 15 | 223 | 239624 | 1317.79 | 860 | 839 | 181.2 |
| A | 15 | 174 | 111032 | 608.12 | 860 | 839 | 181.2 |
| B | 5 | 235 | 1486221 | 9065.74 | 833 | 804 | 163.8 |
| B | 0 | 200 | 189978 | 1154.56 | 833 | 804 | 163.8 |
| B | 4 | 80 | 174443 | 1059.75 | 833 | 804 | 163.8 |
| C | 15 | 174 | 835594 | 4253.5 | 826 | 829 | 196.3 |
| C | 15 | 158 | 674562 | 3432.97 | 826 | 829 | 196.3 |
| C | 15 | 157 | 134040 | 678.77 | 826 | 829 | 196.3 |
| D | 4 | 212 | 1316349 | 6385.82 | 802 | 777 | 206.0 |
| D | 8 | 48 | 476074 | 2307.1 | 802 | 777 | 206.0 |
| D | 5 | 235 | 406529 | 1969.53 | 802 | 777 | 206.0 |
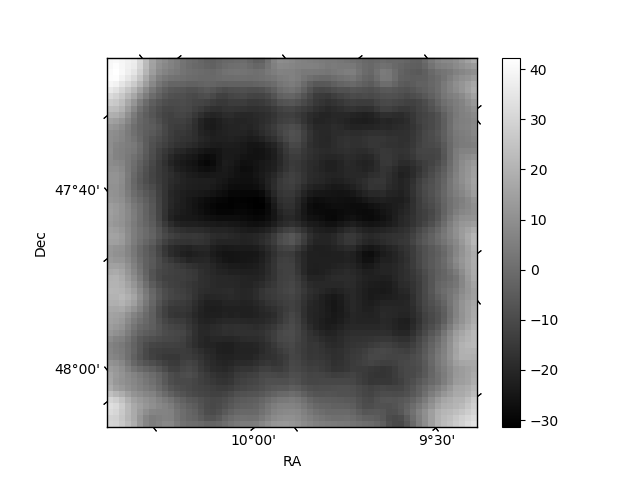
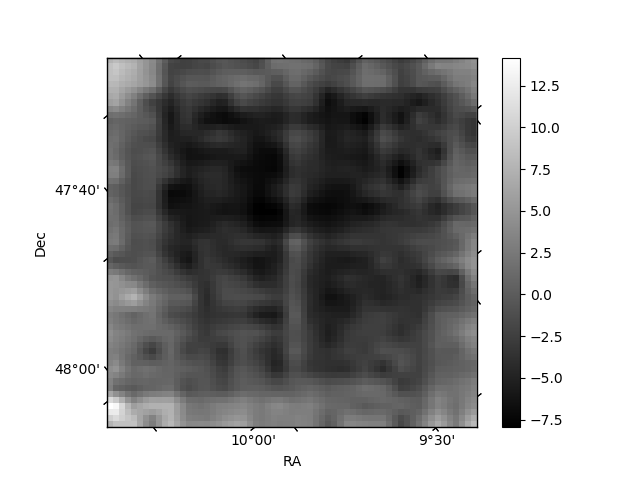
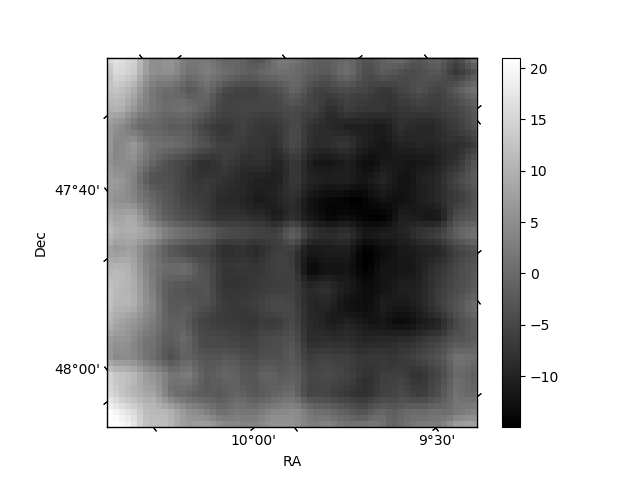
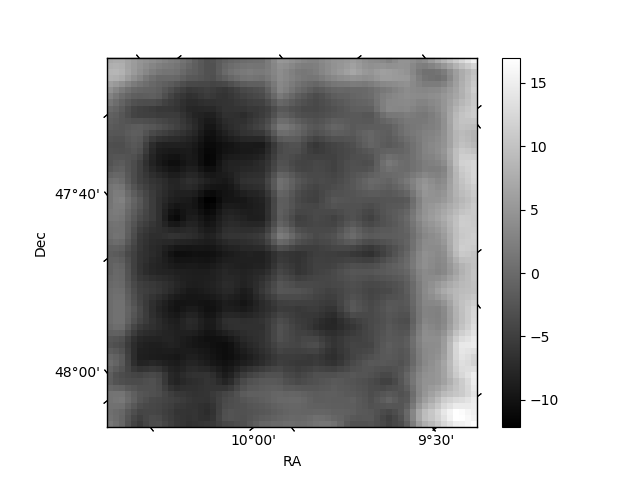
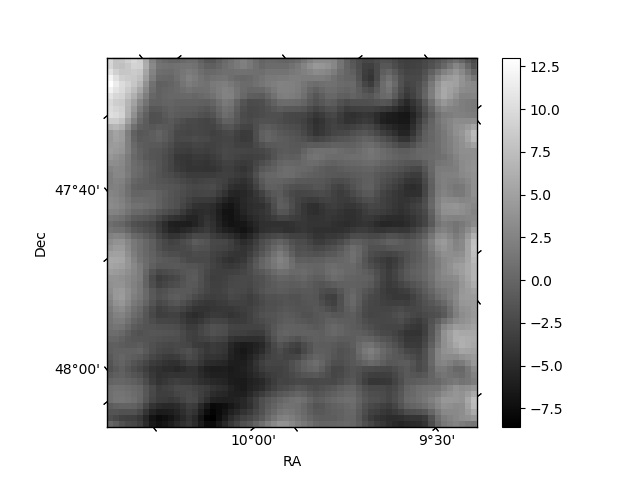
Histogram calculated using DETX and DETY for each event in the final _common_clean file
| Quadrant A | 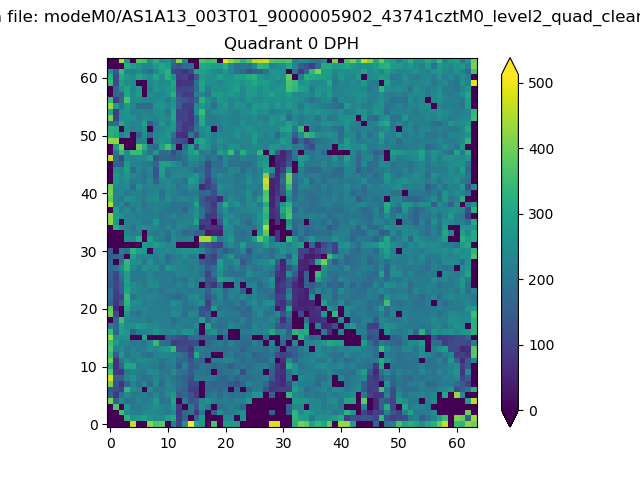 |
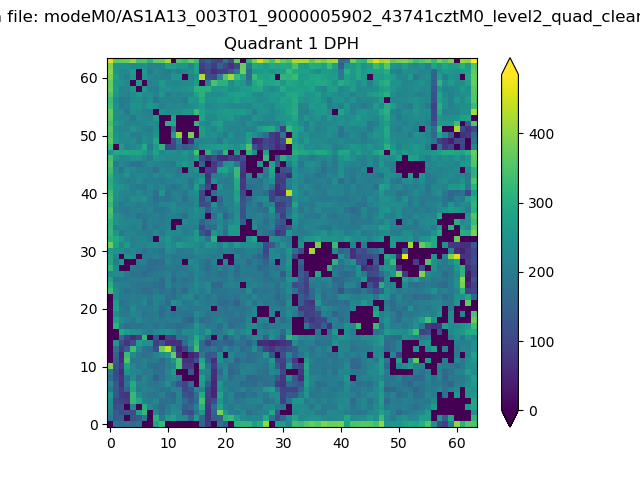 |
Quadrant B |
|---|---|---|---|
| Quadrant D | 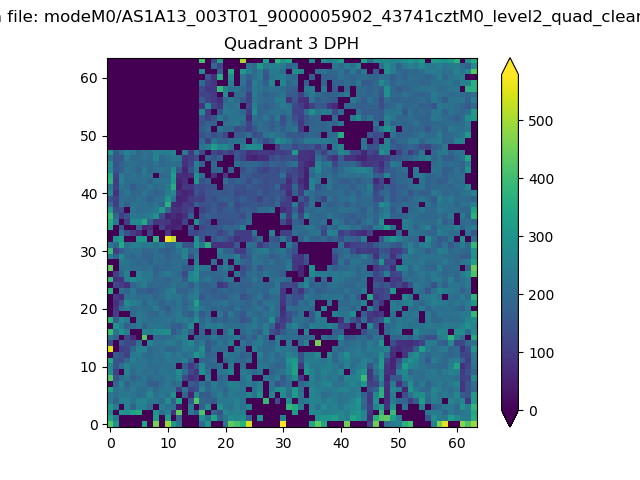 |
 |
Quadrant C |
| Plot type | Count rate plots | Images |
|---|---|---|
| Comparison with Poisson distribution Blue bars denote a histogram of data divided into 1 sec bins. Red curve is a Poisson curve with rate = median count rate of data. |
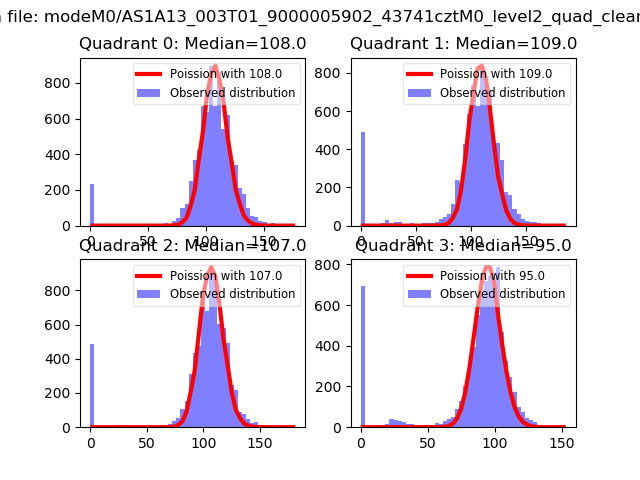 |
 |
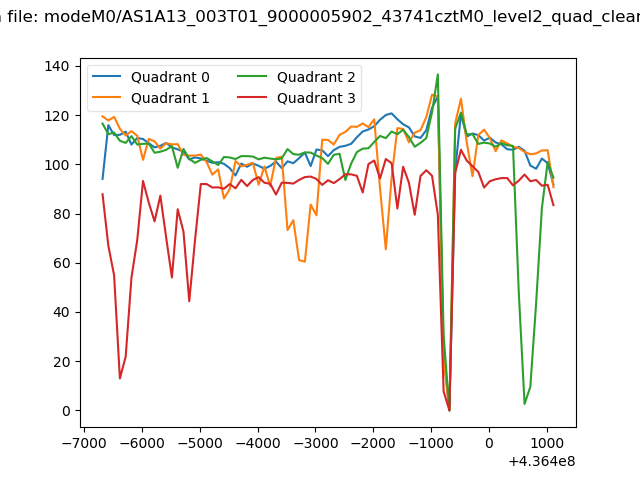
| Quadrant-wise count rates Data is divided into 100 sec bins |
 |
|
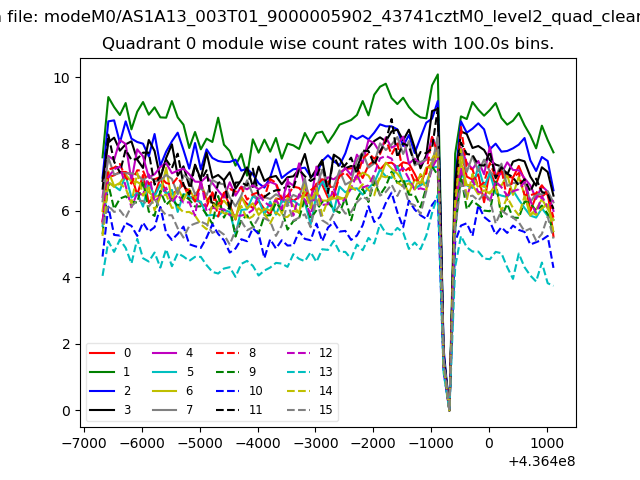
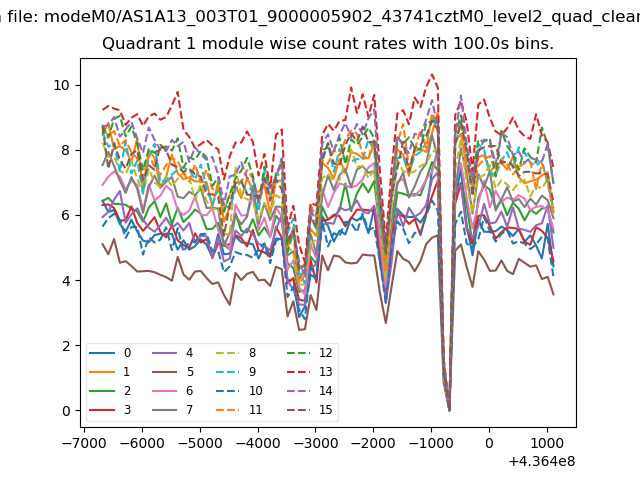
| Module-wise count rates for Quadrant A Data is divided into 100 sec bins |
 |
 |
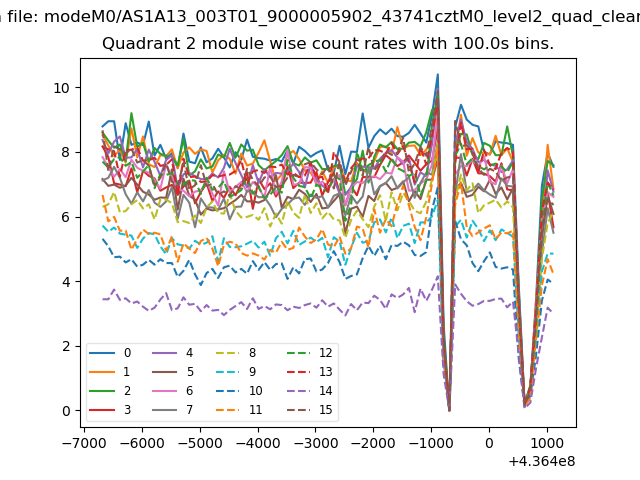
| Module-wise count rates for Quadrant B Data is divided into 100 sec bins |
 |
 |
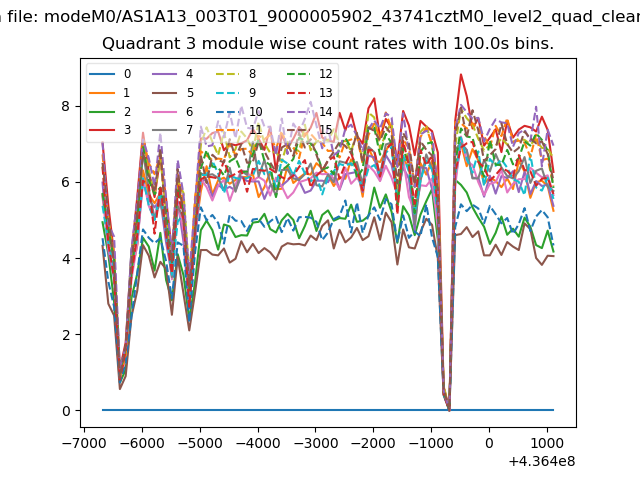
| Module-wise count rates for Quadrant C Data is divided into 100 sec bins |
 |
 |
| Module-wise count rates for Quadrant D Data is divided into 100 sec bins |
 |
 |
| Parameter | Plot |
|---|---|
| CZT HV Monitor | 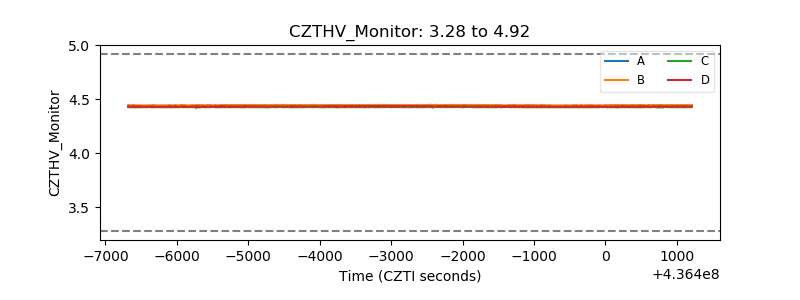 |
| D_VDD | 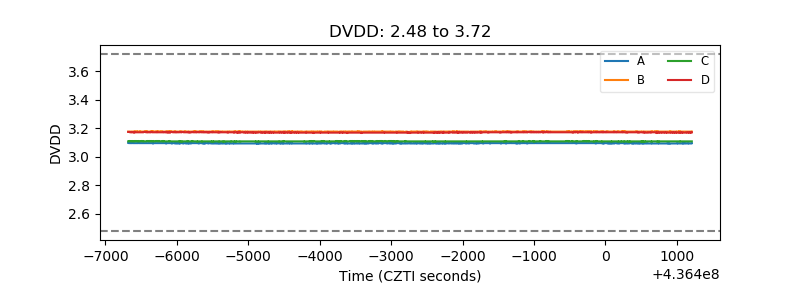 |
| Temperature 1 | 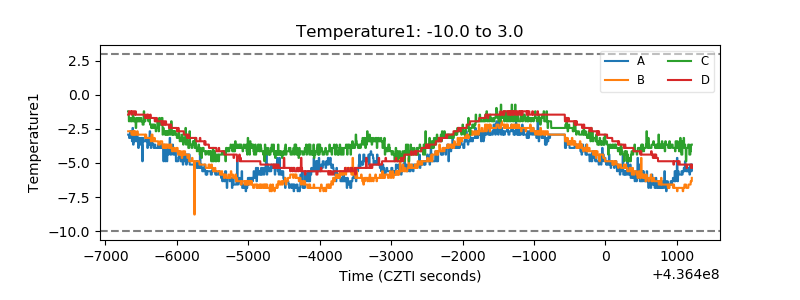 |
| Veto HV Monitor | 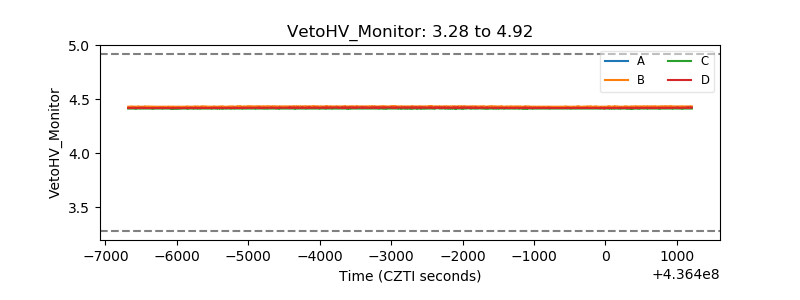 |
| Veto LLD | 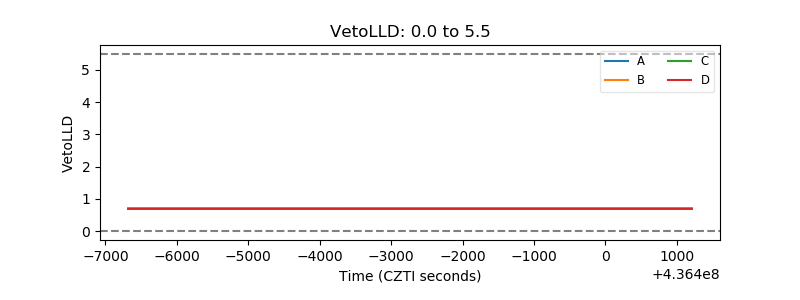 |
| Alpha Counter | 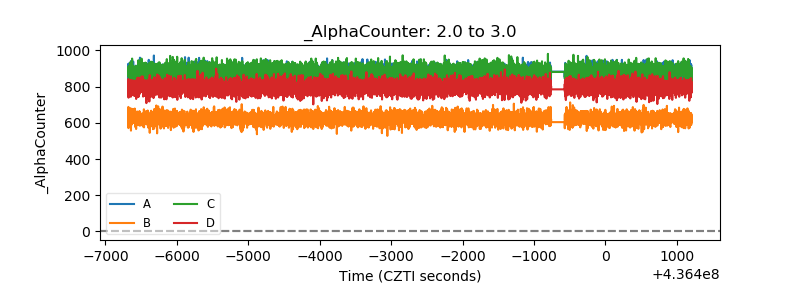 |
| _CPM_Rate | 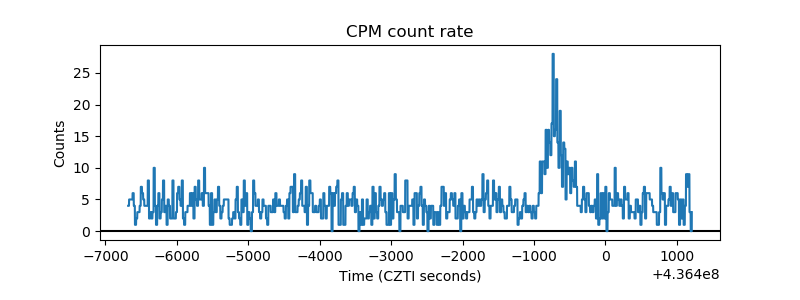 |
| CZT Counter | 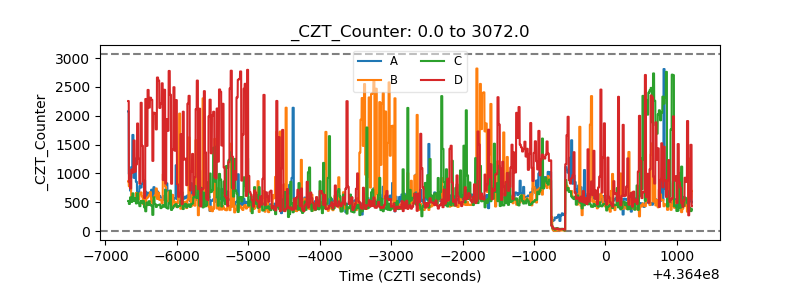 |
| +2.5 Volts monitor | 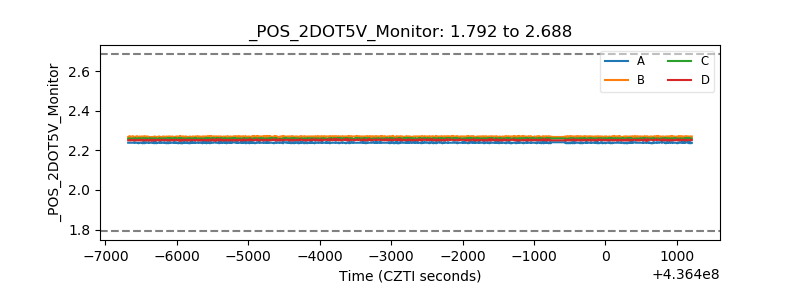 |
| +5 Volts monitor | 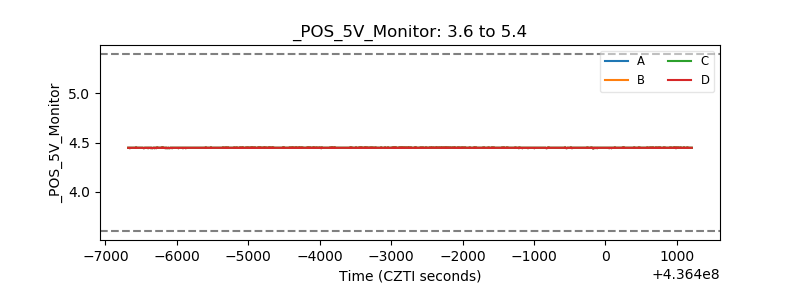 |
| _ROLL_ROT | 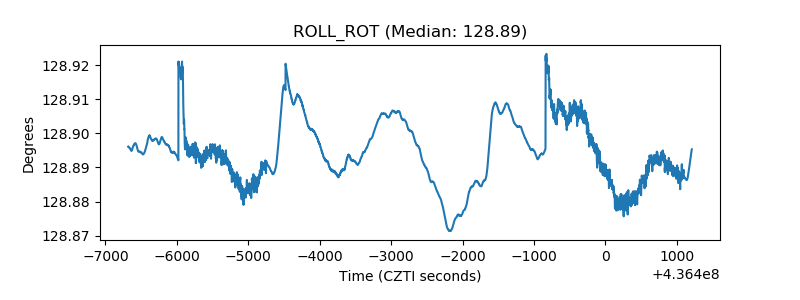 |
| _Roll_DEC | 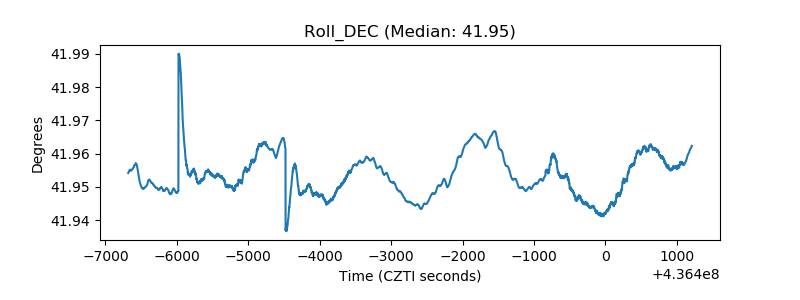 |
| _Roll_RA | 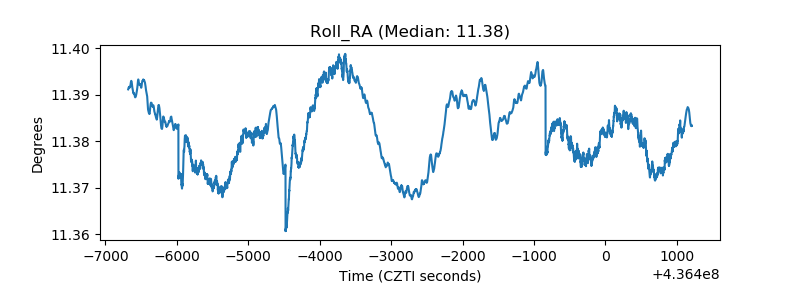 |
| Veto Counter | 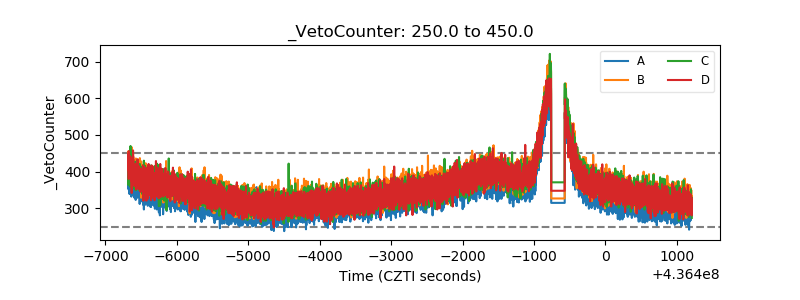 |