| Param | Original file | Final file |
|---|---|---|
| Filename | modeM0/AS1A13_003T01_9000005902_43743cztM0_level2.fits | modeM0/AS1A13_003T01_9000005902_43743cztM0_level2_quad_clean.evt |
| Size (bytes) | 1,003,063,680 | 198,797,760 |
| Size | 956.6 MB | 189.6 MB |
| Events in quadrant A | 10,093,651 | 1,284,572 |
| Events in quadrant B | 8,577,060 | 1,315,928 |
| Events in quadrant C | 7,551,497 | 1,329,588 |
| Events in quadrant D | 9,907,347 | 1,195,320 |
| Mode SS | |||
|---|---|---|---|
| Quadrant | BADHDUFLAG | Total packets | Discarded packets |
| A | 0 | 260 | 0 |
| B | 0 | 260 | 0 |
| C | 0 | 260 | 0 |
| D | 0 | 260 | 0 |
| Mode M0 | |||
|---|---|---|---|
| Quadrant | BADHDUFLAG | Total packets | Discarded packets |
| A | 0 | 38505 | 2 |
| B | 0 | 34410 | 2 |
| C | 0 | 31547 | 3 |
| D | 0 | 38588 | 2 |
| Mode M9 | |||
|---|---|---|---|
| Quadrant | BADHDUFLAG | Total packets | Discarded packets |
| A | 0 | 12 | 0 |
| B | 0 | 12 | 0 |
| C | 0 | 12 | 0 |
| D | 0 | 12 | 0 |
| Quadrant | Total seconds | Saturated seconds | Saturation percentage |
|---|---|---|---|
| A | 12933 | 998 | 7.716694% |
| B | 12933 | 831 | 6.425423% |
| C | 12932 | 467 | 3.611197% |
| D | 12932 | 621 | 4.802041% |
Noise dominated data is calculated using 1-second bins in cleaned event files. If a bin has >2000 counts, and if more than 50% of those come from <1% of pixels, then it is considered to be noise-dominated and hence unusable.
| Quadrant | # 1 sec bins | Bins with >0 counts | Bins with >2000 counts | High rate bins dominated by noise | Noise dominated (total time) | Noise dominated (detector-on time) | Marked lightcurve |
|---|---|---|---|---|---|---|---|
| A | 14073 | 12935 | 773 | 773 | 5.49% | 5.98% | 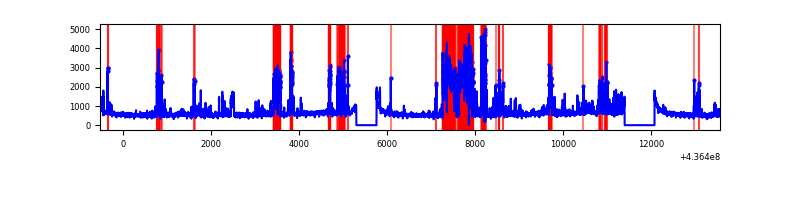 |
| B | 14073 | 12935 | 552 | 552 | 3.92% | 4.27% | 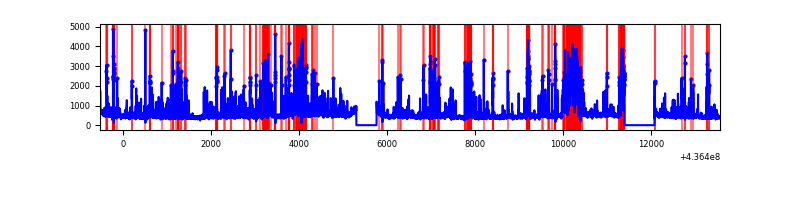 |
| C | 14072 | 12934 | 317 | 317 | 2.25% | 2.45% | 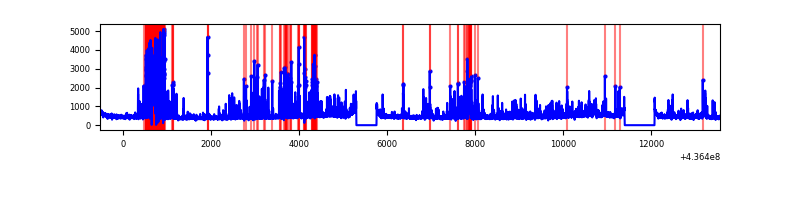 |
| D | 14072 | 12934 | 457 | 457 | 3.25% | 3.53% | 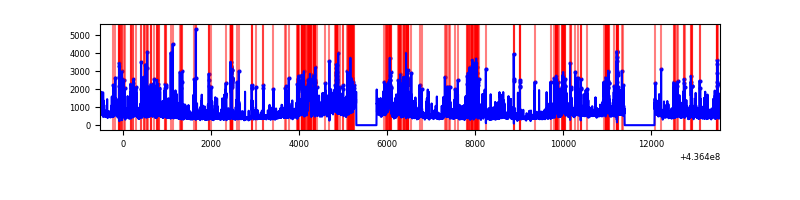 |
Top three noisy pixels from each quadrant. If the there are fewer than three noisy pixels in the level2.evt file, extra rows are filled as -1
| Pixel properties | Quadrant properties | ||||||
|---|---|---|---|---|---|---|---|
| Quadrant | DetID | PixID | Counts | Sigma | Mean | Median | Sigma |
| A | 15 | 174 | 2101180 | 7300.29 | 1387 | 1358 | 287.6 |
| A | 10 | 83 | 1561895 | 5425.4 | 1387 | 1358 | 287.6 |
| A | 15 | 223 | 470551 | 1631.21 | 1387 | 1358 | 287.6 |
| B | 5 | 235 | 1725551 | 6268.44 | 1390 | 1348 | 275.1 |
| B | 0 | 200 | 850483 | 3087.08 | 1390 | 1348 | 275.1 |
| B | 5 | 172 | 189635 | 684.53 | 1390 | 1348 | 275.1 |
| C | 15 | 174 | 799587 | 2439.84 | 1386 | 1393 | 327.2 |
| C | 15 | 158 | 662378 | 2020.43 | 1386 | 1393 | 327.2 |
| C | 3 | 233 | 303271 | 922.75 | 1386 | 1393 | 327.2 |
| D | 1 | 52 | 830037 | 2205.28 | 1371 | 1342 | 375.8 |
| D | 7 | 80 | 548492 | 1456.05 | 1371 | 1342 | 375.8 |
| D | 5 | 235 | 533019 | 1414.87 | 1371 | 1342 | 375.8 |
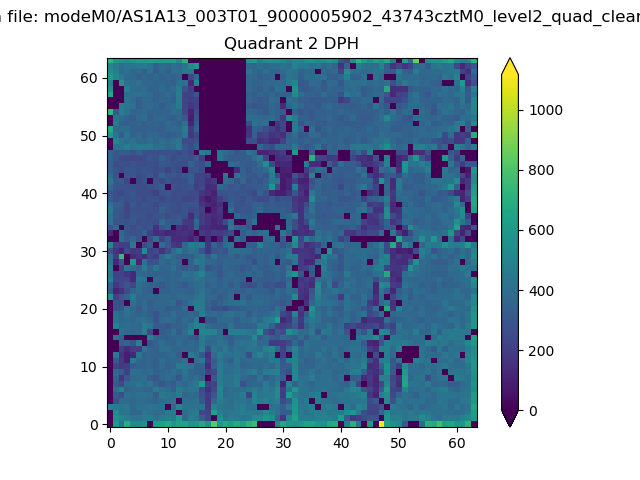
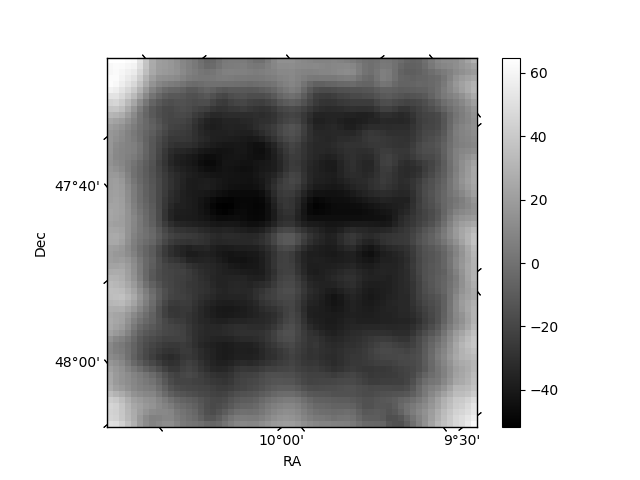
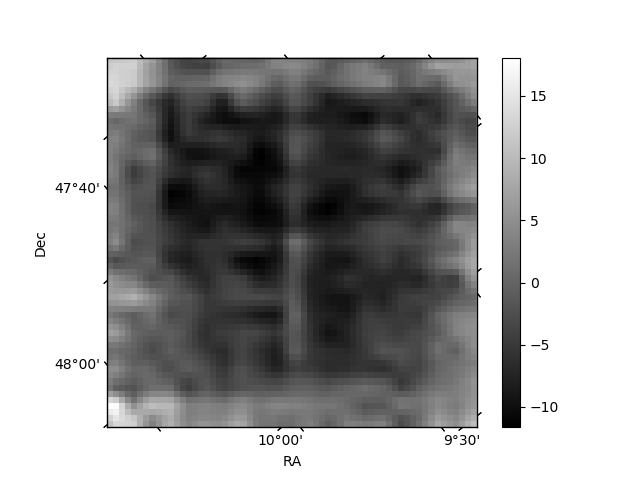
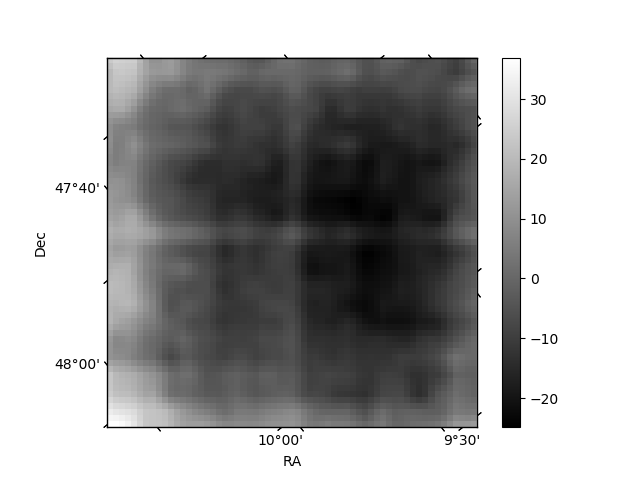
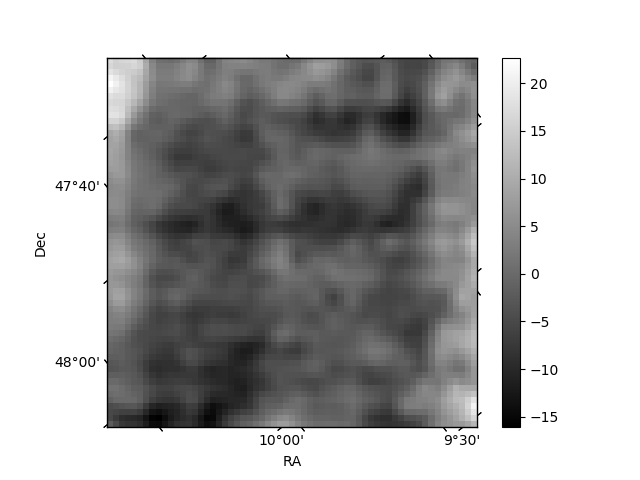
Histogram calculated using DETX and DETY for each event in the final _common_clean file
| Quadrant A | 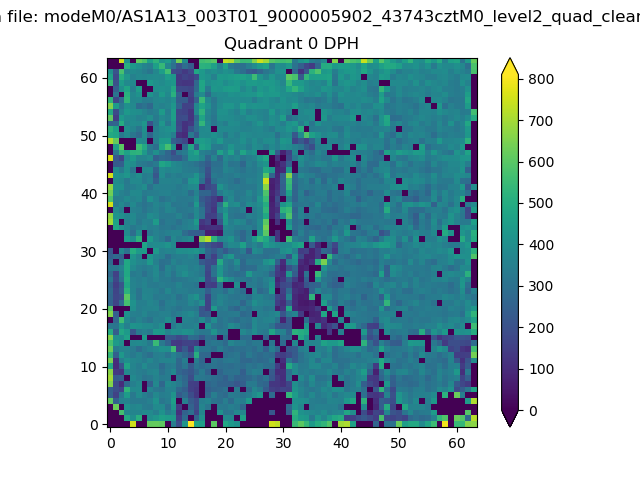 |
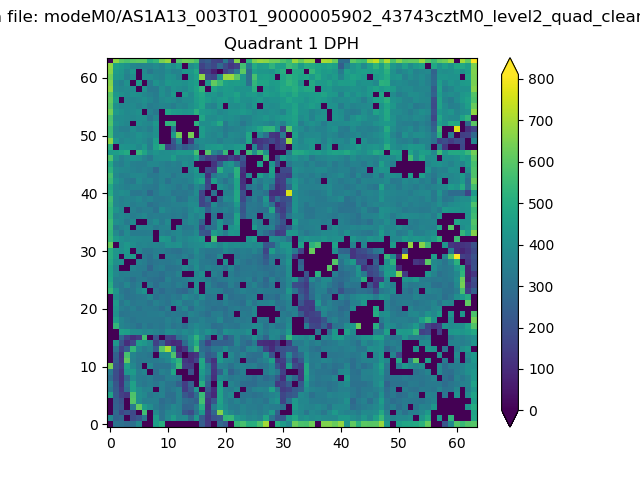 |
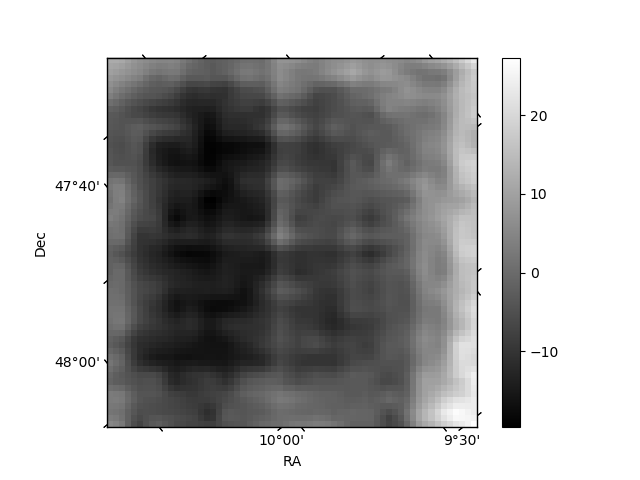
Quadrant B |
|---|---|---|---|
| Quadrant D | 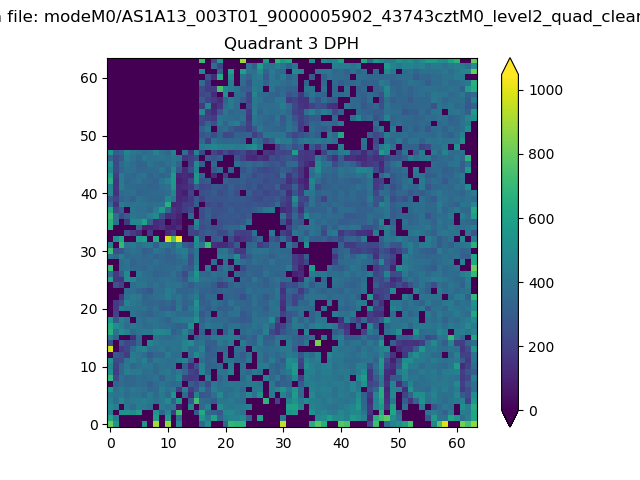 |
 |
Quadrant C |
| Plot type | Count rate plots | Images |
|---|---|---|
| Comparison with Poisson distribution Blue bars denote a histogram of data divided into 1 sec bins. Red curve is a Poisson curve with rate = median count rate of data. |
 |
 |
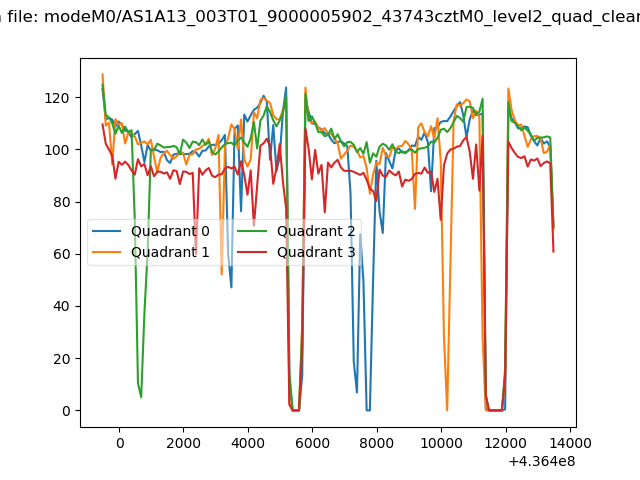
| Quadrant-wise count rates Data is divided into 100 sec bins |
 |
|
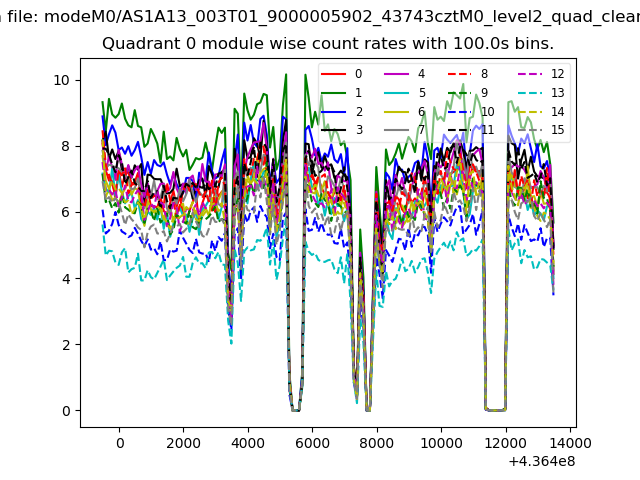
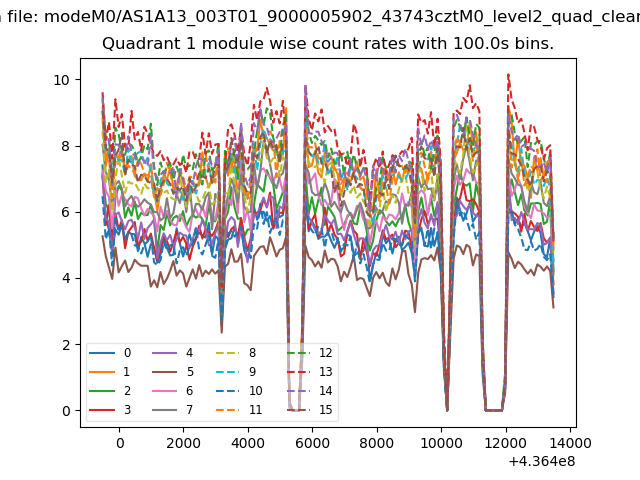
| Module-wise count rates for Quadrant A Data is divided into 100 sec bins |
 |
 |
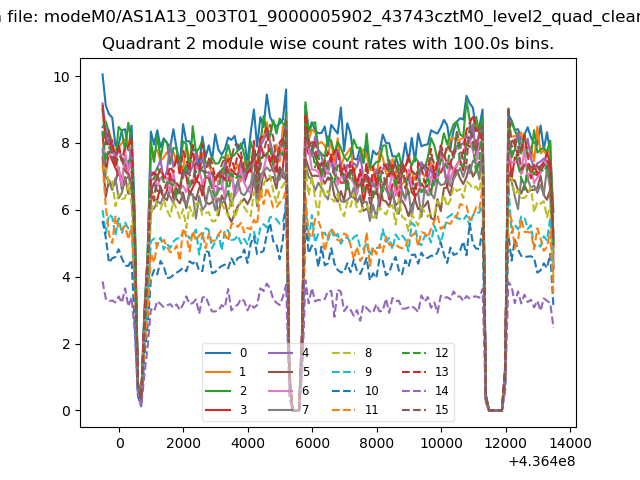
| Module-wise count rates for Quadrant B Data is divided into 100 sec bins |
 |
 |
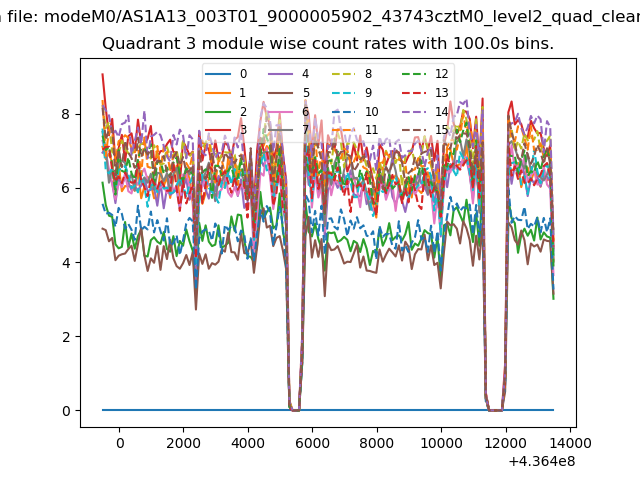
| Module-wise count rates for Quadrant C Data is divided into 100 sec bins |
 |
 |
| Module-wise count rates for Quadrant D Data is divided into 100 sec bins |
 |
 |
| Parameter | Plot |
|---|---|
| CZT HV Monitor | 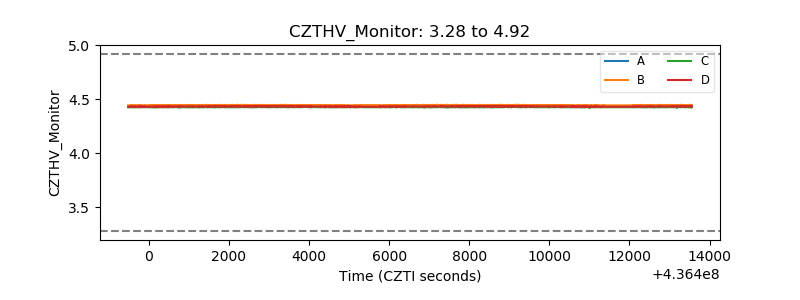 |
| D_VDD |  |
| Temperature 1 | 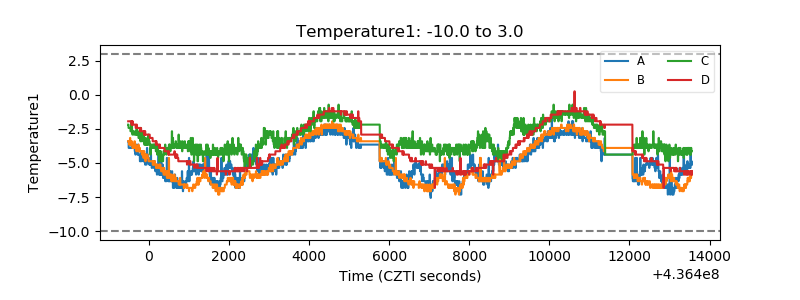 |
| Veto HV Monitor | 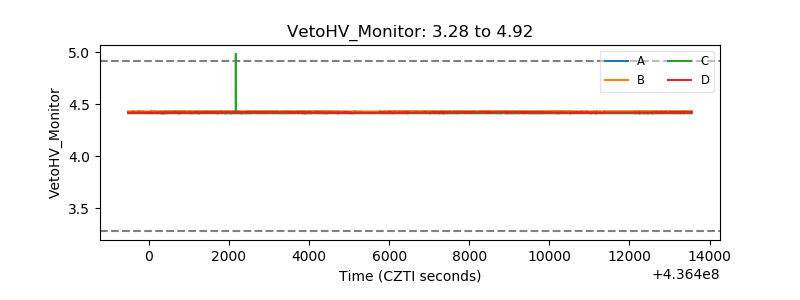 |
| Veto LLD | 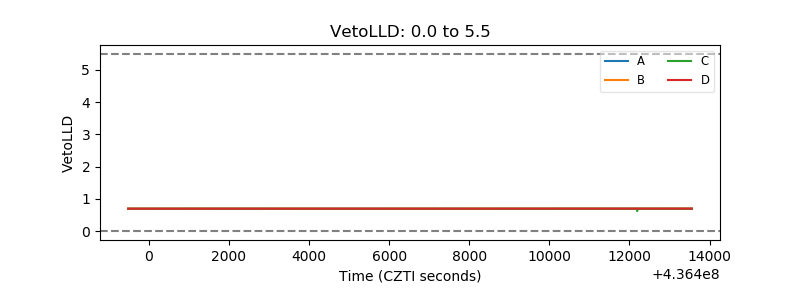 |
| Alpha Counter | 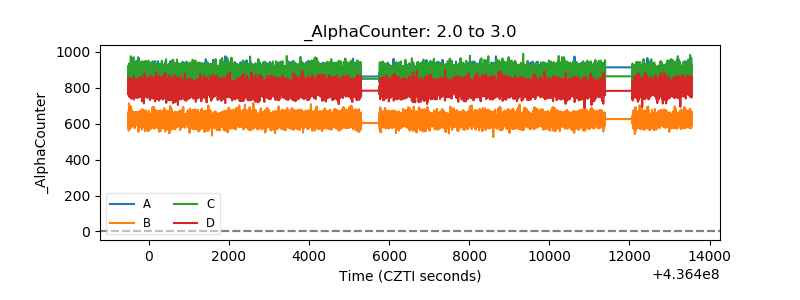 |
| _CPM_Rate | 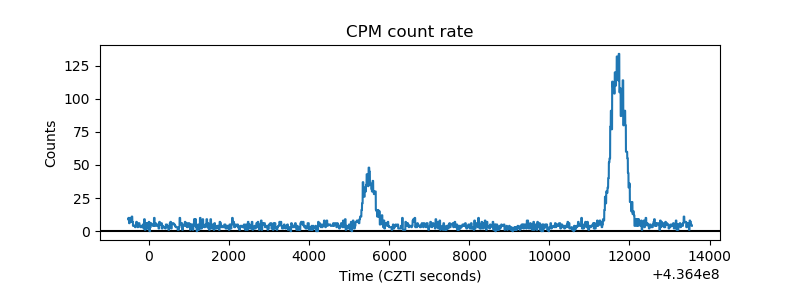 |
| CZT Counter | 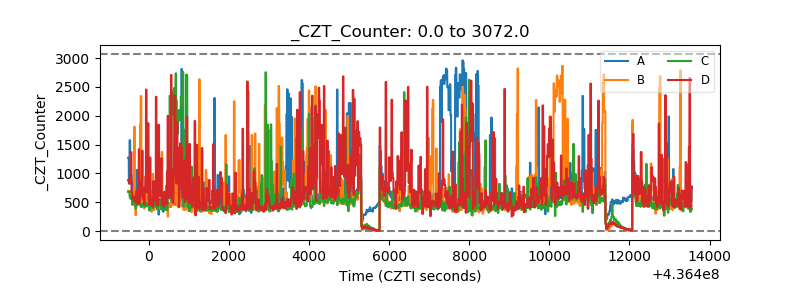 |
| +2.5 Volts monitor | 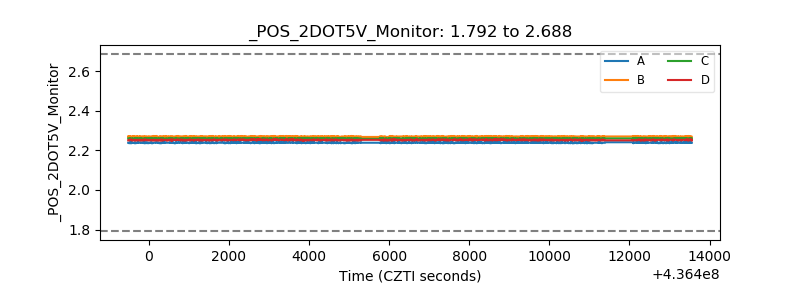 |
| +5 Volts monitor | 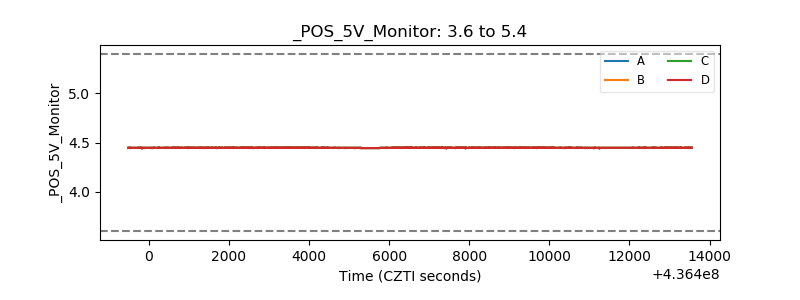 |
| _ROLL_ROT | 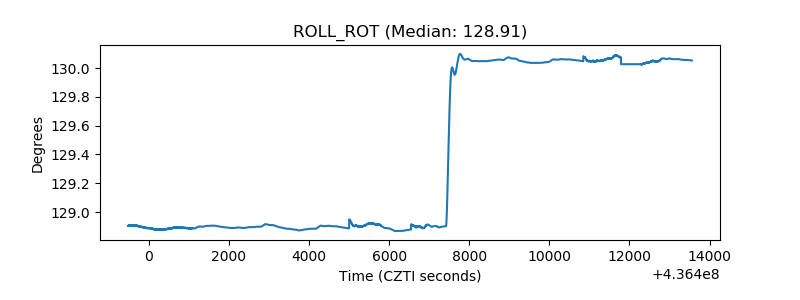 |
| _Roll_DEC | 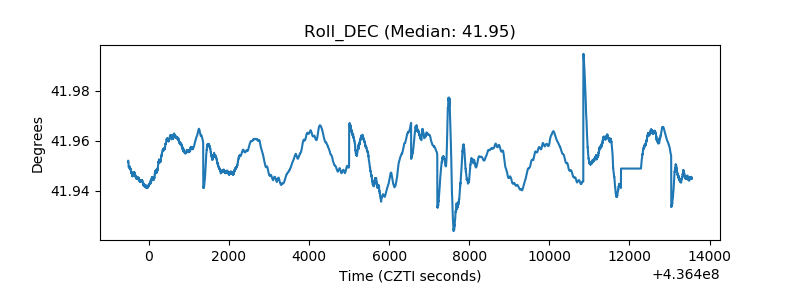 |
| _Roll_RA | 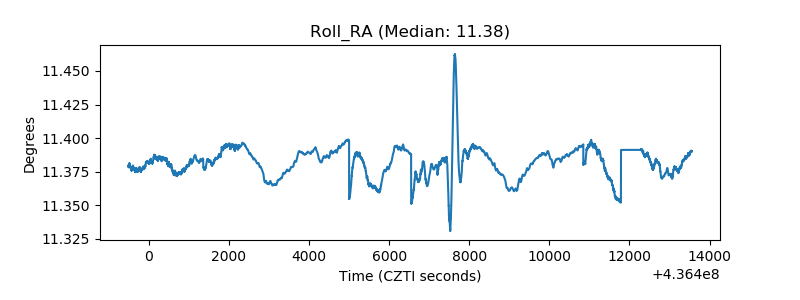 |
| Veto Counter | 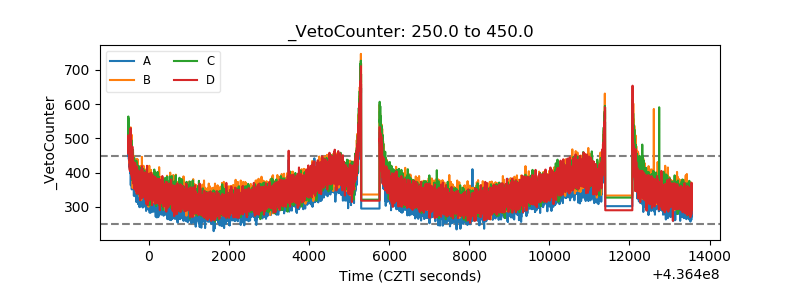 |