| Param | Original file | Final file |
|---|---|---|
| Filename | modeM0/AS1A13_003T01_9000005902_43744cztM0_level2.fits | modeM0/AS1A13_003T01_9000005902_43744cztM0_level2_quad_clean.evt |
| Size (bytes) | 474,425,280 | 107,435,520 |
| Size | 452.4 MB | 102.5 MB |
| Events in quadrant A | 4,004,985 | 715,542 |
| Events in quadrant B | 3,678,179 | 728,012 |
| Events in quadrant C | 3,733,082 | 718,603 |
| Events in quadrant D | 5,622,314 | 621,336 |
| Mode SS | |||
|---|---|---|---|
| Quadrant | BADHDUFLAG | Total packets | Discarded packets |
| A | 0 | 136 | 0 |
| B | 0 | 136 | 0 |
| C | 0 | 136 | 0 |
| D | 0 | 136 | 0 |
| Mode M0 | |||
|---|---|---|---|
| Quadrant | BADHDUFLAG | Total packets | Discarded packets |
| A | 0 | 16098 | 1 |
| B | 0 | 15600 | 1 |
| C | 0 | 15806 | 1 |
| D | 0 | 21359 | 1 |
| Mode M9 | |||
|---|---|---|---|
| Quadrant | BADHDUFLAG | Total packets | Discarded packets |
| A | 0 | 9 | 0 |
| B | 0 | 9 | 0 |
| C | 0 | 9 | 0 |
| D | 0 | 9 | 0 |
| Quadrant | Total seconds | Saturated seconds | Saturation percentage |
|---|---|---|---|
| A | 6736 | 58 | 0.861045% |
| B | 6737 | 177 | 2.627282% |
| C | 6737 | 63 | 0.935134% |
| D | 6737 | 478 | 7.095146% |
Noise dominated data is calculated using 1-second bins in cleaned event files. If a bin has >2000 counts, and if more than 50% of those come from <1% of pixels, then it is considered to be noise-dominated and hence unusable.
| Quadrant | # 1 sec bins | Bins with >0 counts | Bins with >2000 counts | High rate bins dominated by noise | Noise dominated (total time) | Noise dominated (detector-on time) | Marked lightcurve |
|---|---|---|---|---|---|---|---|
| A | 7596 | 6737 | 8 | 8 | 0.11% | 0.12% | 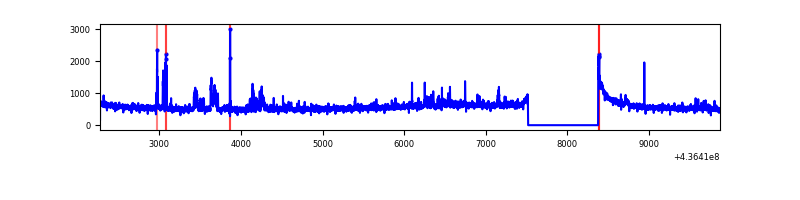 |
| B | 7597 | 6738 | 80 | 80 | 1.05% | 1.19% | 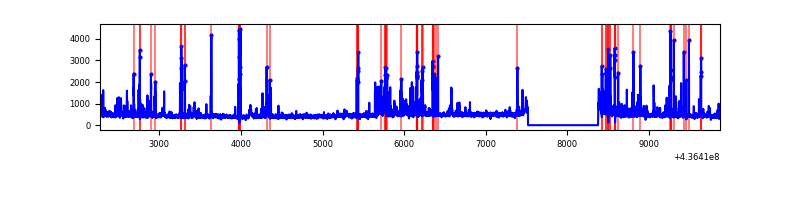 |
| C | 7597 | 6738 | 52 | 52 | 0.68% | 0.77% | 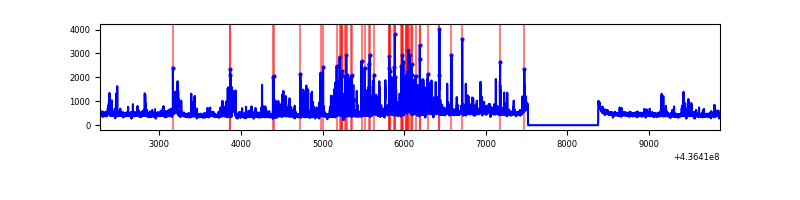 |
| D | 7597 | 6738 | 366 | 366 | 4.82% | 5.43% | 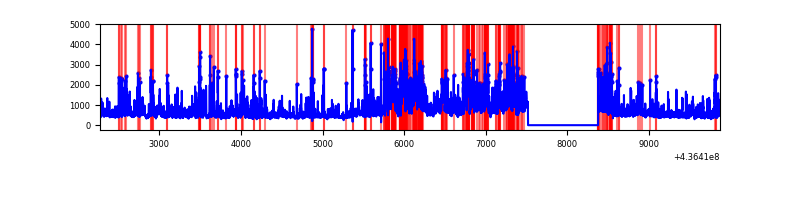 |
Top three noisy pixels from each quadrant. If the there are fewer than three noisy pixels in the level2.evt file, extra rows are filled as -1
| Pixel properties | Quadrant properties | ||||||
|---|---|---|---|---|---|---|---|
| Quadrant | DetID | PixID | Counts | Sigma | Mean | Median | Sigma |
| A | 10 | 83 | 866044 | 5619.06 | 742 | 726 | 154.0 |
| A | 14 | 63 | 156752 | 1013.18 | 742 | 726 | 154.0 |
| A | 15 | 174 | 41928 | 267.55 | 742 | 726 | 154.0 |
| B | 5 | 235 | 356618 | 2444.64 | 739 | 715 | 145.6 |
| B | 4 | 80 | 125840 | 859.46 | 739 | 715 | 145.6 |
| B | 4 | 171 | 94020 | 640.9 | 739 | 715 | 145.6 |
| C | 15 | 158 | 388795 | 2220.08 | 732 | 736 | 174.8 |
| C | 3 | 233 | 238081 | 1357.85 | 732 | 736 | 174.8 |
| C | 14 | 96 | 79955 | 453.21 | 732 | 736 | 174.8 |
| D | 1 | 52 | 864025 | 4758.98 | 711 | 690 | 181.4 |
| D | 13 | 249 | 231838 | 1274.16 | 711 | 690 | 181.4 |
| D | 7 | 80 | 215199 | 1182.44 | 711 | 690 | 181.4 |
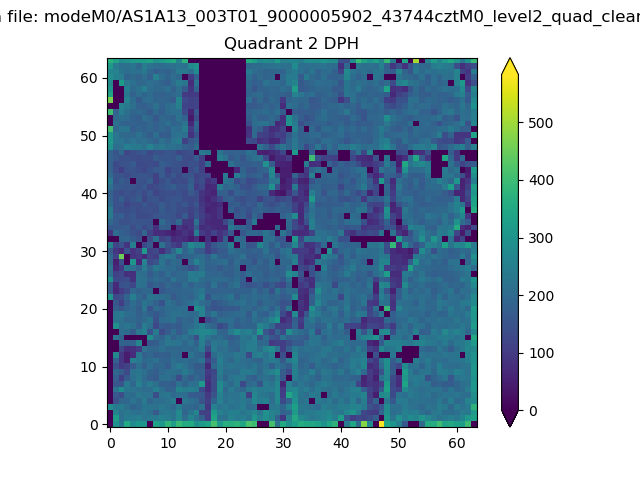
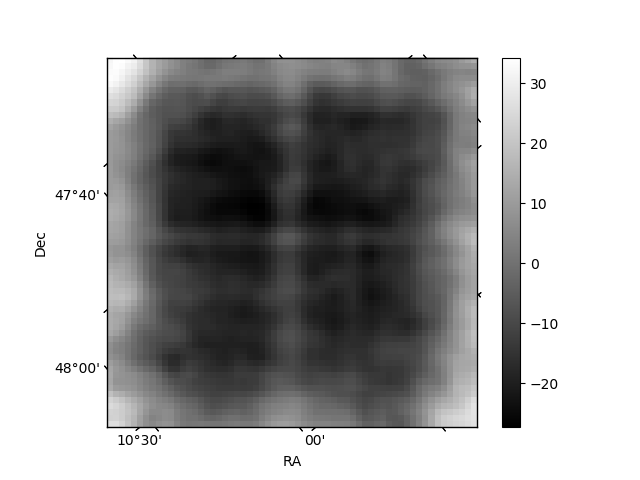
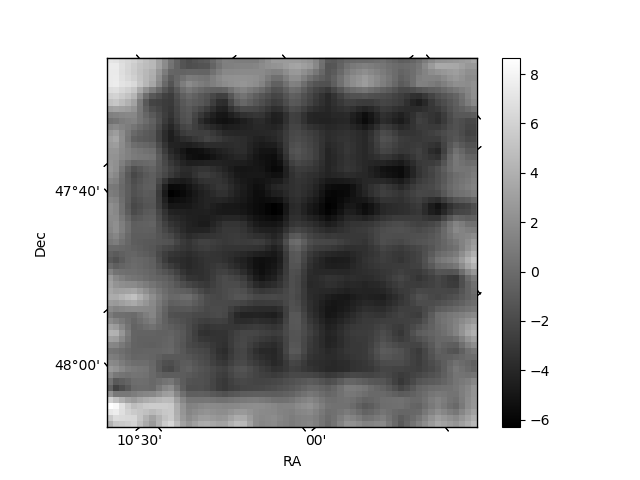
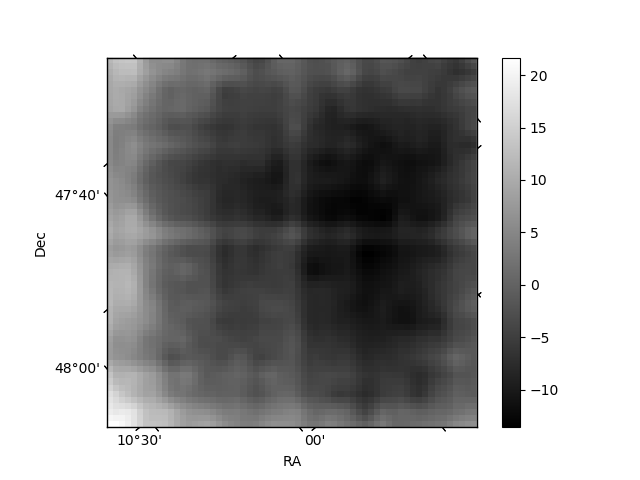
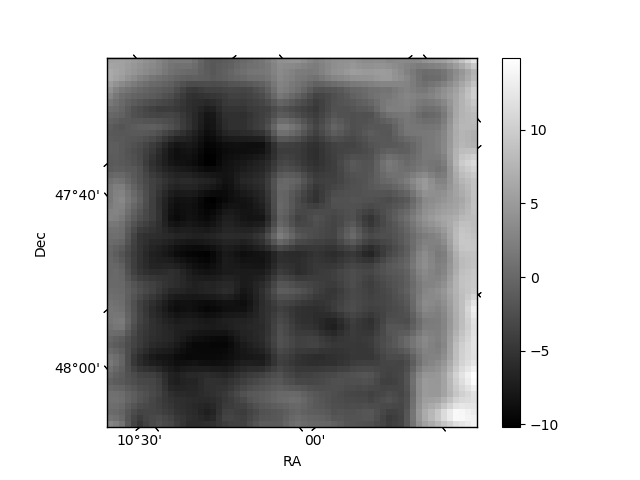
Histogram calculated using DETX and DETY for each event in the final _common_clean file
| Quadrant A | 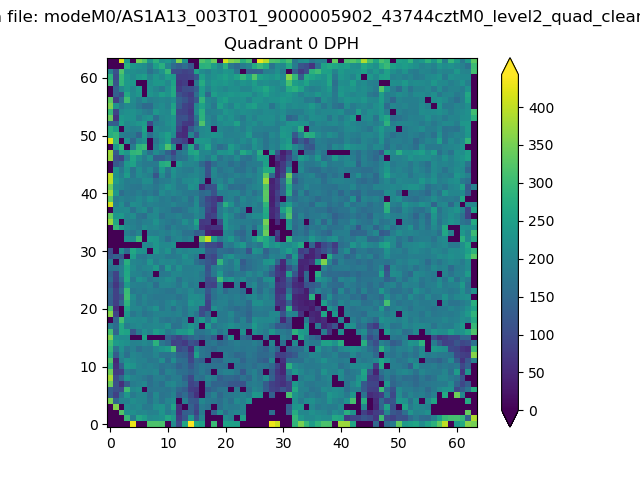 |
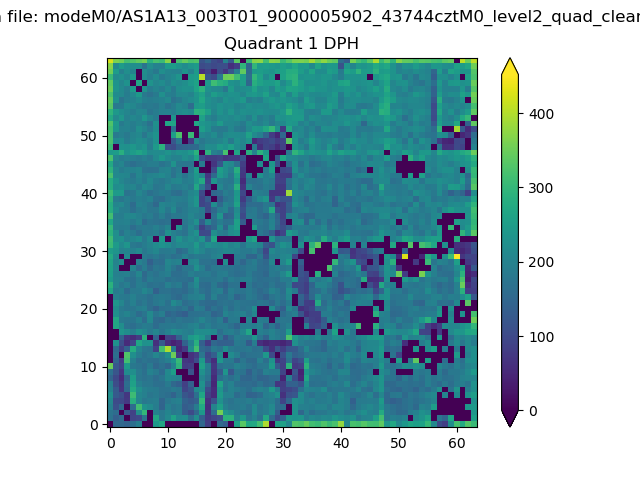 |
Quadrant B |
|---|---|---|---|
| Quadrant D | 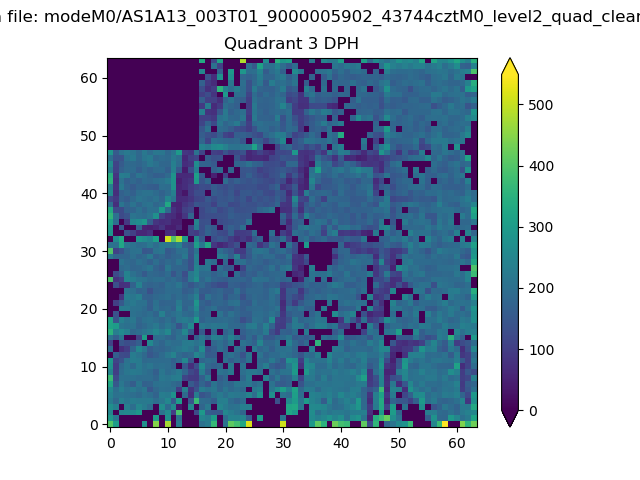 |
 |
Quadrant C |
| Plot type | Count rate plots | Images |
|---|---|---|
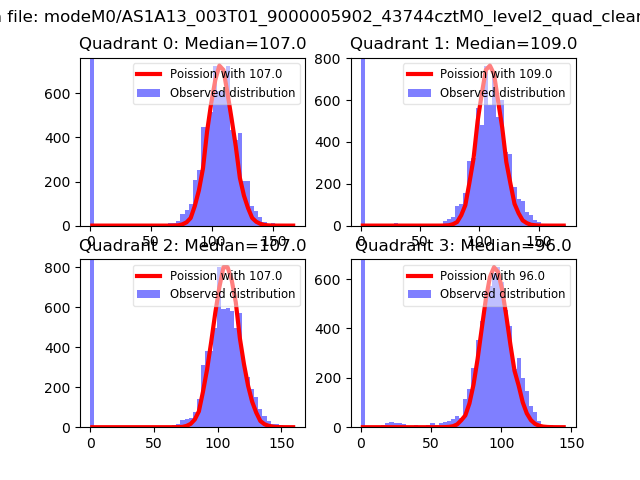
| Comparison with Poisson distribution Blue bars denote a histogram of data divided into 1 sec bins. Red curve is a Poisson curve with rate = median count rate of data. |
 |
 |
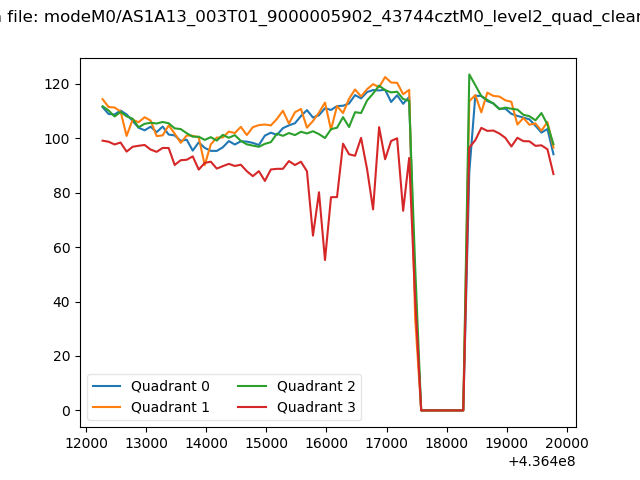
| Quadrant-wise count rates Data is divided into 100 sec bins |
 |
|
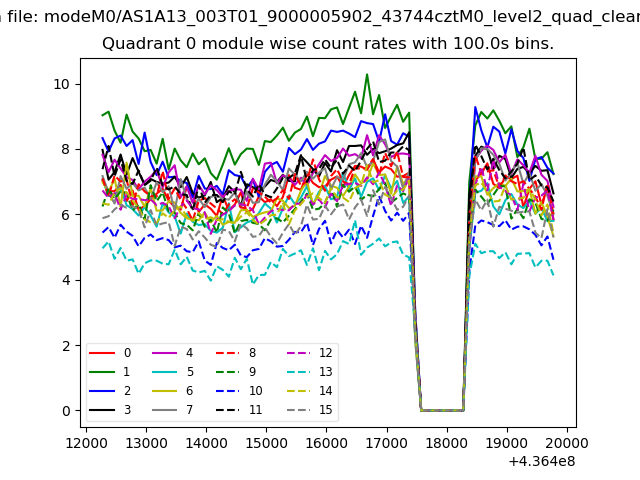
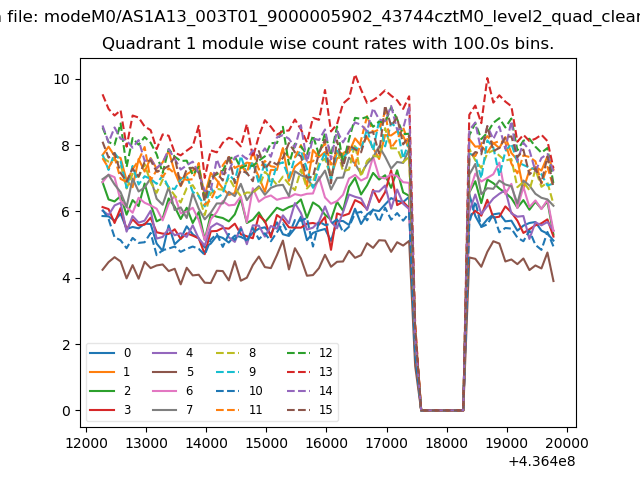
| Module-wise count rates for Quadrant A Data is divided into 100 sec bins |
 |
 |
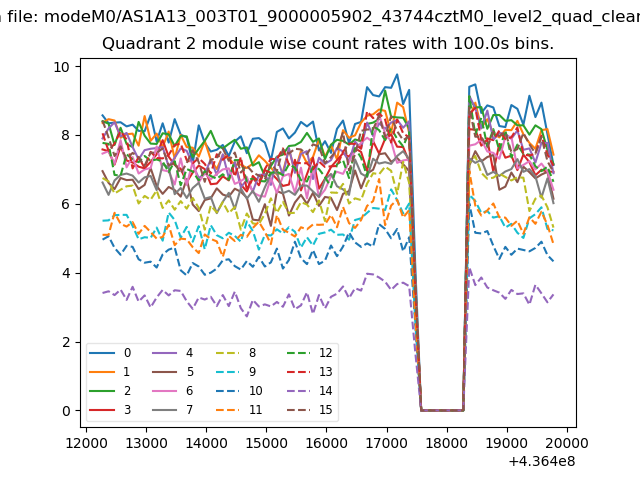
| Module-wise count rates for Quadrant B Data is divided into 100 sec bins |
 |
 |
| Module-wise count rates for Quadrant C Data is divided into 100 sec bins |
 |
 |
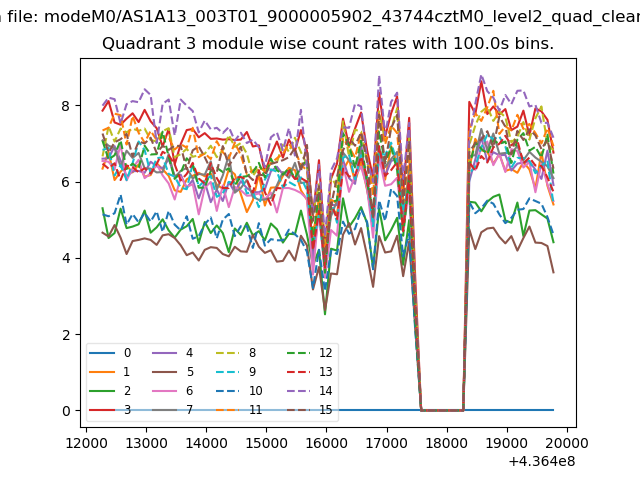
| Module-wise count rates for Quadrant D Data is divided into 100 sec bins |
 |
 |
| Parameter | Plot |
|---|---|
| CZT HV Monitor | 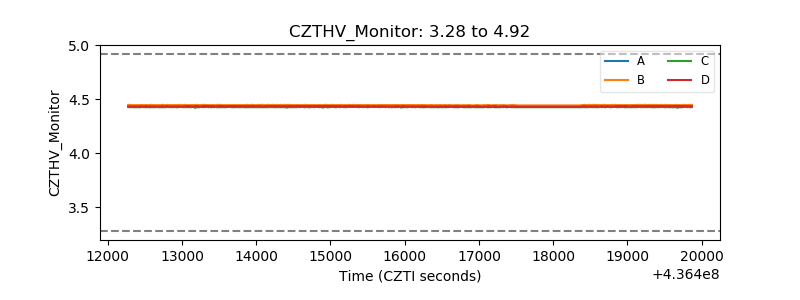 |
| D_VDD | 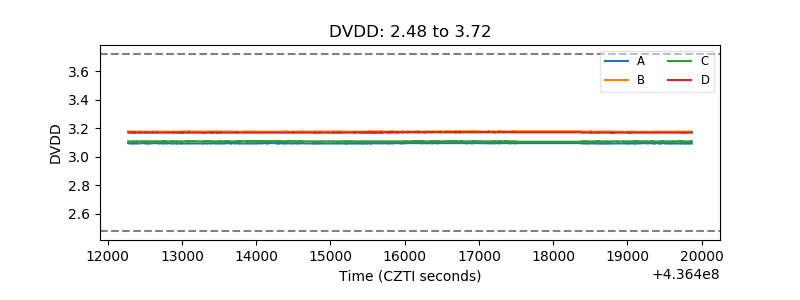 |
| Temperature 1 | 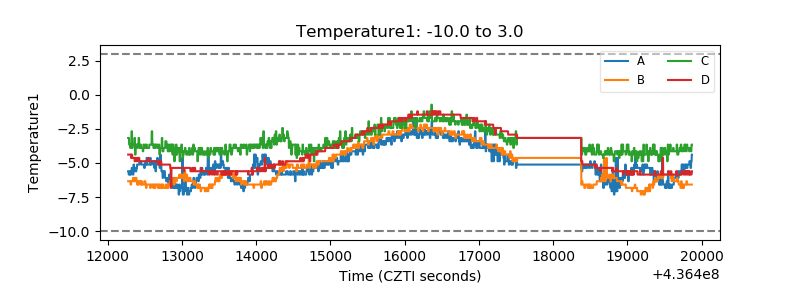 |
| Veto HV Monitor | 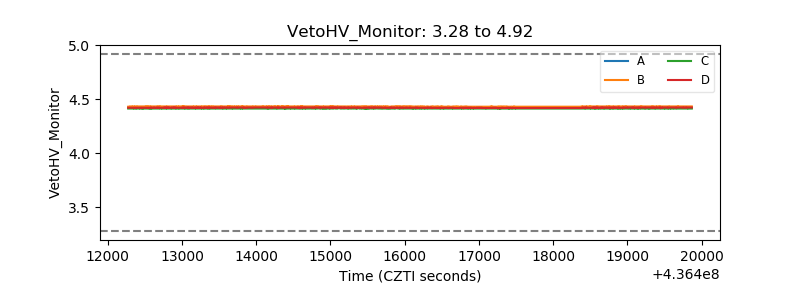 |
| Veto LLD | 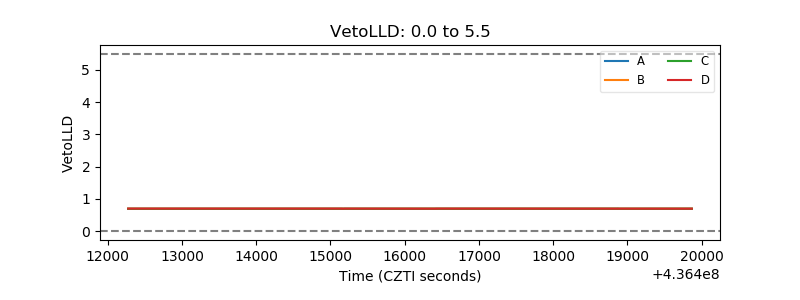 |
| Alpha Counter | 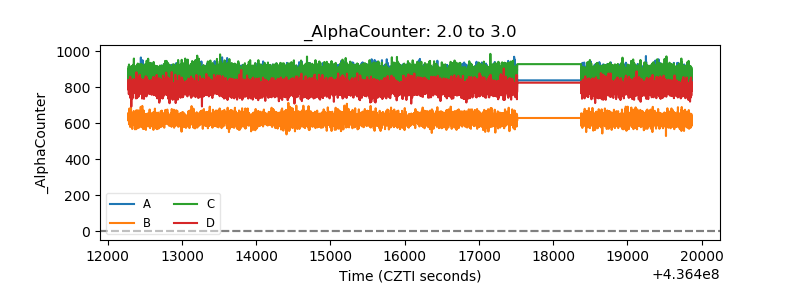 |
| _CPM_Rate | 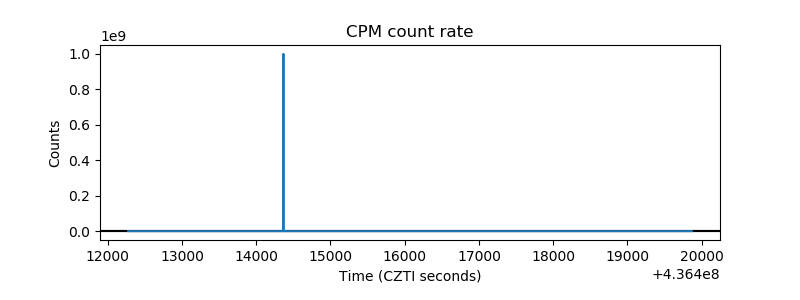 |
| CZT Counter | 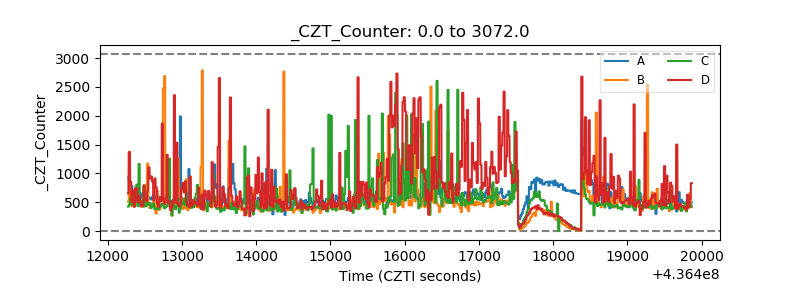 |
| +2.5 Volts monitor | 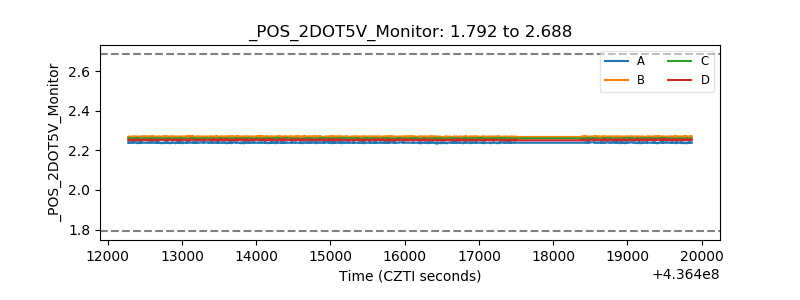 |
| +5 Volts monitor | 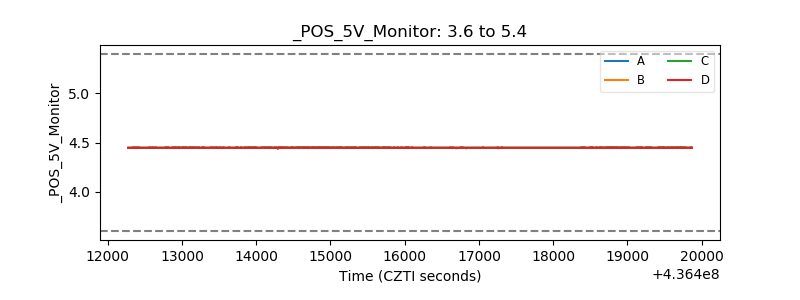 |
| _ROLL_ROT | 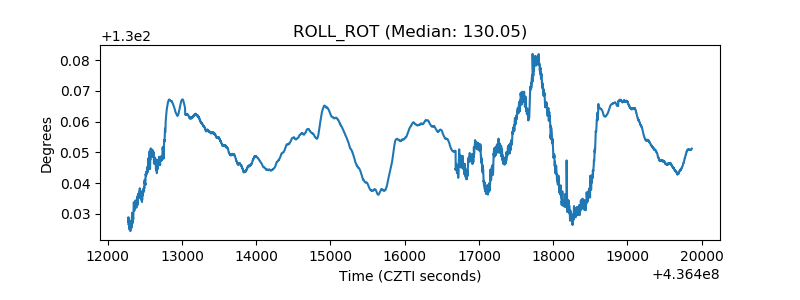 |
| _Roll_DEC | 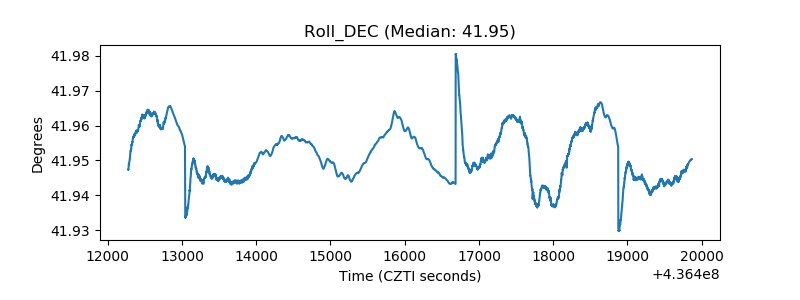 |
| _Roll_RA | 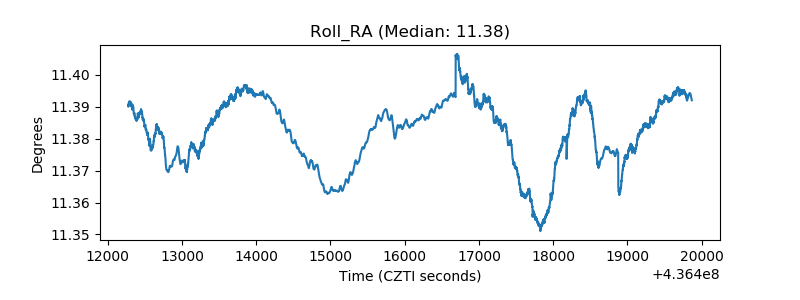 |
| Veto Counter | 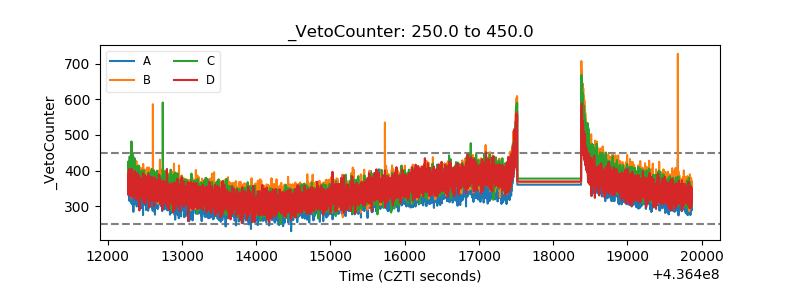 |