| Param | Original file | Final file |
|---|---|---|
| Filename | modeM0/AS1A13_003T01_9000005902_43745cztM0_level2.fits | modeM0/AS1A13_003T01_9000005902_43745cztM0_level2_quad_clean.evt |
| Size (bytes) | 528,010,560 | 112,628,160 |
| Size | 503.6 MB | 107.4 MB |
| Events in quadrant A | 4,510,341 | 759,129 |
| Events in quadrant B | 3,791,098 | 779,307 |
| Events in quadrant C | 4,819,323 | 735,193 |
| Events in quadrant D | 5,880,888 | 649,109 |
| Mode SS | |||
|---|---|---|---|
| Quadrant | BADHDUFLAG | Total packets | Discarded packets |
| A | 0 | 142 | 0 |
| B | 0 | 142 | 0 |
| C | 0 | 142 | 0 |
| D | 0 | 142 | 0 |
| Mode M0 | |||
|---|---|---|---|
| Quadrant | BADHDUFLAG | Total packets | Discarded packets |
| A | 0 | 17958 | 2 |
| B | 0 | 16015 | 2 |
| C | 0 | 19173 | 2 |
| D | 0 | 22363 | 2 |
| Mode M9 | |||
|---|---|---|---|
| Quadrant | BADHDUFLAG | Total packets | Discarded packets |
| A | 0 | 19 | 0 |
| B | 0 | 19 | 0 |
| C | 0 | 19 | 0 |
| D | 0 | 19 | 0 |
| Quadrant | Total seconds | Saturated seconds | Saturation percentage |
|---|---|---|---|
| A | 7004 | 169 | 2.412907% |
| B | 7004 | 235 | 3.355226% |
| C | 7004 | 409 | 5.839520% |
| D | 7004 | 588 | 8.395203% |
Noise dominated data is calculated using 1-second bins in cleaned event files. If a bin has >2000 counts, and if more than 50% of those come from <1% of pixels, then it is considered to be noise-dominated and hence unusable.
| Quadrant | # 1 sec bins | Bins with >0 counts | Bins with >2000 counts | High rate bins dominated by noise | Noise dominated (total time) | Noise dominated (detector-on time) | Marked lightcurve |
|---|---|---|---|---|---|---|---|
| A | 8849 | 7006 | 29 | 29 | 0.33% | 0.41% | 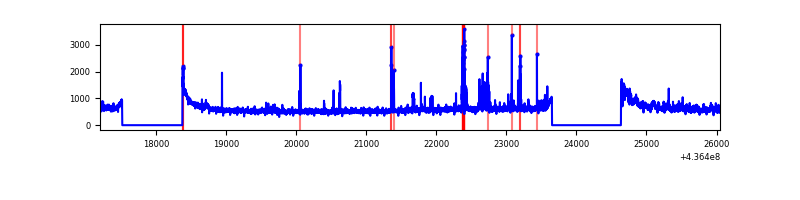 |
| B | 8849 | 7006 | 65 | 65 | 0.73% | 0.93% | 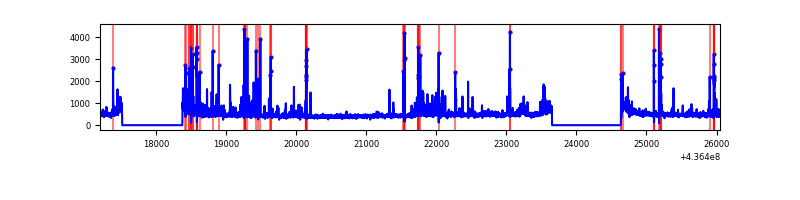 |
| C | 8849 | 7006 | 342 | 342 | 3.86% | 4.88% | 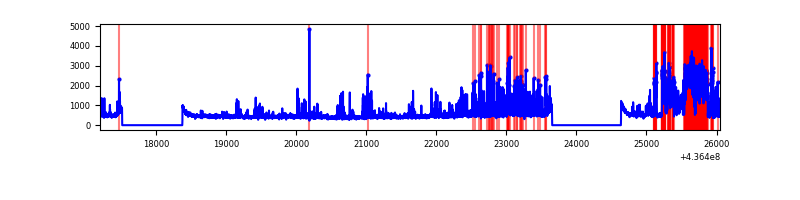 |
| D | 8849 | 7006 | 429 | 429 | 4.85% | 6.12% | 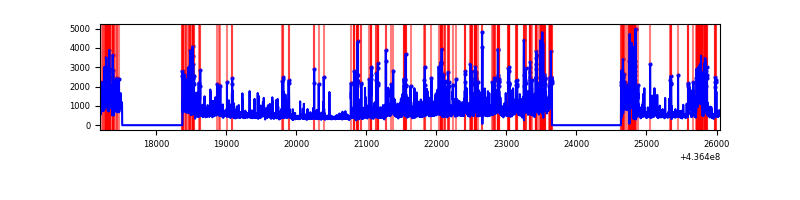 |
Top three noisy pixels from each quadrant. If the there are fewer than three noisy pixels in the level2.evt file, extra rows are filled as -1
| Pixel properties | Quadrant properties | ||||||
|---|---|---|---|---|---|---|---|
| Quadrant | DetID | PixID | Counts | Sigma | Mean | Median | Sigma |
| A | 10 | 83 | 987741 | 5922.66 | 802 | 786 | 166.6 |
| A | 13 | 248 | 158767 | 948.03 | 802 | 786 | 166.6 |
| A | 14 | 63 | 103179 | 614.45 | 802 | 786 | 166.6 |
| B | 5 | 235 | 304837 | 1944.29 | 799 | 774 | 156.4 |
| B | 4 | 171 | 149580 | 951.52 | 799 | 774 | 156.4 |
| B | 4 | 80 | 103973 | 659.89 | 799 | 774 | 156.4 |
| C | 14 | 254 | 1033790 | 5559.93 | 784 | 789 | 185.8 |
| C | 15 | 158 | 349951 | 1879.3 | 784 | 789 | 185.8 |
| C | 3 | 233 | 135907 | 727.25 | 784 | 789 | 185.8 |
| D | 15 | 0 | 518919 | 2698.58 | 757 | 736 | 192.0 |
| D | 1 | 52 | 419005 | 2178.25 | 757 | 736 | 192.0 |
| D | 1 | 47 | 350626 | 1822.15 | 757 | 736 | 192.0 |
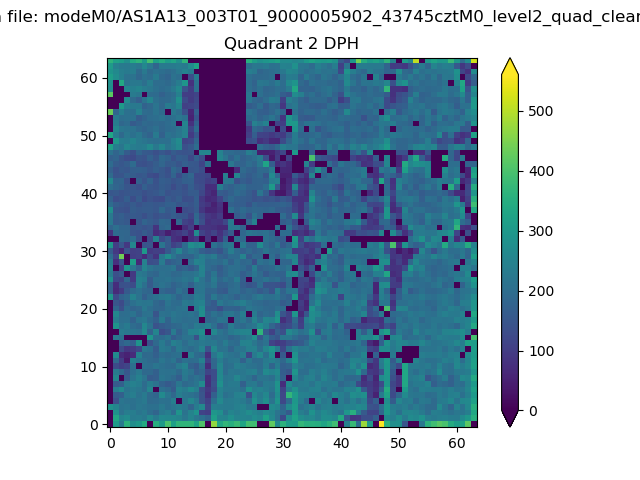
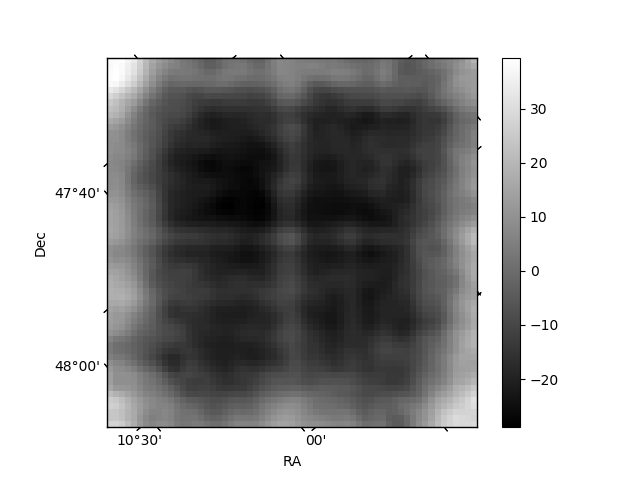
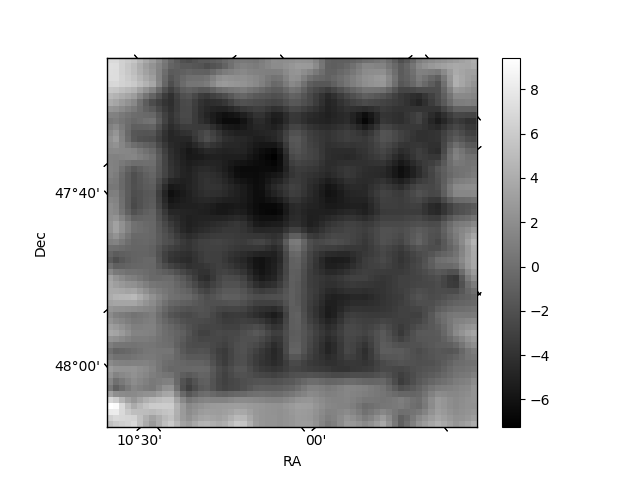
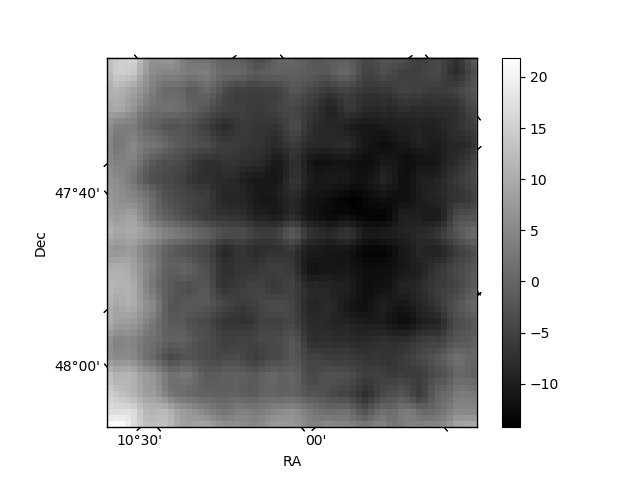
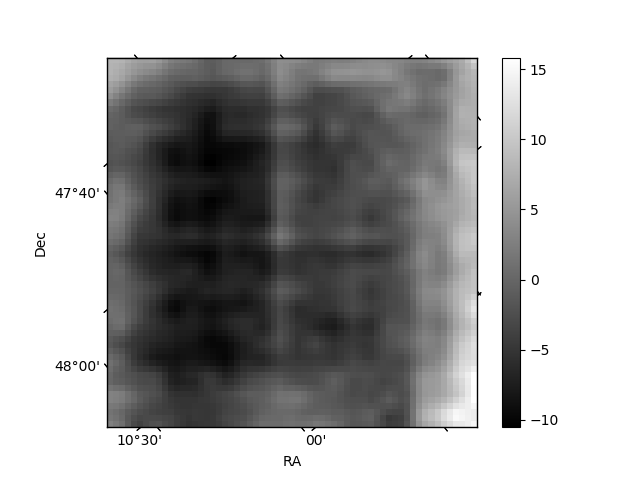
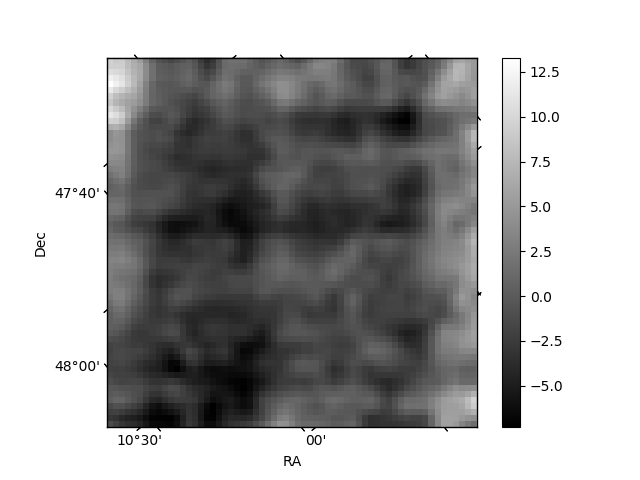
Histogram calculated using DETX and DETY for each event in the final _common_clean file
| Quadrant A | 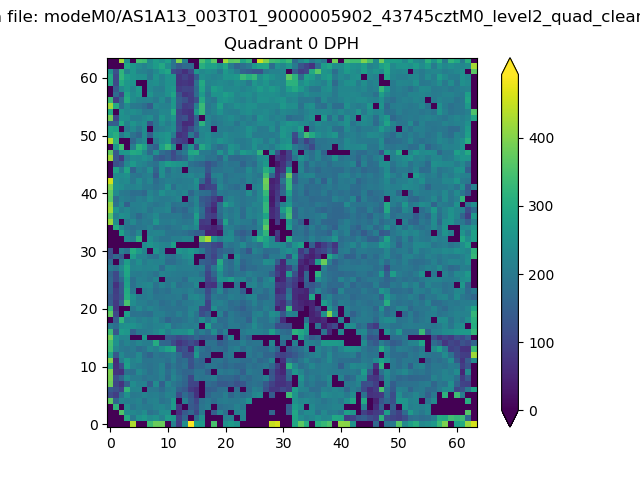 |
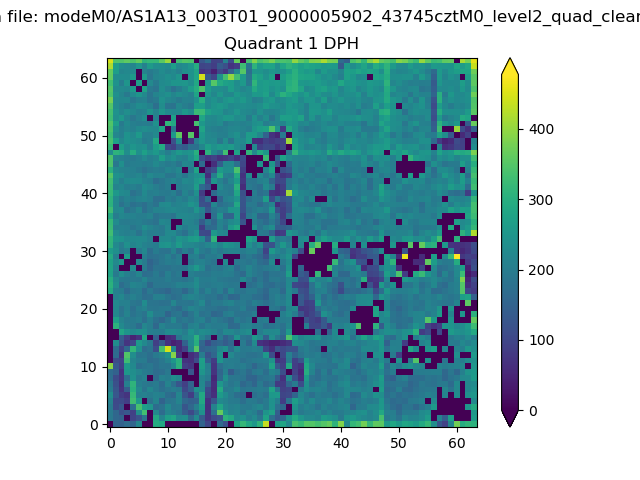 |
Quadrant B |
|---|---|---|---|
| Quadrant D | 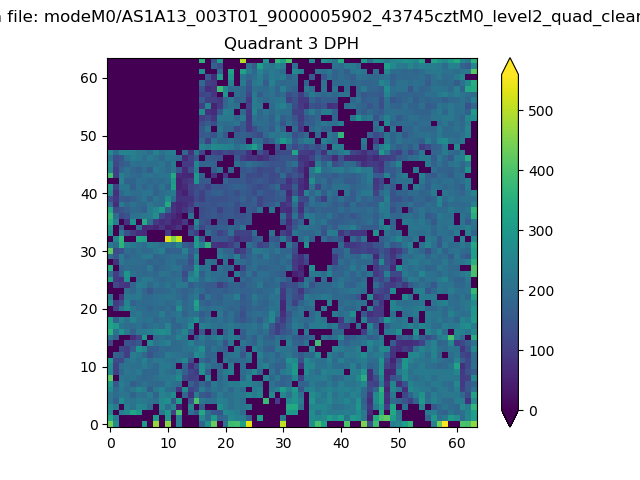 |
 |
Quadrant C |
| Plot type | Count rate plots | Images |
|---|---|---|
| Comparison with Poisson distribution Blue bars denote a histogram of data divided into 1 sec bins. Red curve is a Poisson curve with rate = median count rate of data. |
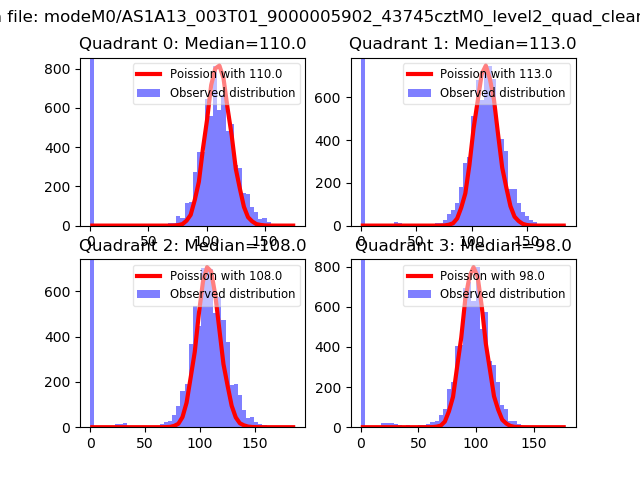 |
 |
| Quadrant-wise count rates Data is divided into 100 sec bins |
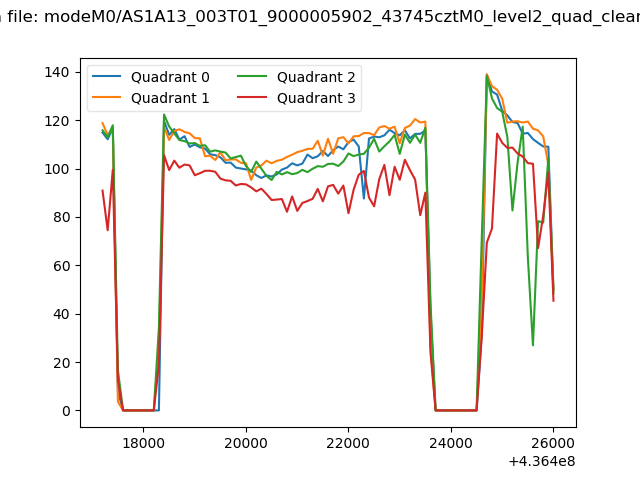 |
|
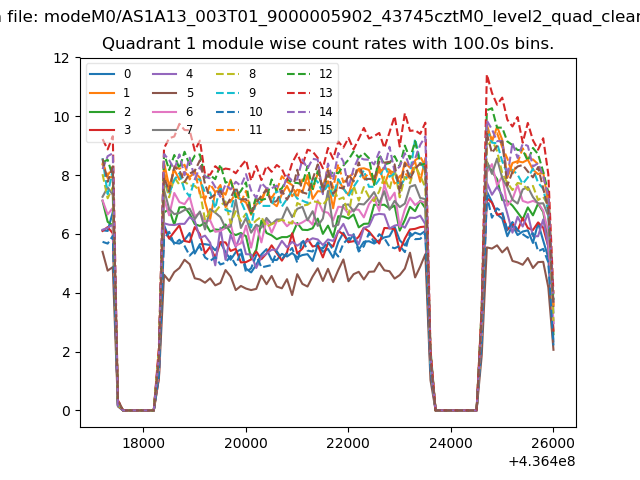
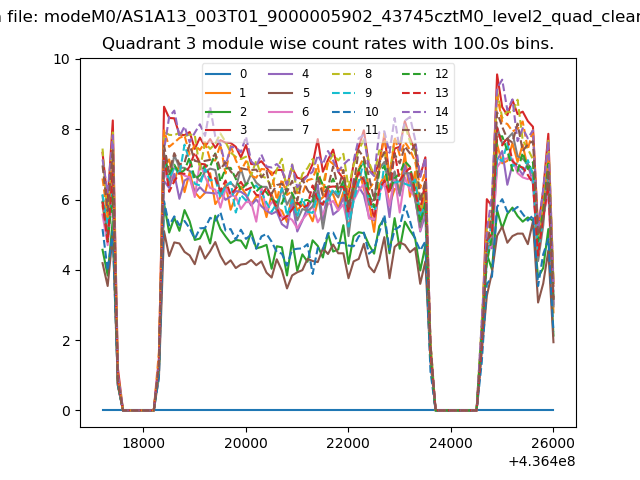
| Module-wise count rates for Quadrant A Data is divided into 100 sec bins |
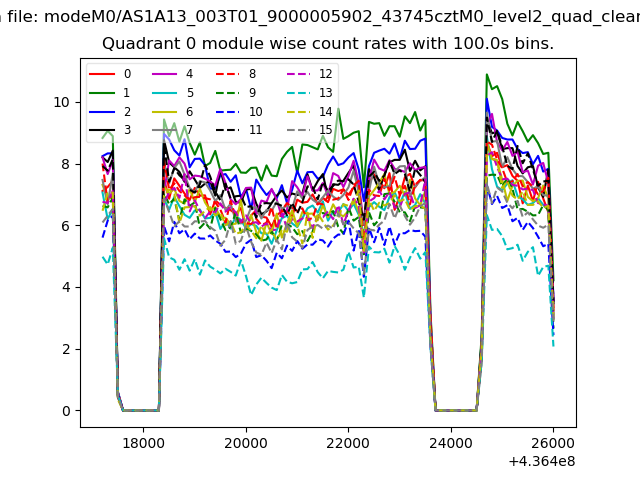 |
 |
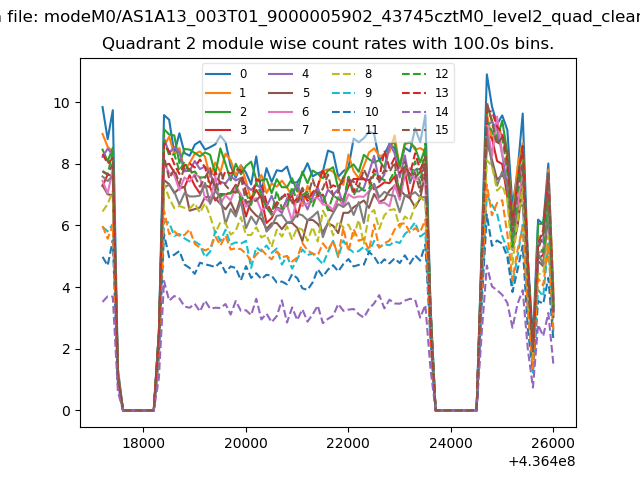
| Module-wise count rates for Quadrant B Data is divided into 100 sec bins |
 |
 |
| Module-wise count rates for Quadrant C Data is divided into 100 sec bins |
 |
 |
| Module-wise count rates for Quadrant D Data is divided into 100 sec bins |
 |
 |
| Parameter | Plot |
|---|---|
| CZT HV Monitor |  |
| D_VDD | 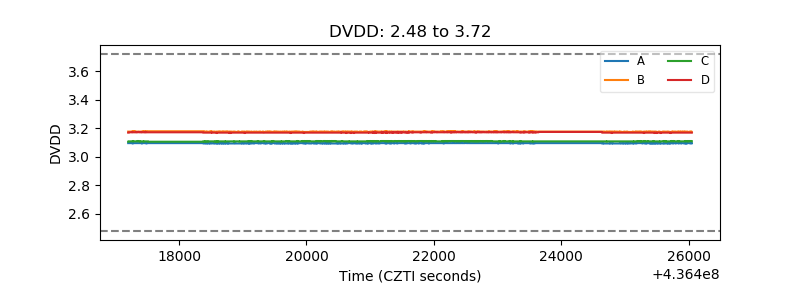 |
| Temperature 1 | 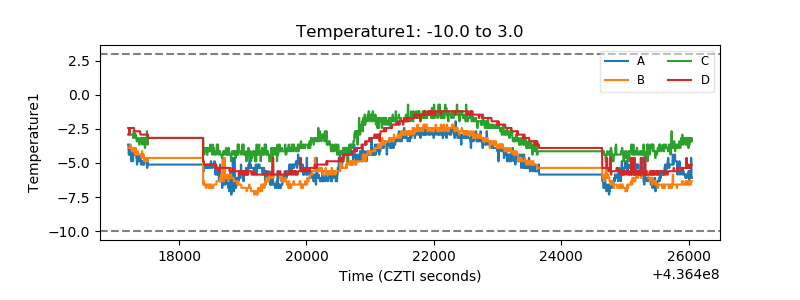 |
| Veto HV Monitor | 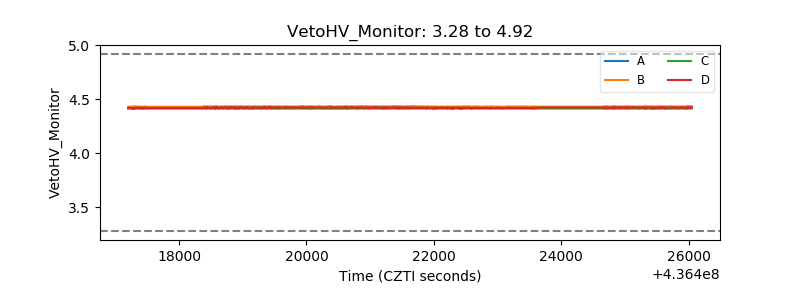 |
| Veto LLD | 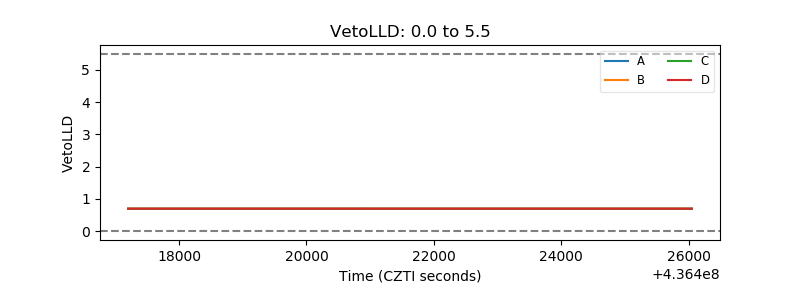 |
| Alpha Counter | 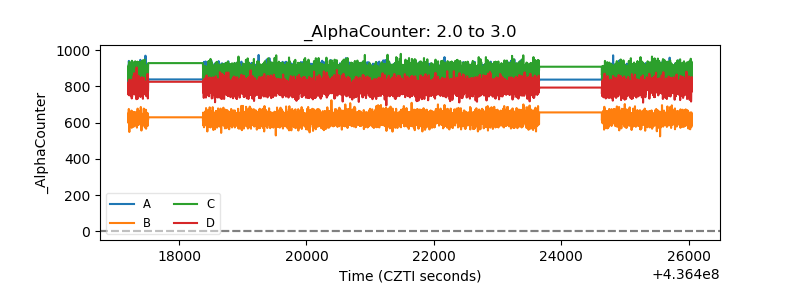 |
| _CPM_Rate | 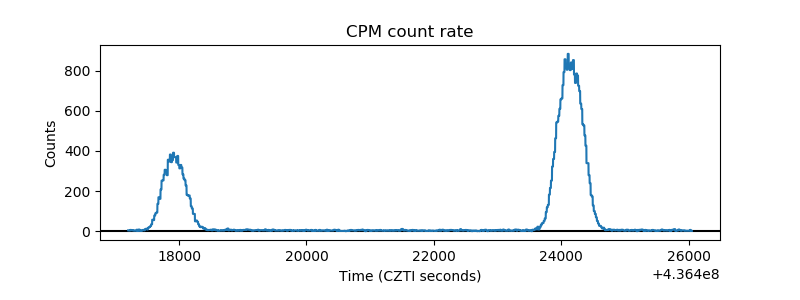 |
| CZT Counter | 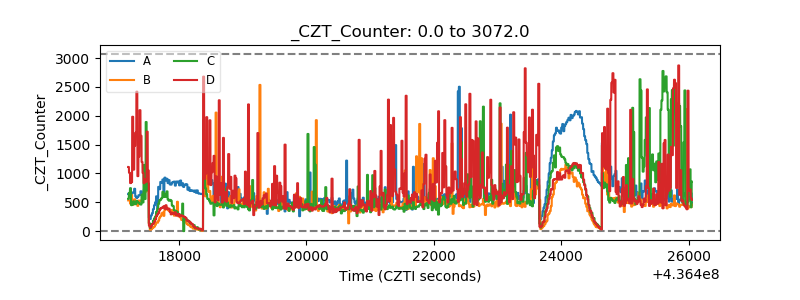 |
| +2.5 Volts monitor | 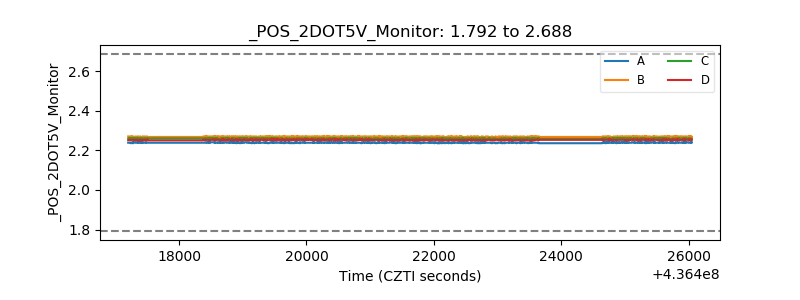 |
| +5 Volts monitor | 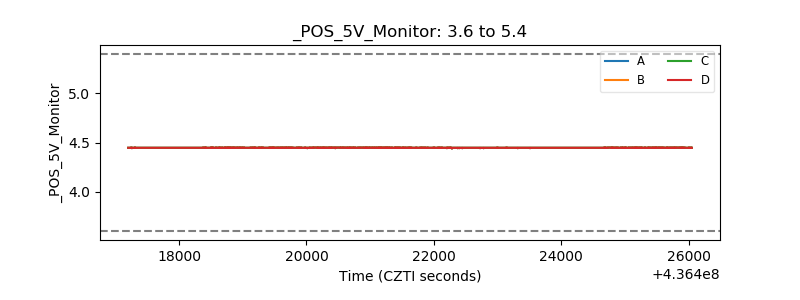 |
| _ROLL_ROT | 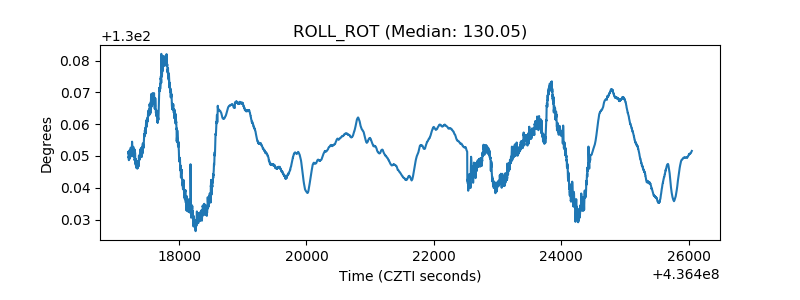 |
| _Roll_DEC | 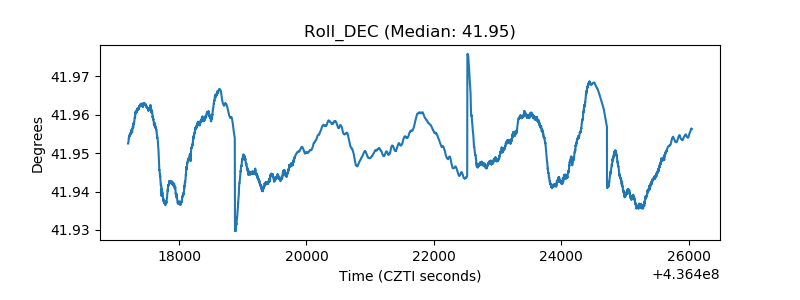 |
| _Roll_RA | 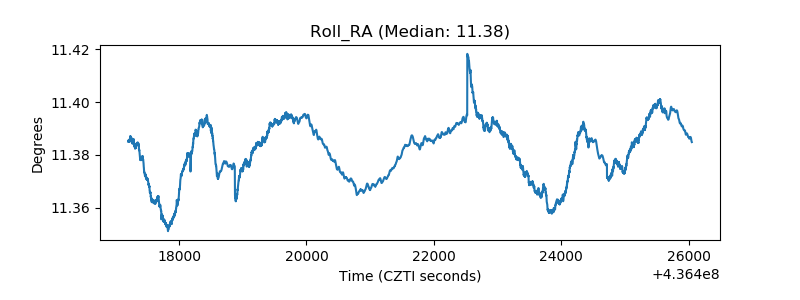 |
| Veto Counter | 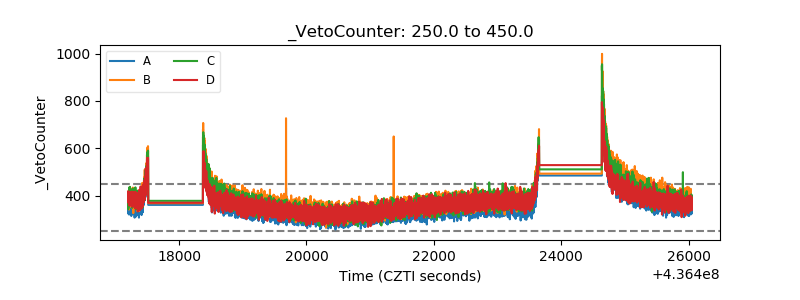 |