| Param | Original file | Final file |
|---|---|---|
| Filename | modeM0/AS1A13_026T01_9000005904_43749cztM0_level2.fits | modeM0/AS1A13_026T01_9000005904_43749cztM0_level2_quad_clean.evt |
| Size (bytes) | 556,729,920 | 104,256,000 |
| Size | 530.9 MB | 99.4 MB |
| Events in quadrant A | 4,715,889 | 726,374 |
| Events in quadrant B | 3,809,246 | 741,820 |
| Events in quadrant C | 4,303,607 | 714,378 |
| Events in quadrant D | 7,324,764 | 563,626 |
| Mode M0 | |||
|---|---|---|---|
| Quadrant | BADHDUFLAG | Total packets | Discarded packets |
| A | 0 | 18665 | 2 |
| B | 0 | 15158 | 1 |
| C | 0 | 16513 | 1 |
| D | 0 | 25926 | 1 |
| Mode SS | |||
|---|---|---|---|
| Quadrant | BADHDUFLAG | Total packets | Discarded packets |
| A | 0 | 120 | 0 |
| B | 0 | 120 | 0 |
| C | 0 | 120 | 0 |
| D | 0 | 120 | 0 |
| Mode M9 | |||
|---|---|---|---|
| Quadrant | BADHDUFLAG | Total packets | Discarded packets |
| A | 0 | 12 | 0 |
| B | 0 | 12 | 0 |
| C | 0 | 12 | 0 |
| D | 0 | 12 | 0 |
| Quadrant | Total seconds | Saturated seconds | Saturation percentage |
|---|---|---|---|
| A | 5872 | 267 | 4.547003% |
| B | 5873 | 266 | 4.529201% |
| C | 5873 | 223 | 3.797037% |
| D | 5873 | 1174 | 19.989784% |
Noise dominated data is calculated using 1-second bins in cleaned event files. If a bin has >2000 counts, and if more than 50% of those come from <1% of pixels, then it is considered to be noise-dominated and hence unusable.
| Quadrant | # 1 sec bins | Bins with >0 counts | Bins with >2000 counts | High rate bins dominated by noise | Noise dominated (total time) | Noise dominated (detector-on time) | Marked lightcurve |
|---|---|---|---|---|---|---|---|
| A | 7082 | 5873 | 105 | 105 | 1.48% | 1.79% | 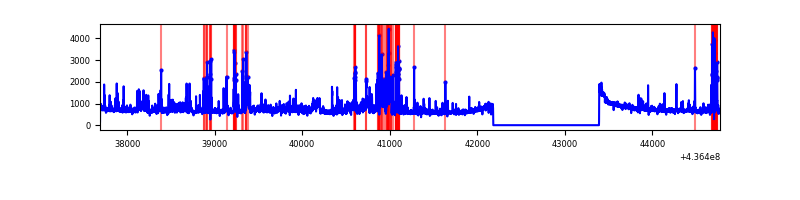 |
| B | 7083 | 5874 | 123 | 123 | 1.74% | 2.09% | 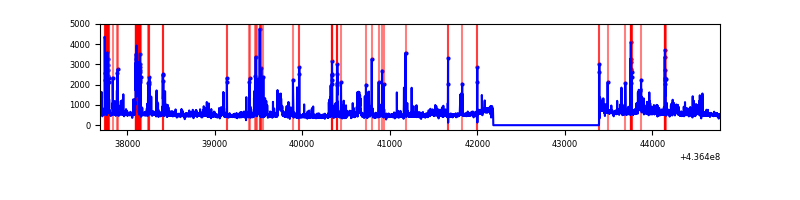 |
| C | 7083 | 5874 | 174 | 174 | 2.46% | 2.96% | 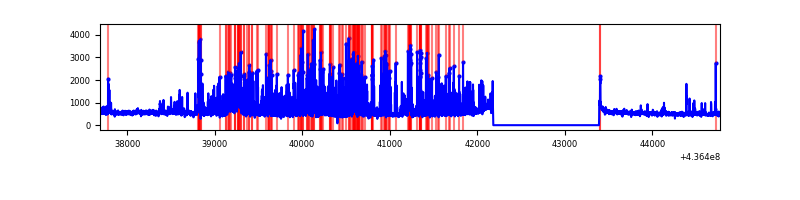 |
| D | 7083 | 5873 | 906 | 906 | 12.79% | 15.43% | 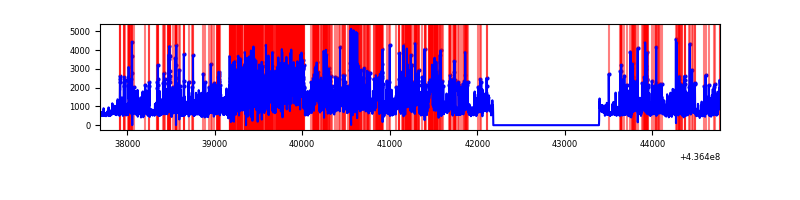 |
Top three noisy pixels from each quadrant. If the there are fewer than three noisy pixels in the level2.evt file, extra rows are filled as -1
| Pixel properties | Quadrant properties | ||||||
|---|---|---|---|---|---|---|---|
| Quadrant | DetID | PixID | Counts | Sigma | Mean | Median | Sigma |
| A | 10 | 83 | 864423 | 5791.02 | 730 | 716 | 149.1 |
| A | 13 | 248 | 289834 | 1938.49 | 730 | 716 | 149.1 |
| A | 7 | 3 | 249144 | 1665.67 | 730 | 716 | 149.1 |
| B | 5 | 235 | 496524 | 3524.25 | 718 | 700 | 140.7 |
| B | 0 | 200 | 211160 | 1495.92 | 718 | 700 | 140.7 |
| B | 4 | 80 | 78713 | 554.51 | 718 | 700 | 140.7 |
| C | 15 | 158 | 967072 | 5910.04 | 700 | 703 | 163.5 |
| C | 14 | 96 | 155222 | 944.99 | 700 | 703 | 163.5 |
| C | 15 | 157 | 108856 | 661.43 | 700 | 703 | 163.5 |
| D | 15 | 0 | 1343951 | 7783.06 | 662 | 643 | 172.6 |
| D | 1 | 52 | 1164780 | 6744.96 | 662 | 643 | 172.6 |
| D | 5 | 235 | 592579 | 3429.65 | 662 | 643 | 172.6 |
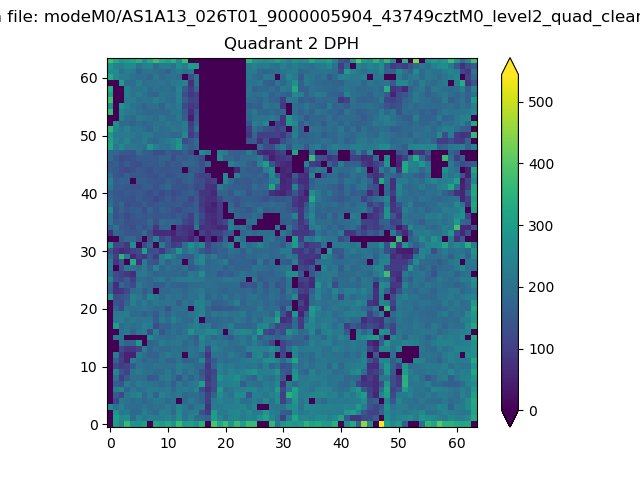
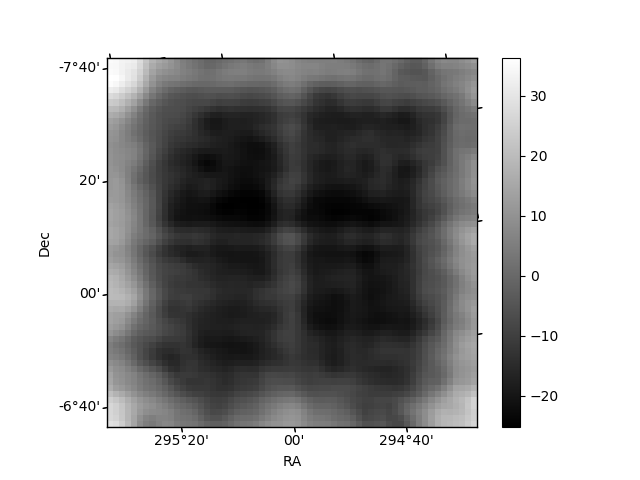
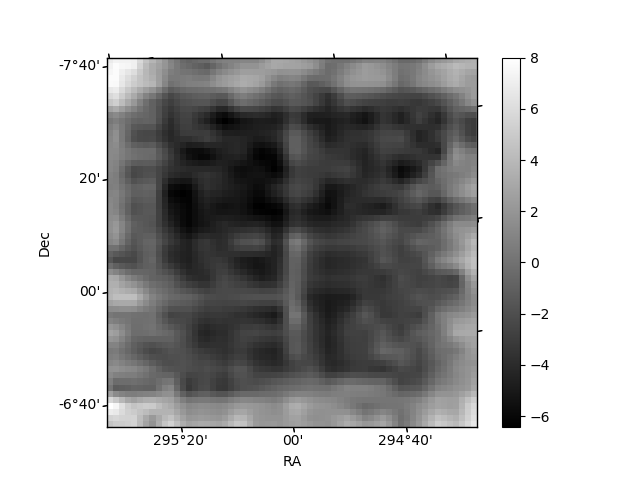
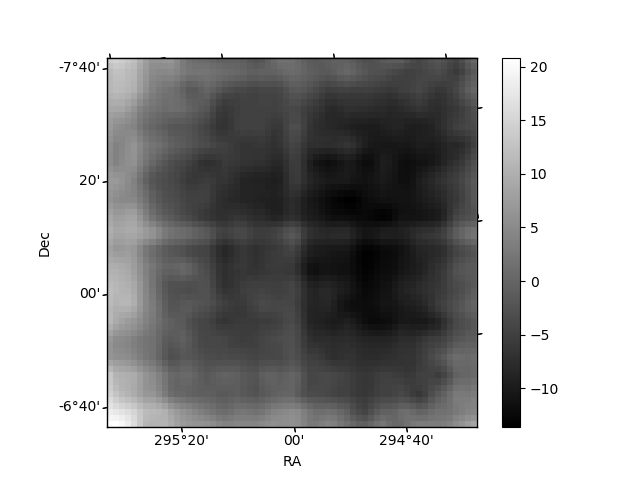
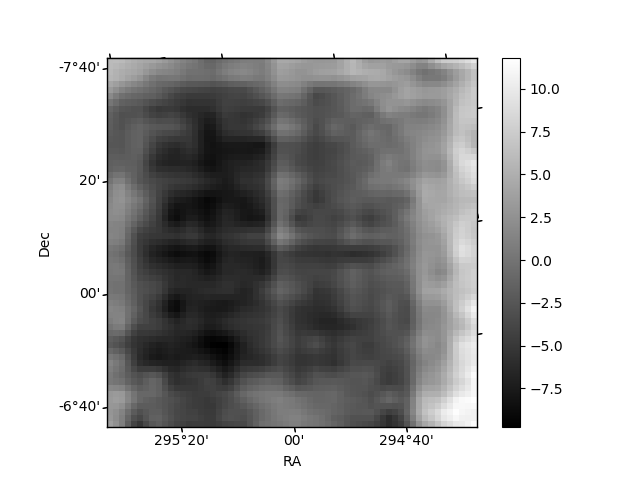
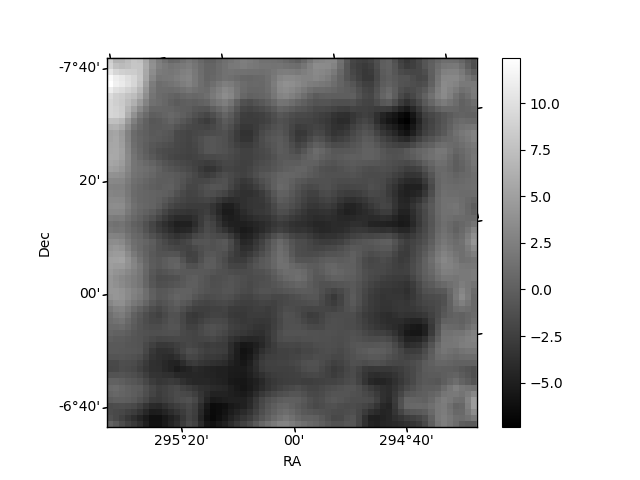
Histogram calculated using DETX and DETY for each event in the final _common_clean file
| Quadrant A | 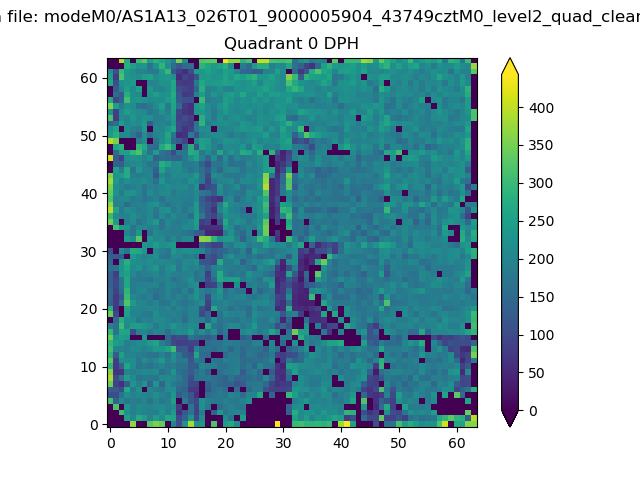 |
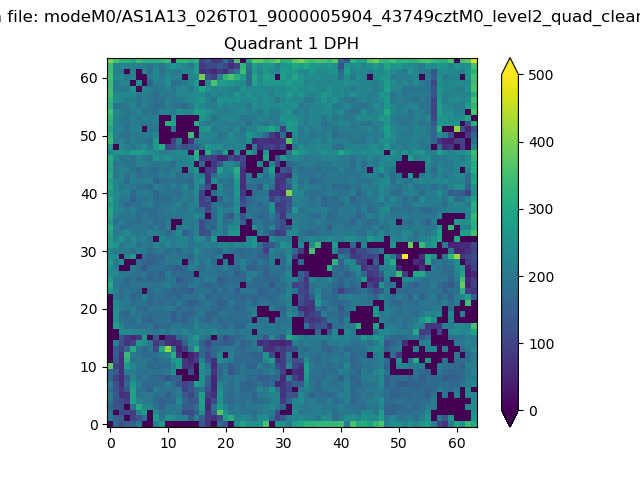 |
Quadrant B |
|---|---|---|---|
| Quadrant D | 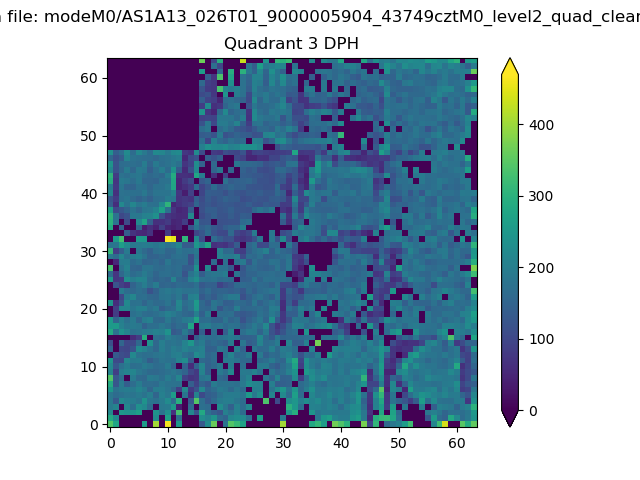 |
 |
Quadrant C |
| Plot type | Count rate plots | Images |
|---|---|---|
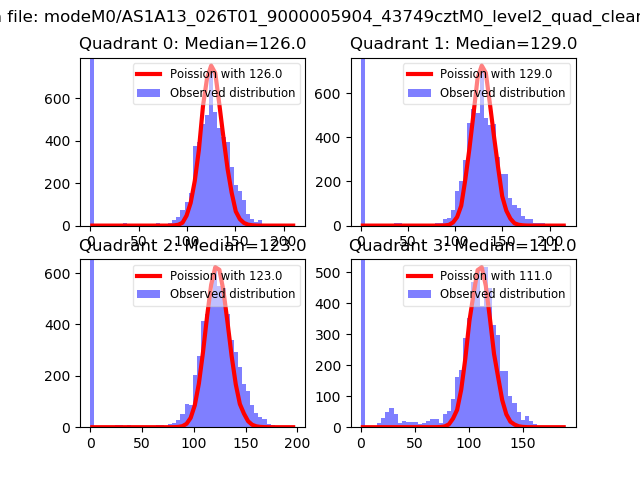
| Comparison with Poisson distribution Blue bars denote a histogram of data divided into 1 sec bins. Red curve is a Poisson curve with rate = median count rate of data. |
 |
 |
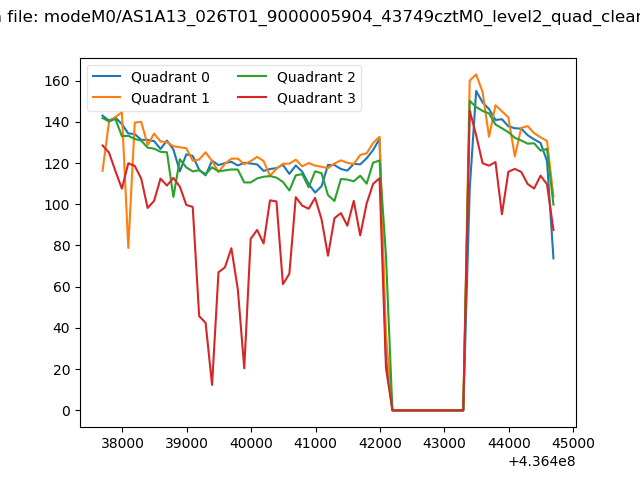
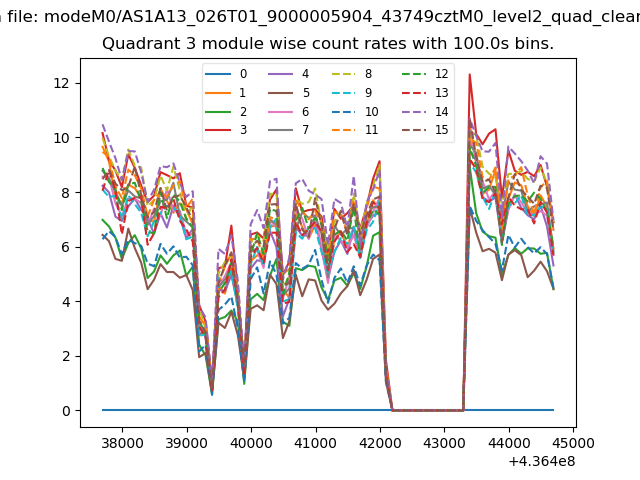
| Quadrant-wise count rates Data is divided into 100 sec bins |
 |
|
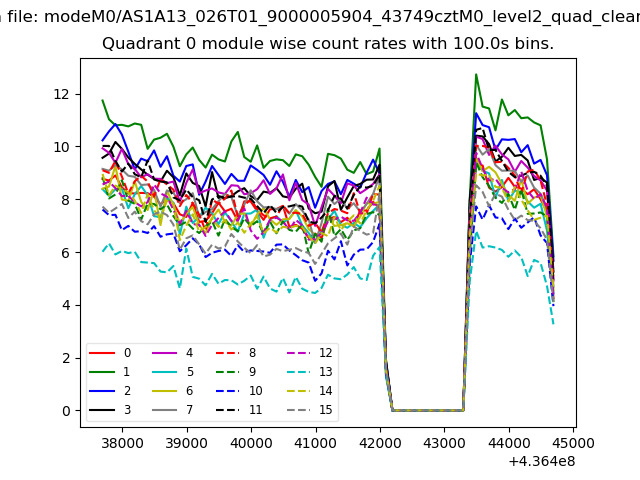
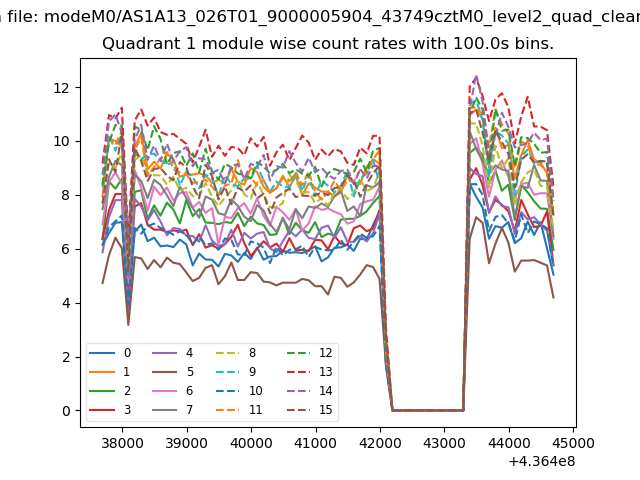
| Module-wise count rates for Quadrant A Data is divided into 100 sec bins |
 |
 |
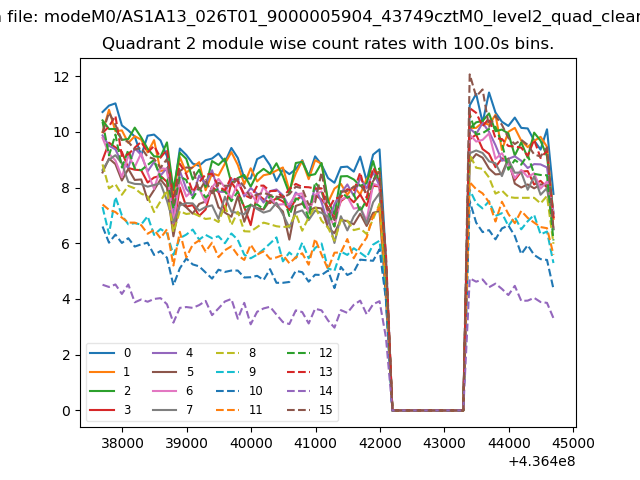
| Module-wise count rates for Quadrant B Data is divided into 100 sec bins |
 |
 |
| Module-wise count rates for Quadrant C Data is divided into 100 sec bins |
 |
 |
| Module-wise count rates for Quadrant D Data is divided into 100 sec bins |
 |
 |
| Parameter | Plot |
|---|---|
| CZT HV Monitor | 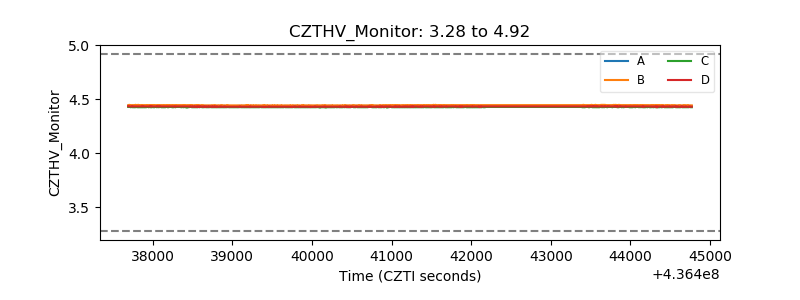 |
| D_VDD | 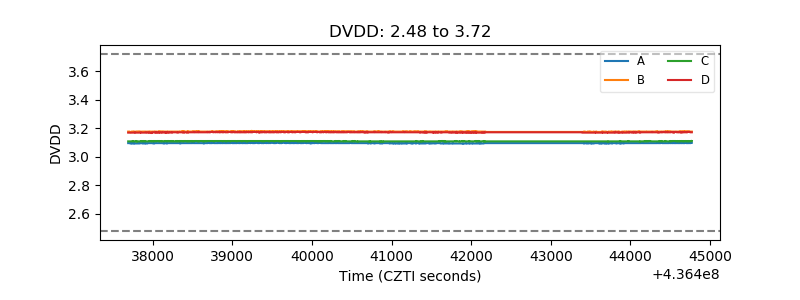 |
| Temperature 1 | 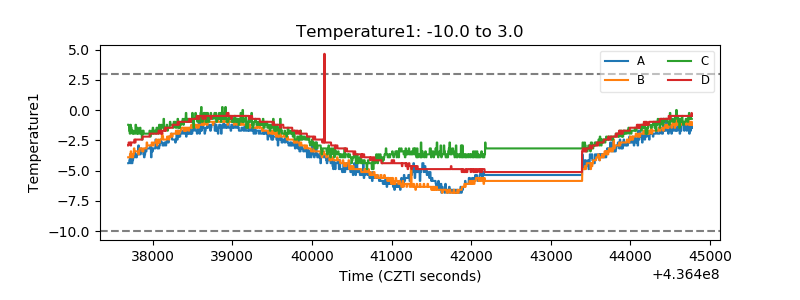 |
| Veto HV Monitor | 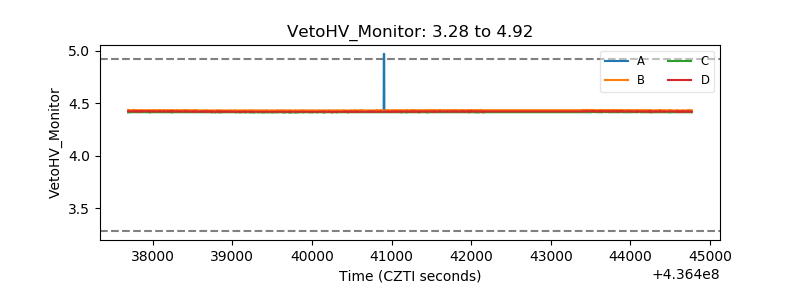 |
| Veto LLD | 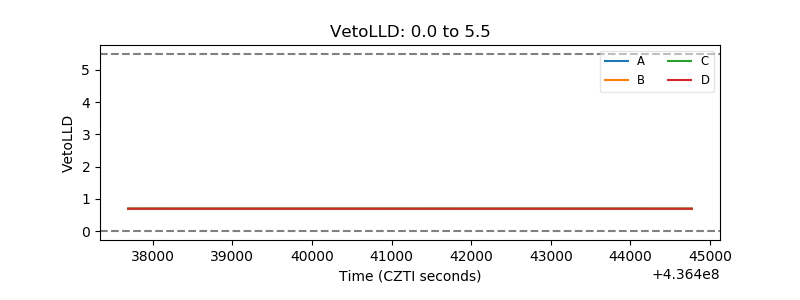 |
| Alpha Counter | 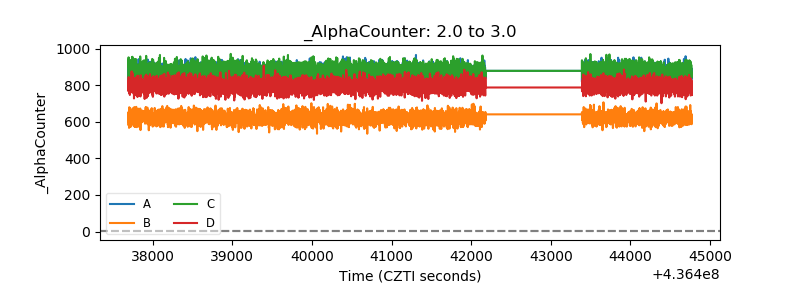 |
| _CPM_Rate | 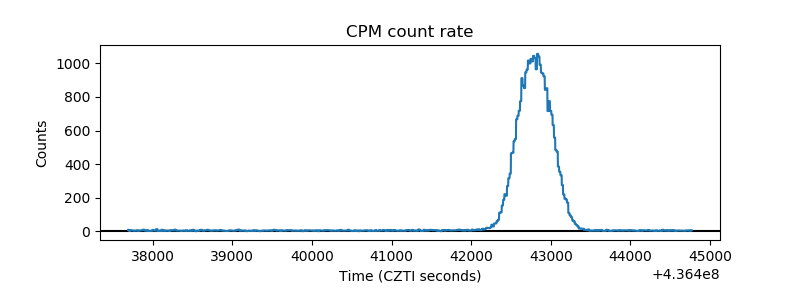 |
| CZT Counter | 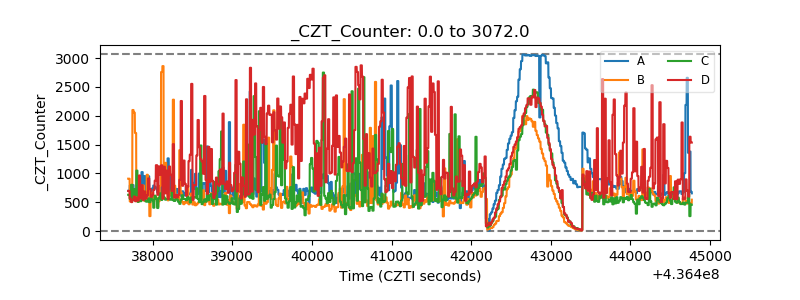 |
| +2.5 Volts monitor | 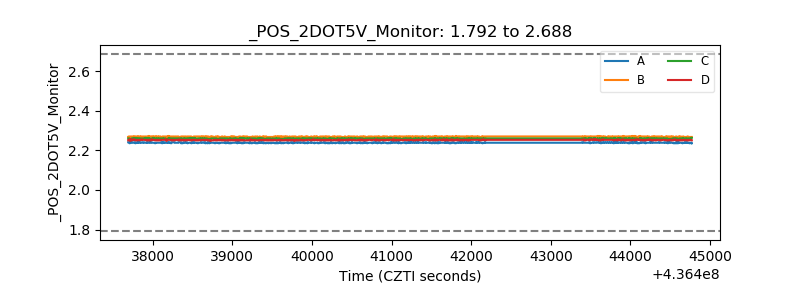 |
| +5 Volts monitor | 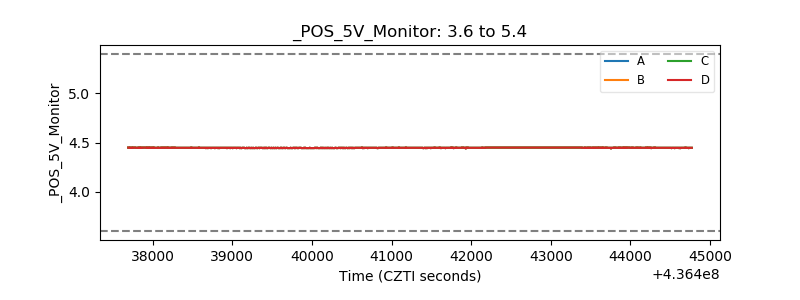 |
| _ROLL_ROT | 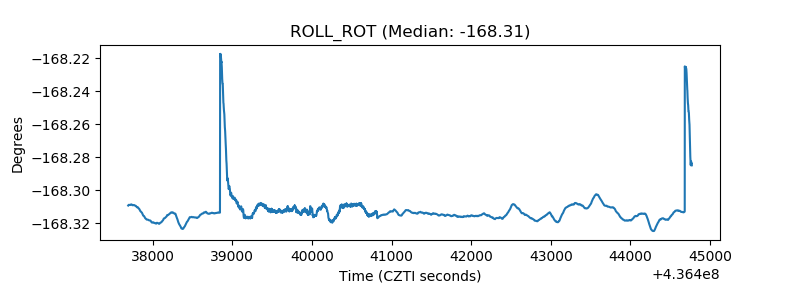 |
| _Roll_DEC | 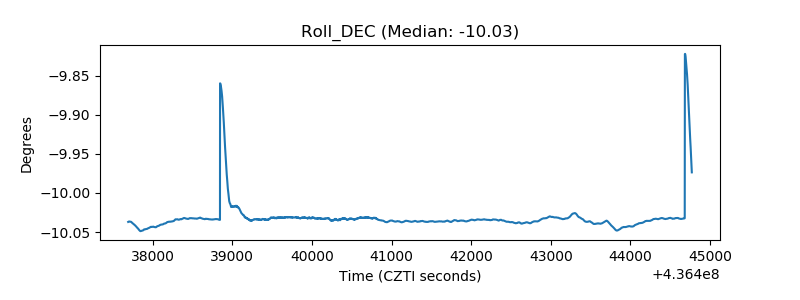 |
| _Roll_RA | 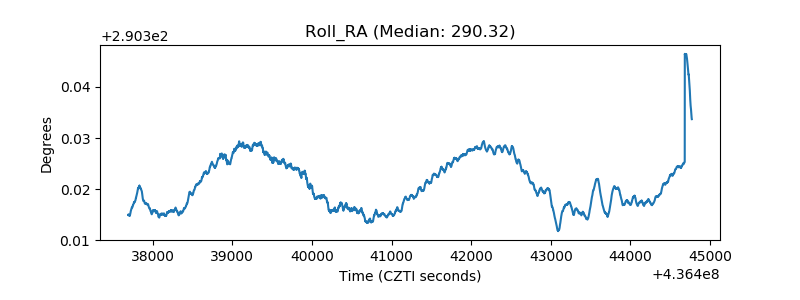 |
| Veto Counter | 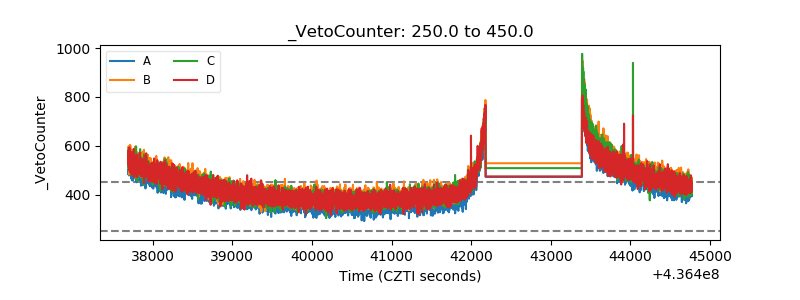 |