| Param | Original file | Final file |
|---|---|---|
| Filename | modeM0/AS1A13_026T01_9000005904_43750cztM0_level2.fits | modeM0/AS1A13_026T01_9000005904_43750cztM0_level2_quad_clean.evt |
| Size (bytes) | 1,523,211,840 | 264,199,680 |
| Size | 1.4 GB | 252.0 MB |
| Events in quadrant A | 12,613,083 | 1,879,927 |
| Events in quadrant B | 9,954,952 | 1,887,579 |
| Events in quadrant C | 12,181,433 | 1,776,371 |
| Events in quadrant D | 20,421,588 | 1,370,068 |
| Mode M0 | |||
|---|---|---|---|
| Quadrant | BADHDUFLAG | Total packets | Discarded packets |
| A | 0 | 49458 | 3 |
| B | 0 | 39862 | 3 |
| C | 0 | 46413 | 3 |
| D | 0 | 71694 | 3 |
| Mode SS | |||
|---|---|---|---|
| Quadrant | BADHDUFLAG | Total packets | Discarded packets |
| A | 0 | 320 | 0 |
| B | 0 | 320 | 0 |
| C | 0 | 320 | 0 |
| D | 0 | 320 | 0 |
| Mode M9 | |||
|---|---|---|---|
| Quadrant | BADHDUFLAG | Total packets | Discarded packets |
| A | 0 | 36 | 0 |
| B | 0 | 36 | 0 |
| C | 0 | 36 | 0 |
| D | 0 | 36 | 0 |
| Quadrant | Total seconds | Saturated seconds | Saturation percentage |
|---|---|---|---|
| A | 15737 | 752 | 4.778547% |
| B | 15738 | 864 | 5.489897% |
| C | 15738 | 1158 | 7.357987% |
| D | 15737 | 3557 | 22.602783% |
Noise dominated data is calculated using 1-second bins in cleaned event files. If a bin has >2000 counts, and if more than 50% of those come from <1% of pixels, then it is considered to be noise-dominated and hence unusable.
| Quadrant | # 1 sec bins | Bins with >0 counts | Bins with >2000 counts | High rate bins dominated by noise | Noise dominated (total time) | Noise dominated (detector-on time) | Marked lightcurve |
|---|---|---|---|---|---|---|---|
| A | 19297 | 15740 | 284 | 284 | 1.47% | 1.80% | 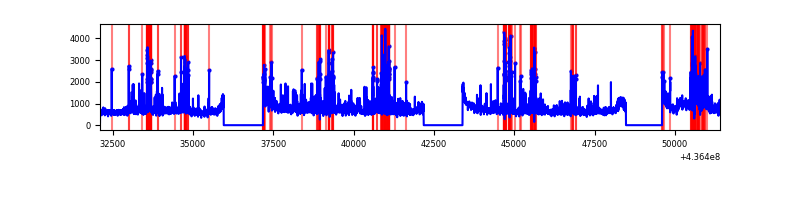 |
| B | 19298 | 15741 | 458 | 458 | 2.37% | 2.91% | 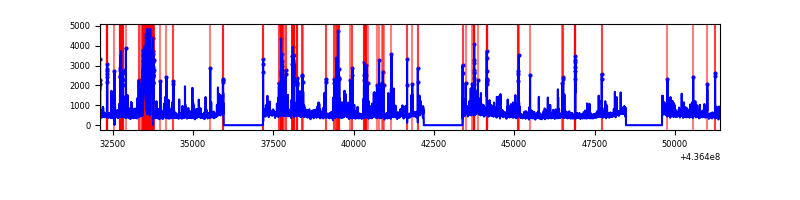 |
| C | 19298 | 15741 | 844 | 844 | 4.37% | 5.36% | 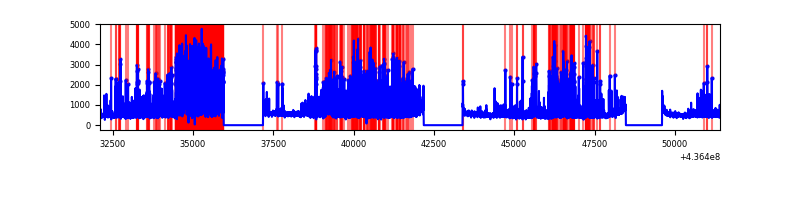 |
| D | 19297 | 15739 | 2960 | 2960 | 15.34% | 18.81% | 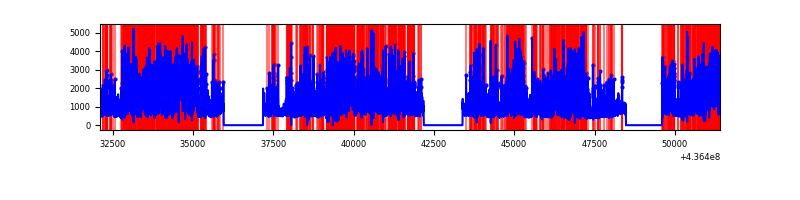 |
Top three noisy pixels from each quadrant. If the there are fewer than three noisy pixels in the level2.evt file, extra rows are filled as -1
| Pixel properties | Quadrant properties | ||||||
|---|---|---|---|---|---|---|---|
| Quadrant | DetID | PixID | Counts | Sigma | Mean | Median | Sigma |
| A | 10 | 83 | 2306800 | 5940.42 | 1906 | 1871 | 388.0 |
| A | 14 | 63 | 868924 | 2234.63 | 1906 | 1871 | 388.0 |
| A | 13 | 248 | 826586 | 2125.51 | 1906 | 1871 | 388.0 |
| B | 5 | 235 | 1563925 | 4344.92 | 1876 | 1827 | 359.5 |
| B | 0 | 200 | 324452 | 897.37 | 1876 | 1827 | 359.5 |
| B | 4 | 80 | 168953 | 464.85 | 1876 | 1827 | 359.5 |
| C | 15 | 158 | 3865620 | 9196.55 | 1811 | 1826 | 420.1 |
| C | 15 | 157 | 323029 | 764.52 | 1811 | 1826 | 420.1 |
| C | 15 | 173 | 244279 | 577.08 | 1811 | 1826 | 420.1 |
| D | 15 | 0 | 5229198 | 11625.32 | 1730 | 1681 | 449.7 |
| D | 1 | 52 | 2427654 | 5395.05 | 1730 | 1681 | 449.7 |
| D | 5 | 235 | 1313014 | 2916.23 | 1730 | 1681 | 449.7 |
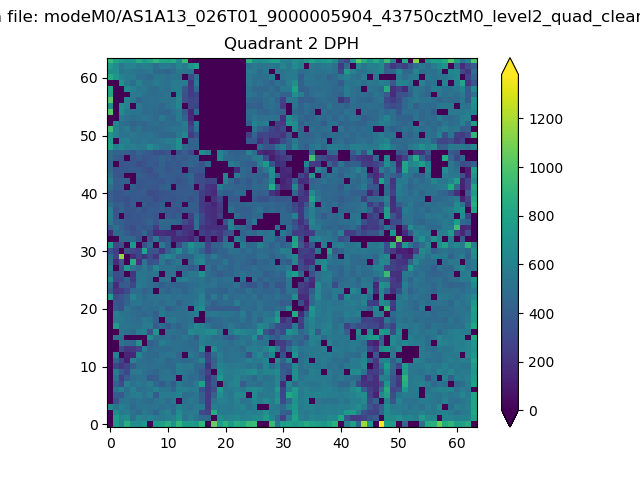
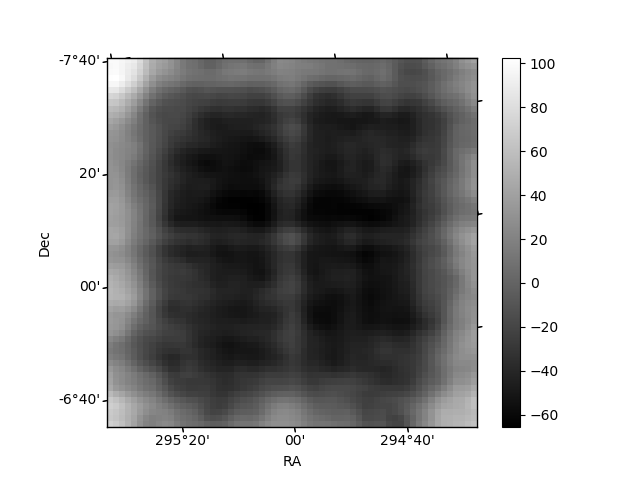
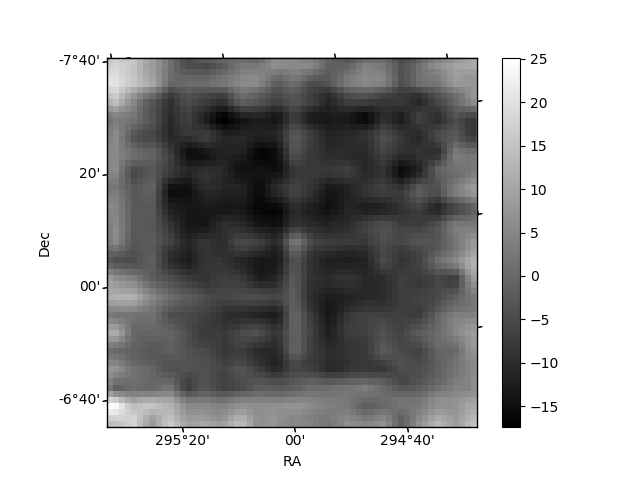
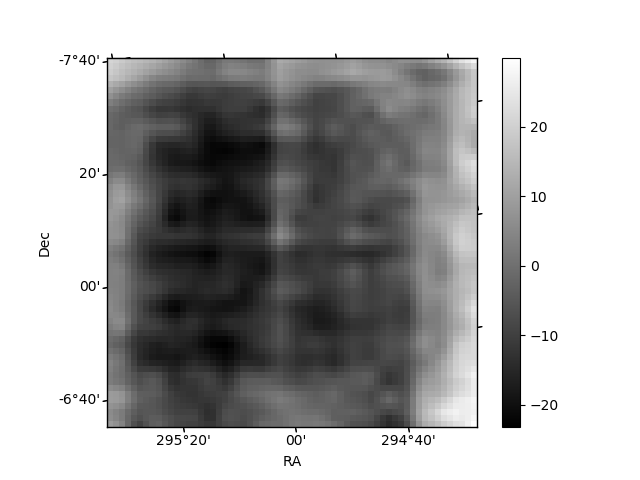
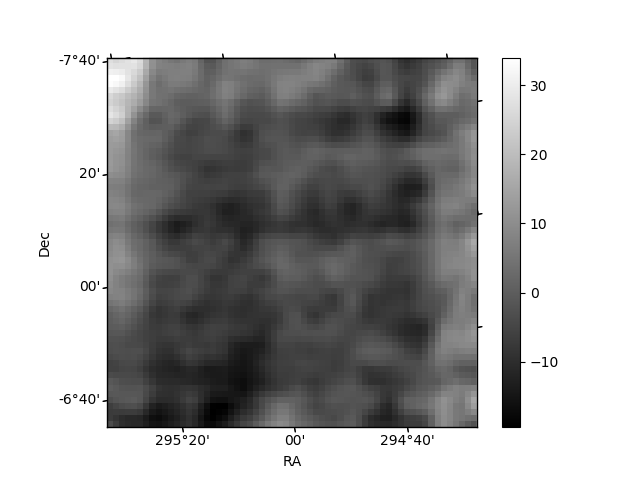
Histogram calculated using DETX and DETY for each event in the final _common_clean file
| Quadrant A | 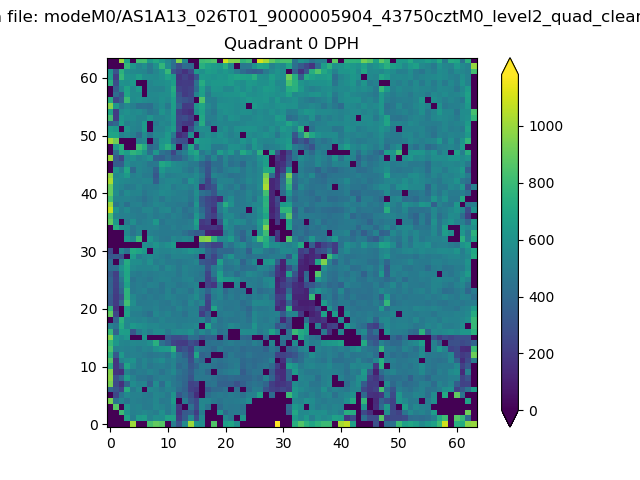 |
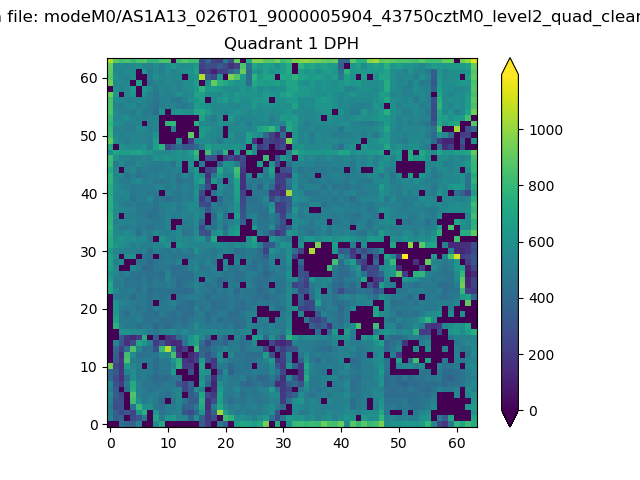 |
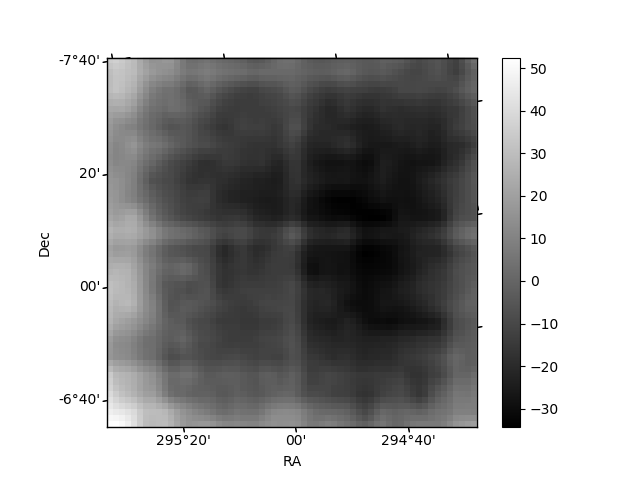
Quadrant B |
|---|---|---|---|
| Quadrant D | 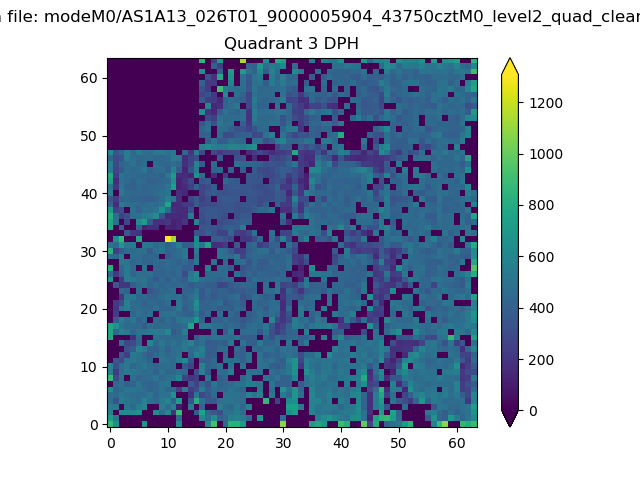 |
 |
Quadrant C |
| Plot type | Count rate plots | Images |
|---|---|---|
| Comparison with Poisson distribution Blue bars denote a histogram of data divided into 1 sec bins. Red curve is a Poisson curve with rate = median count rate of data. |
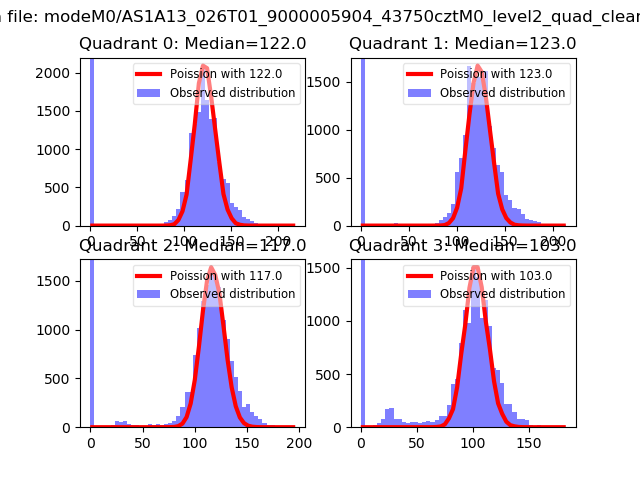 |
 |
| Quadrant-wise count rates Data is divided into 100 sec bins |
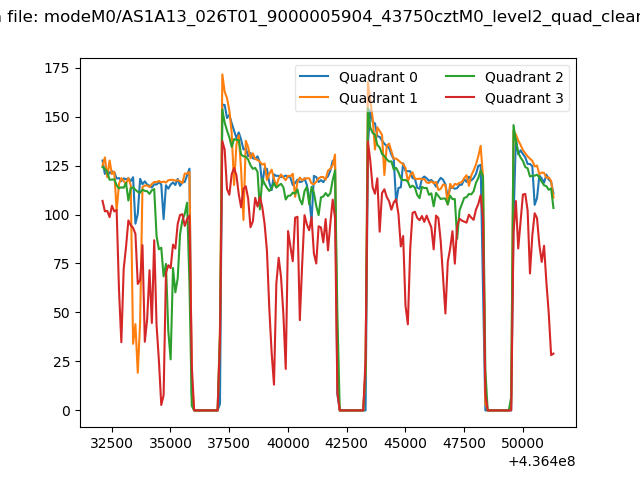 |
|
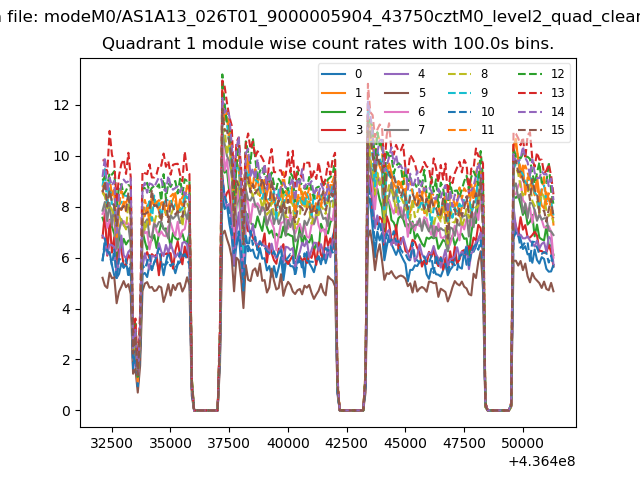
| Module-wise count rates for Quadrant A Data is divided into 100 sec bins |
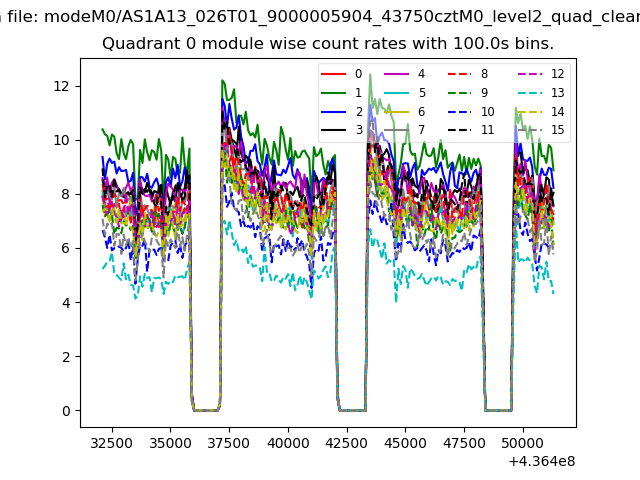 |
 |
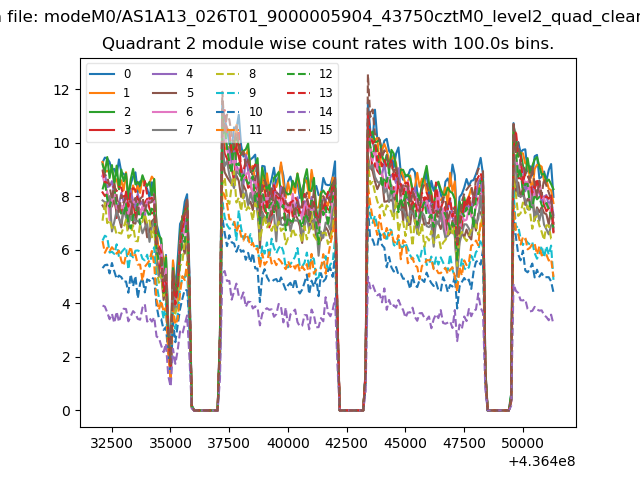
| Module-wise count rates for Quadrant B Data is divided into 100 sec bins |
 |
 |
| Module-wise count rates for Quadrant C Data is divided into 100 sec bins |
 |
 |
| Module-wise count rates for Quadrant D Data is divided into 100 sec bins |
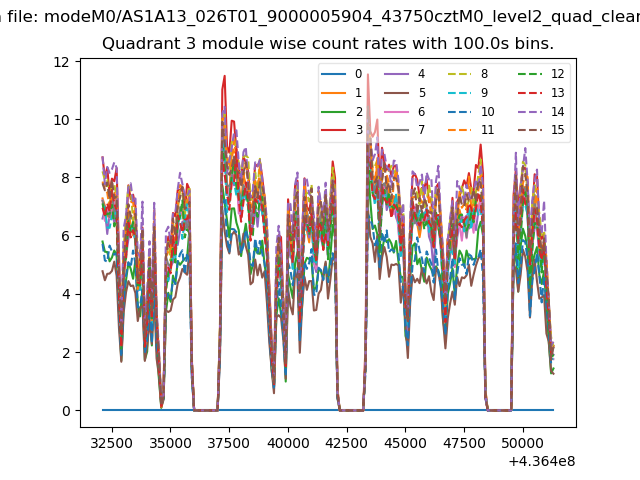 |
 |
| Parameter | Plot |
|---|---|
| CZT HV Monitor | 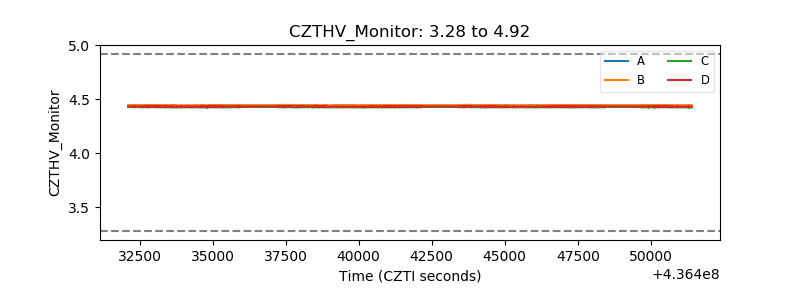 |
| D_VDD | 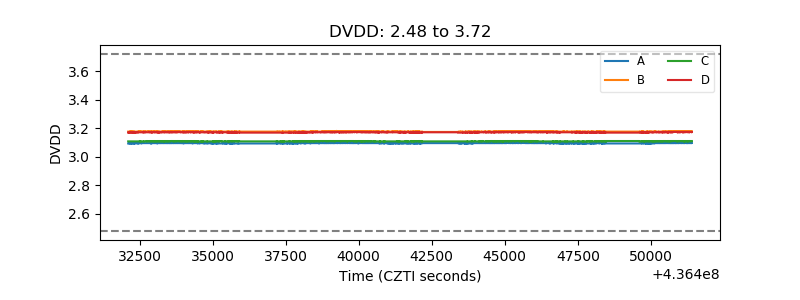 |
| Temperature 1 | 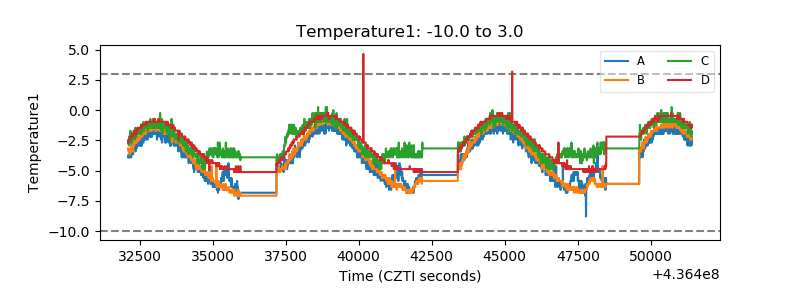 |
| Veto HV Monitor | 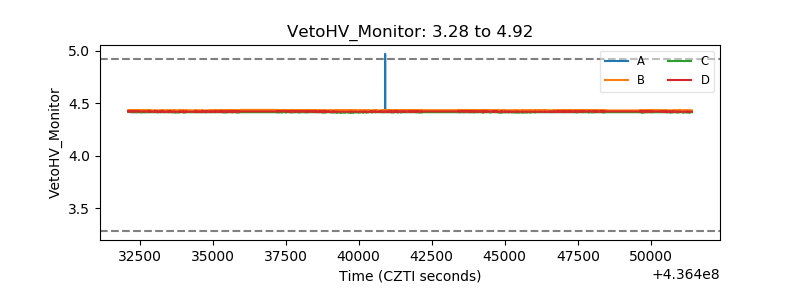 |
| Veto LLD | 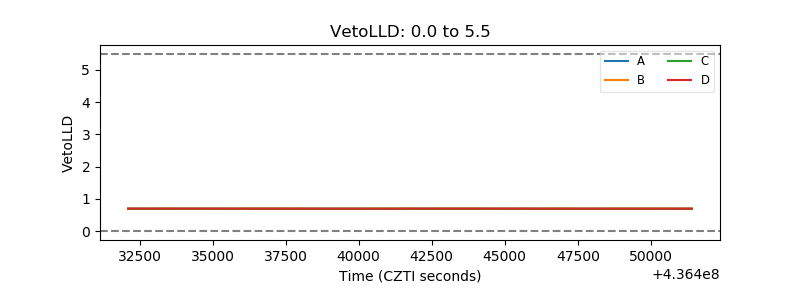 |
| Alpha Counter | 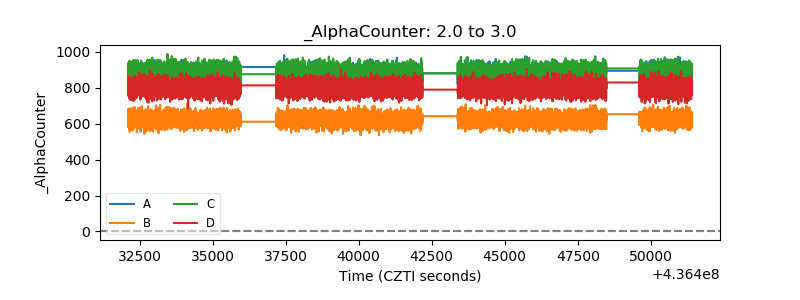 |
| _CPM_Rate | 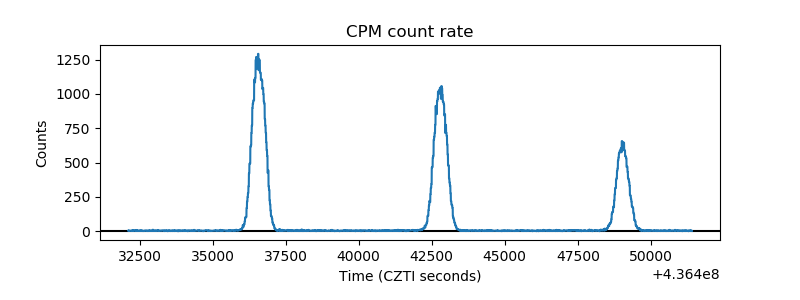 |
| CZT Counter | 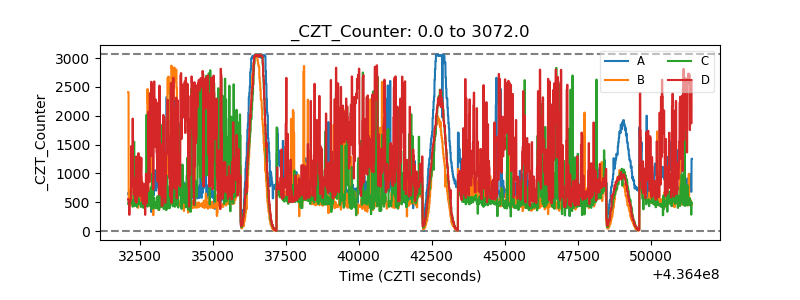 |
| +2.5 Volts monitor | 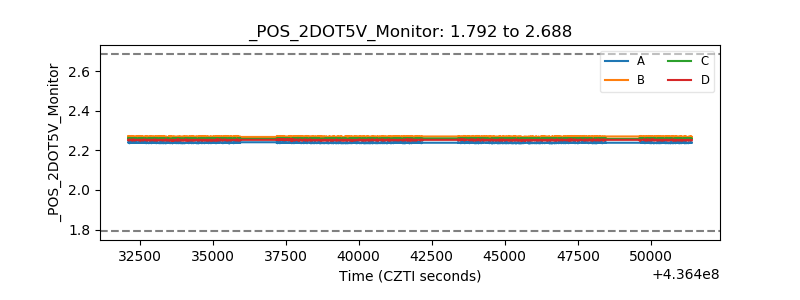 |
| +5 Volts monitor | 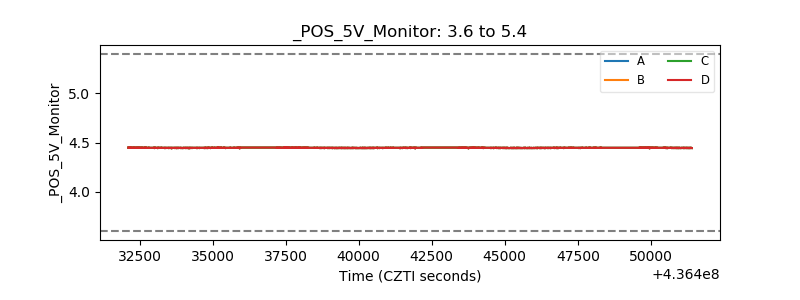 |
| _ROLL_ROT | 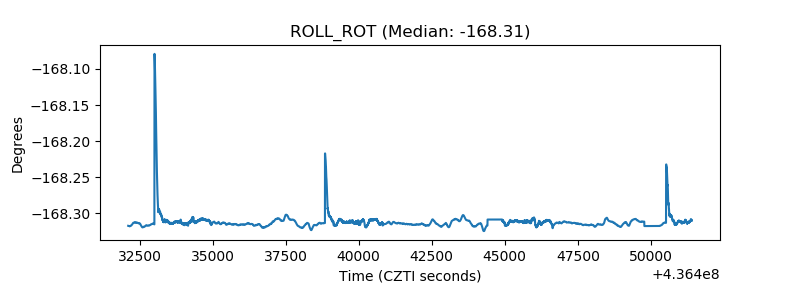 |
| _Roll_DEC | 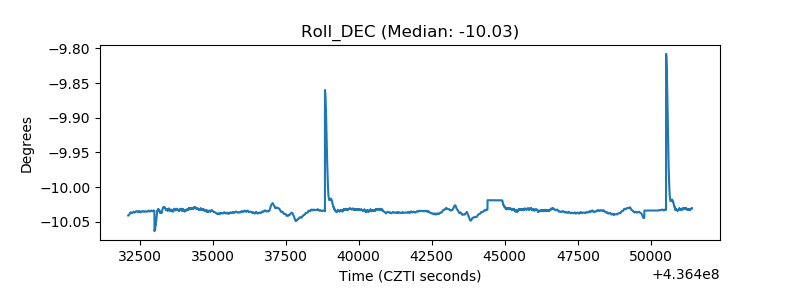 |
| _Roll_RA | 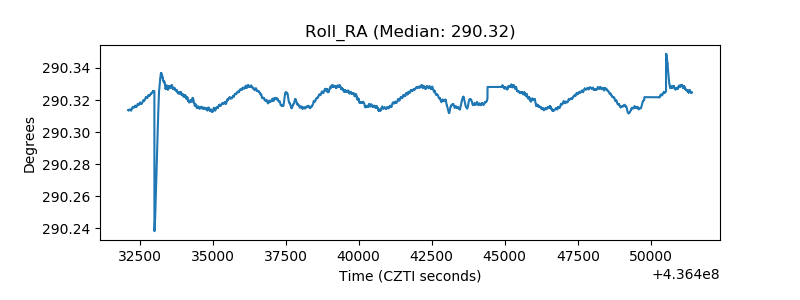 |
| Veto Counter | 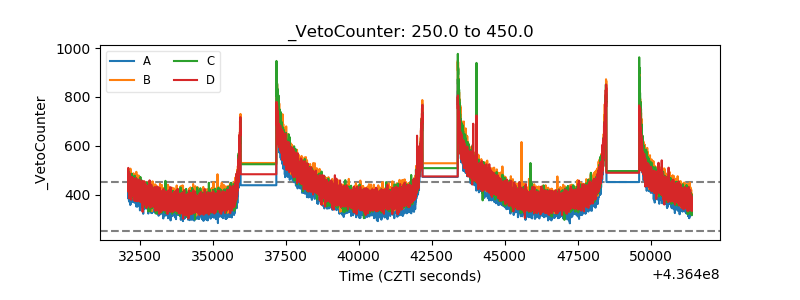 |