| Param | Original file | Final file |
|---|---|---|
| Filename | modeM0/AS1A13_026T01_9000005904_43751cztM0_level2.fits | modeM0/AS1A13_026T01_9000005904_43751cztM0_level2_quad_clean.evt |
| Size (bytes) | 542,520,000 | 103,400,640 |
| Size | 517.4 MB | 98.6 MB |
| Events in quadrant A | 5,629,103 | 690,898 |
| Events in quadrant B | 3,332,148 | 735,999 |
| Events in quadrant C | 3,474,158 | 705,938 |
| Events in quadrant D | 7,163,248 | 562,663 |
| Mode M0 | |||
|---|---|---|---|
| Quadrant | BADHDUFLAG | Total packets | Discarded packets |
| A | 0 | 21220 | 1 |
| B | 0 | 13976 | 1 |
| C | 0 | 14506 | 1 |
| D | 0 | 25639 | 1 |
| Mode SS | |||
|---|---|---|---|
| Quadrant | BADHDUFLAG | Total packets | Discarded packets |
| A | 0 | 126 | 0 |
| B | 0 | 126 | 0 |
| C | 0 | 126 | 0 |
| D | 0 | 126 | 0 |
| Mode M9 | |||
|---|---|---|---|
| Quadrant | BADHDUFLAG | Total packets | Discarded packets |
| A | 0 | 10 | 0 |
| B | 0 | 10 | 0 |
| C | 0 | 10 | 0 |
| D | 0 | 10 | 0 |
| Quadrant | Total seconds | Saturated seconds | Saturation percentage |
|---|---|---|---|
| A | 6239 | 401 | 6.427312% |
| B | 6239 | 152 | 2.436288% |
| C | 6239 | 132 | 2.115724% |
| D | 6239 | 1011 | 16.204520% |
Noise dominated data is calculated using 1-second bins in cleaned event files. If a bin has >2000 counts, and if more than 50% of those come from <1% of pixels, then it is considered to be noise-dominated and hence unusable.
| Quadrant | # 1 sec bins | Bins with >0 counts | Bins with >2000 counts | High rate bins dominated by noise | Noise dominated (total time) | Noise dominated (detector-on time) | Marked lightcurve |
|---|---|---|---|---|---|---|---|
| A | 7229 | 6240 | 148 | 148 | 2.05% | 2.37% | 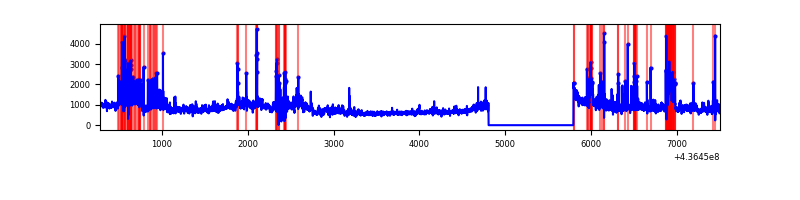 |
| B | 7229 | 6240 | 27 | 27 | 0.37% | 0.43% | 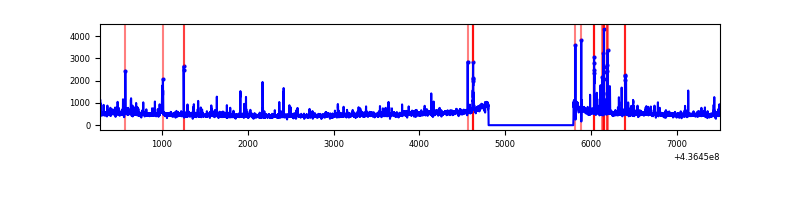 |
| C | 7229 | 6240 | 42 | 42 | 0.58% | 0.67% | 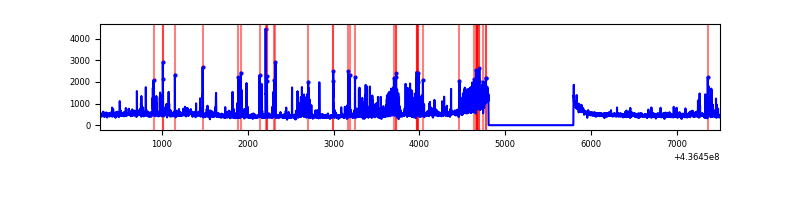 |
| D | 7229 | 6240 | 804 | 804 | 11.12% | 12.88% | 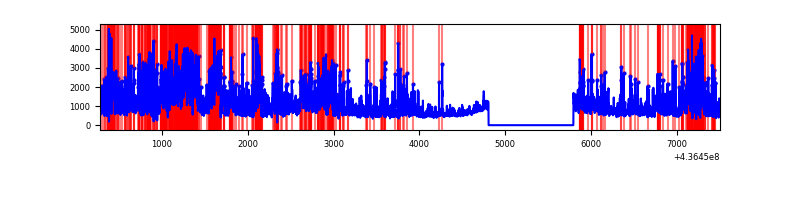 |
Top three noisy pixels from each quadrant. If the there are fewer than three noisy pixels in the level2.evt file, extra rows are filled as -1
| Pixel properties | Quadrant properties | ||||||
|---|---|---|---|---|---|---|---|
| Quadrant | DetID | PixID | Counts | Sigma | Mean | Median | Sigma |
| A | 14 | 63 | 957493 | 6322.35 | 724 | 709 | 151.3 |
| A | 10 | 83 | 911296 | 6017.09 | 724 | 709 | 151.3 |
| A | 15 | 223 | 432470 | 2853.04 | 724 | 709 | 151.3 |
| B | 0 | 199 | 100677 | 700.73 | 733 | 713 | 142.7 |
| B | 4 | 171 | 80712 | 560.78 | 733 | 713 | 142.7 |
| B | 0 | 200 | 41687 | 287.22 | 733 | 713 | 142.7 |
| C | 15 | 158 | 325587 | 1939.07 | 711 | 717 | 167.5 |
| C | 15 | 173 | 126284 | 749.48 | 711 | 717 | 167.5 |
| C | 15 | 157 | 121752 | 722.43 | 711 | 717 | 167.5 |
| D | 15 | 0 | 1069279 | 6086.63 | 679 | 658 | 175.6 |
| D | 1 | 52 | 914338 | 5204.12 | 679 | 658 | 175.6 |
| D | 5 | 235 | 668711 | 3805.09 | 679 | 658 | 175.6 |
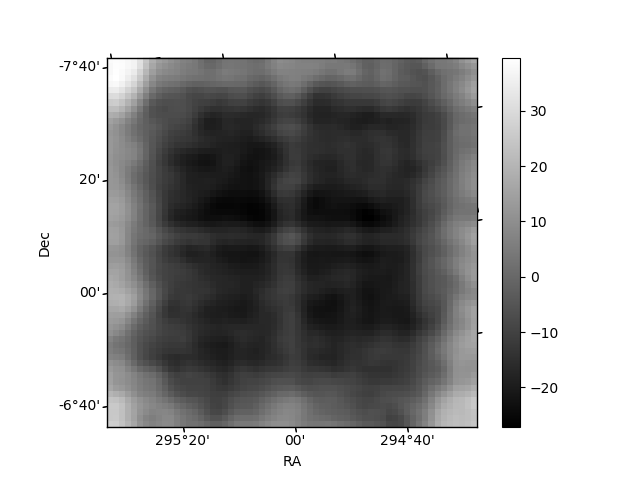
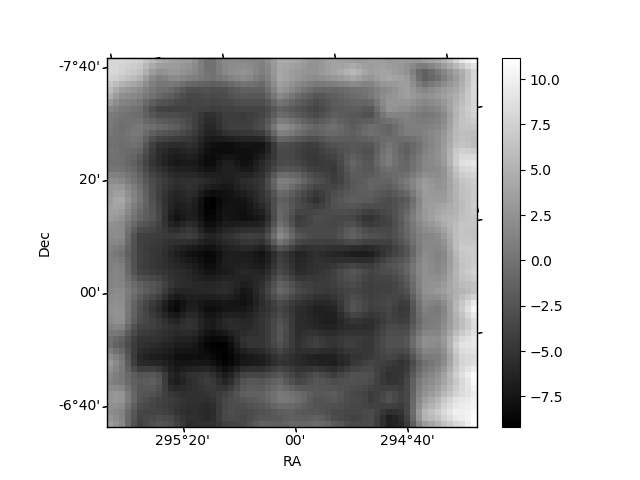
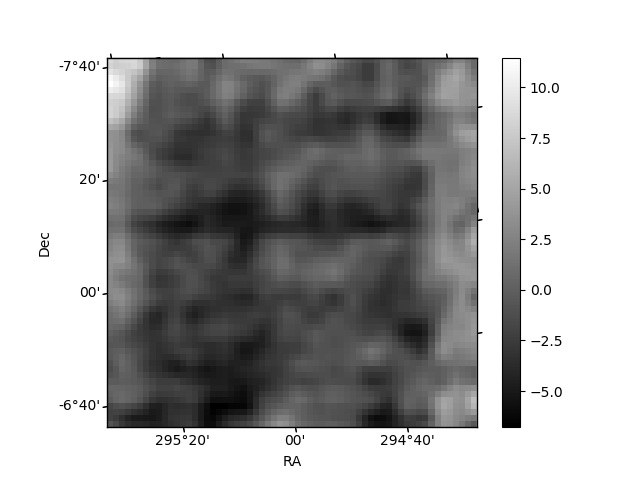
Histogram calculated using DETX and DETY for each event in the final _common_clean file
| Quadrant A | 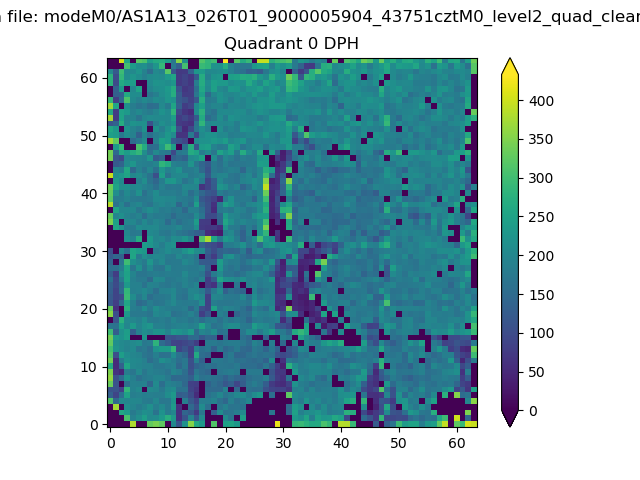 |
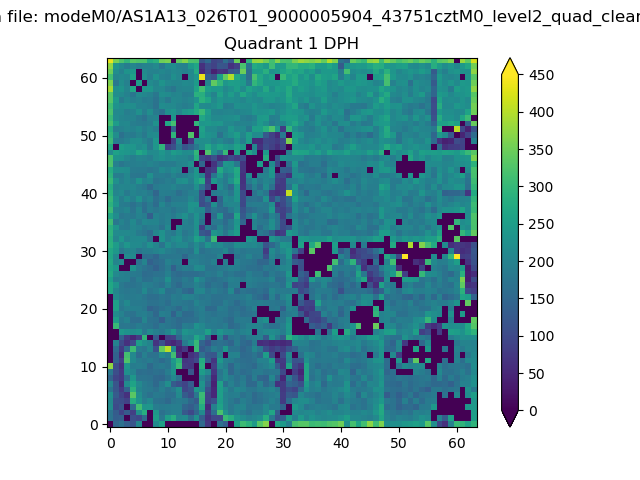 |
Quadrant B |
|---|---|---|---|
| Quadrant D | 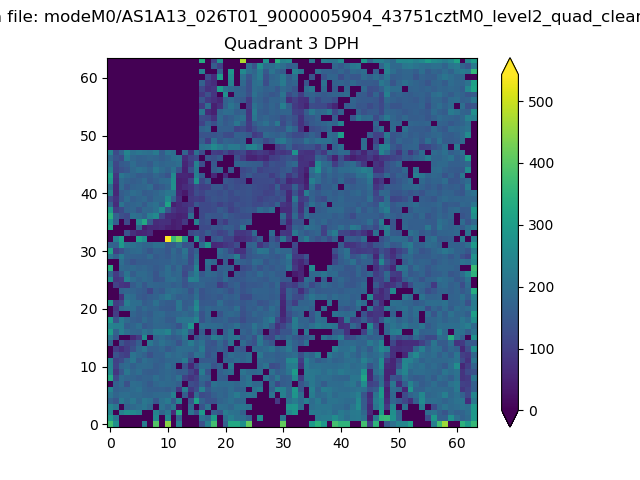 |
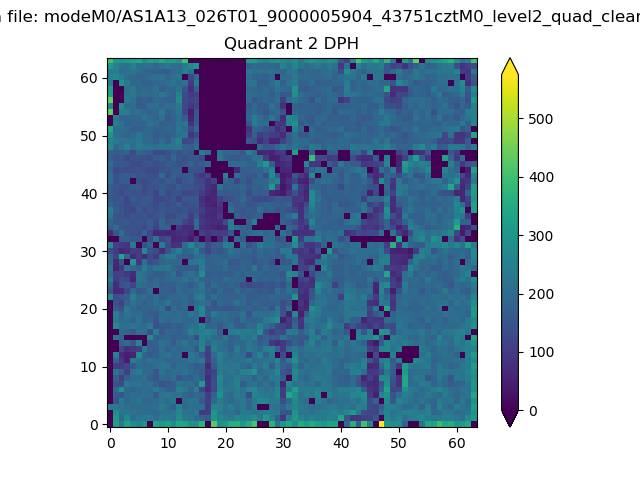 |
Quadrant C |
| Plot type | Count rate plots | Images |
|---|---|---|
| Comparison with Poisson distribution Blue bars denote a histogram of data divided into 1 sec bins. Red curve is a Poisson curve with rate = median count rate of data. |
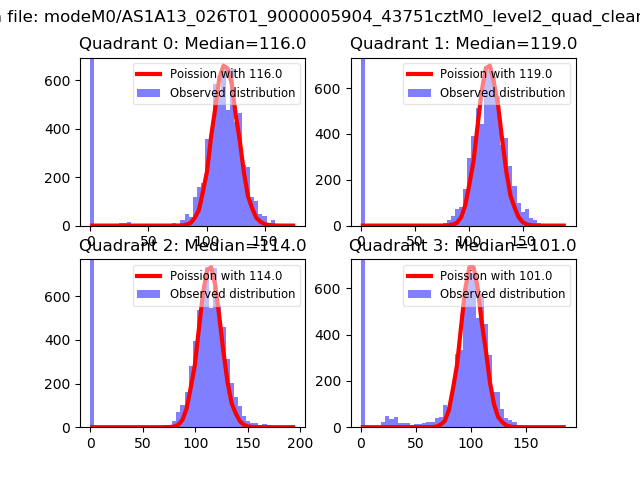 |
 |
| Quadrant-wise count rates Data is divided into 100 sec bins |
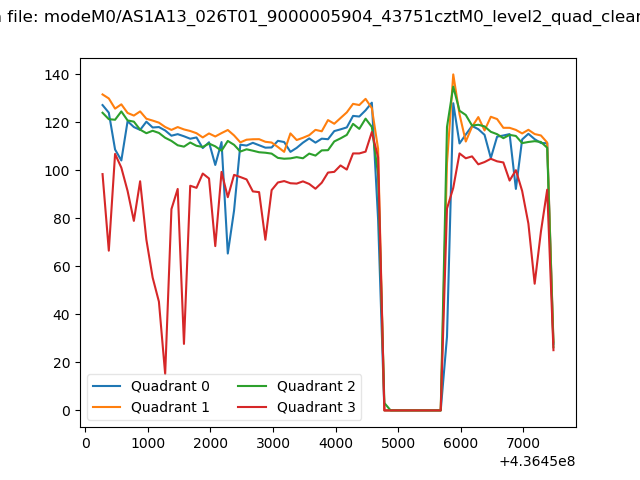 |
|
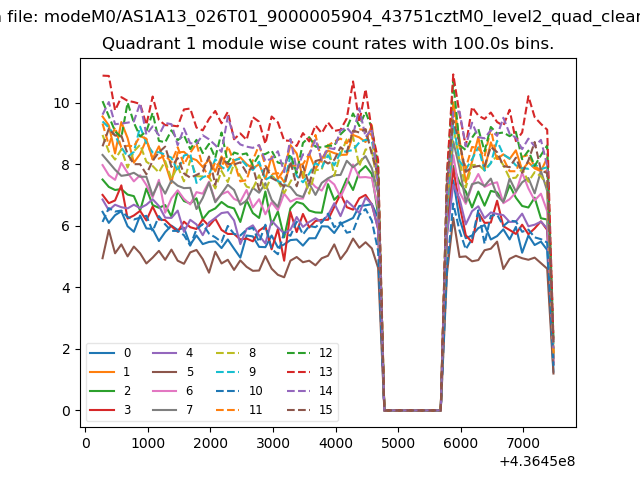
| Module-wise count rates for Quadrant A Data is divided into 100 sec bins |
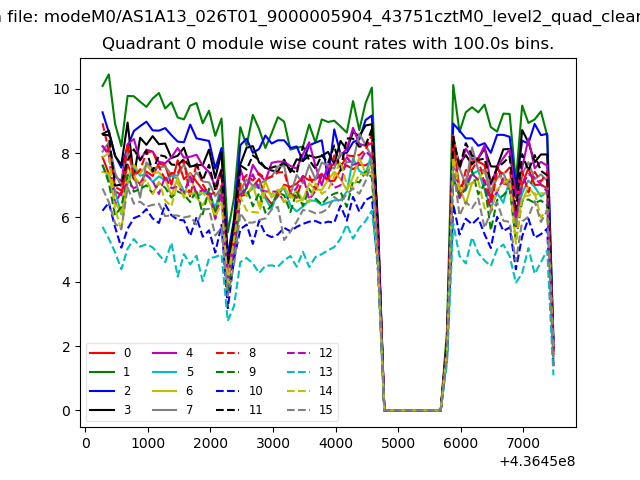 |
 |
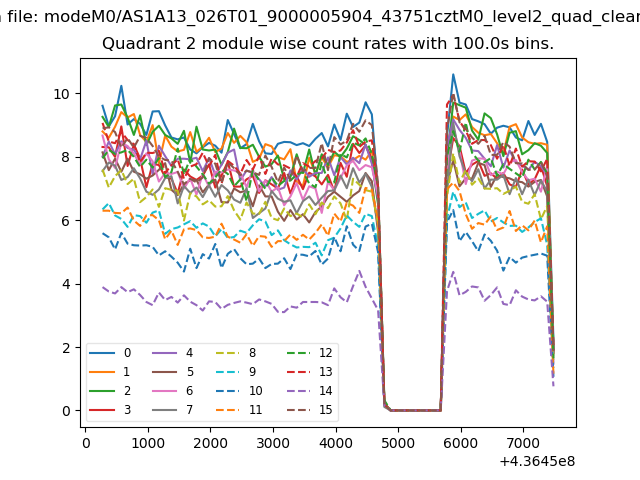
| Module-wise count rates for Quadrant B Data is divided into 100 sec bins |
 |
 |
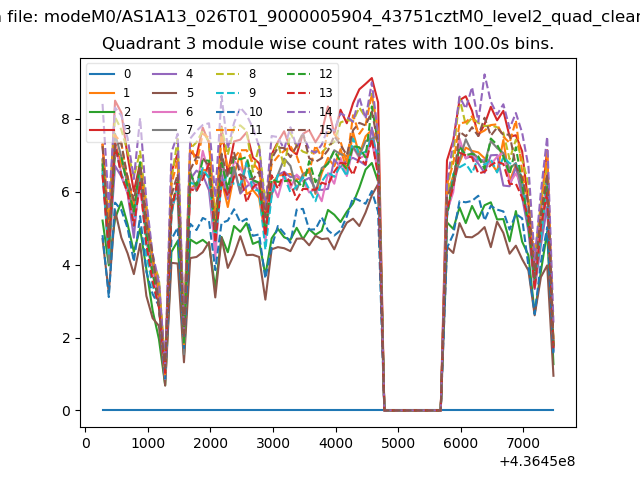
| Module-wise count rates for Quadrant C Data is divided into 100 sec bins |
 |
 |
| Module-wise count rates for Quadrant D Data is divided into 100 sec bins |
 |
 |
| Parameter | Plot |
|---|---|
| CZT HV Monitor | 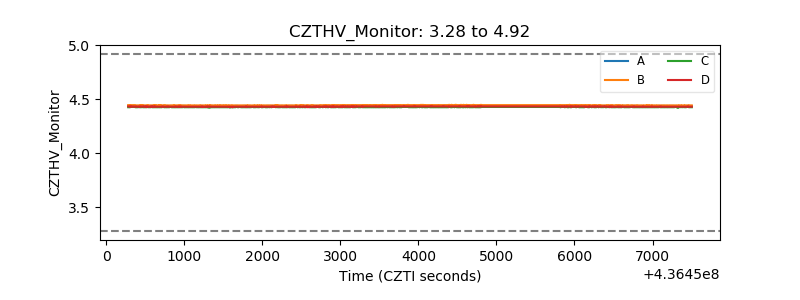 |
| D_VDD | 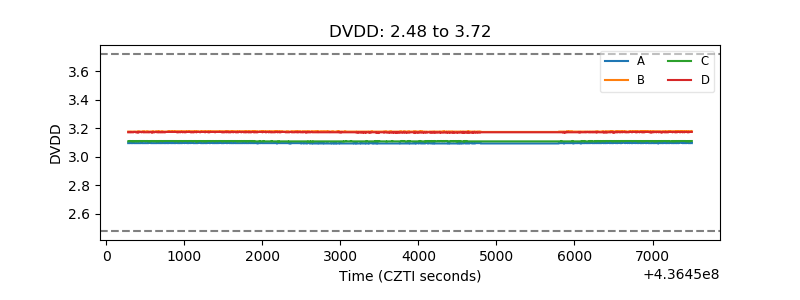 |
| Temperature 1 | 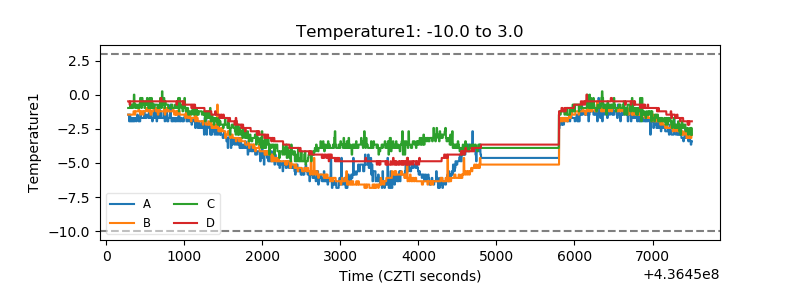 |
| Veto HV Monitor | 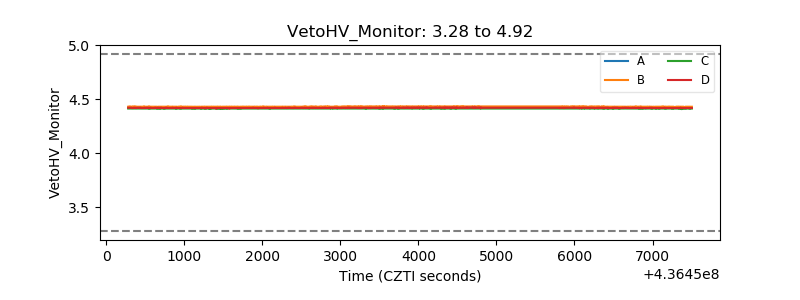 |
| Veto LLD | 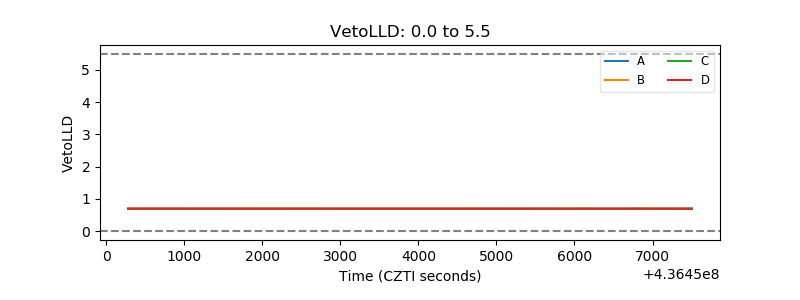 |
| Alpha Counter | 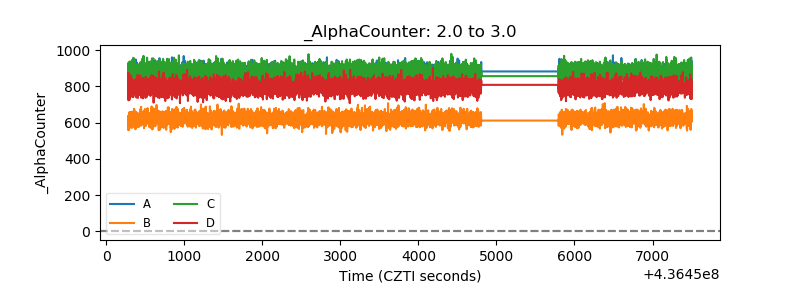 |
| _CPM_Rate | 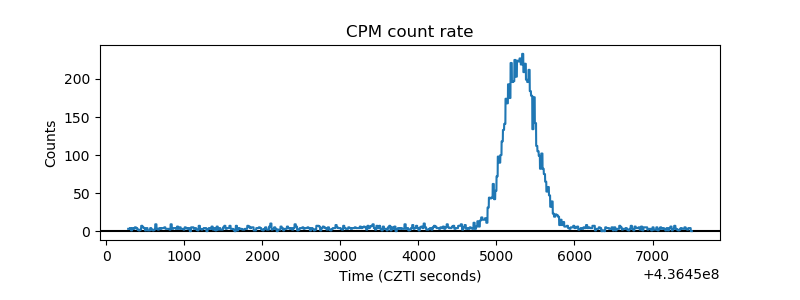 |
| CZT Counter | 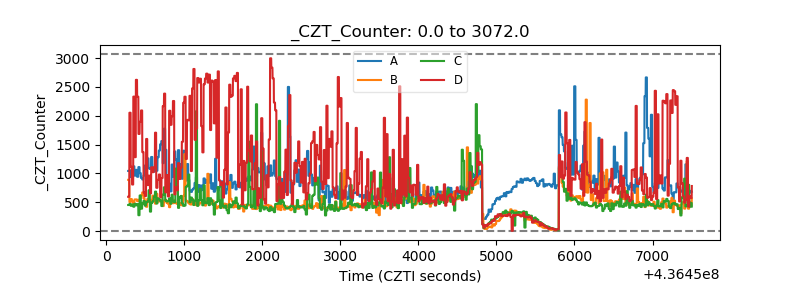 |
| +2.5 Volts monitor | 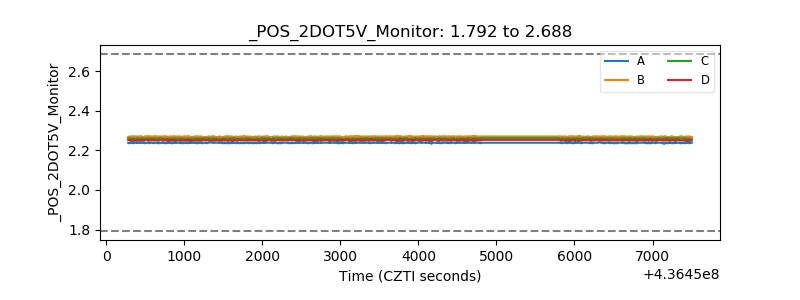 |
| +5 Volts monitor | 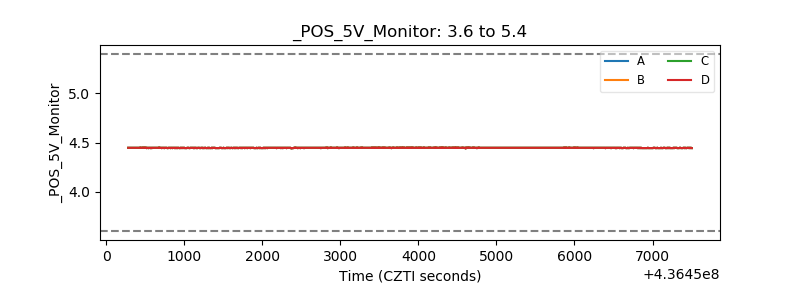 |
| _ROLL_ROT |  |
| _Roll_DEC | 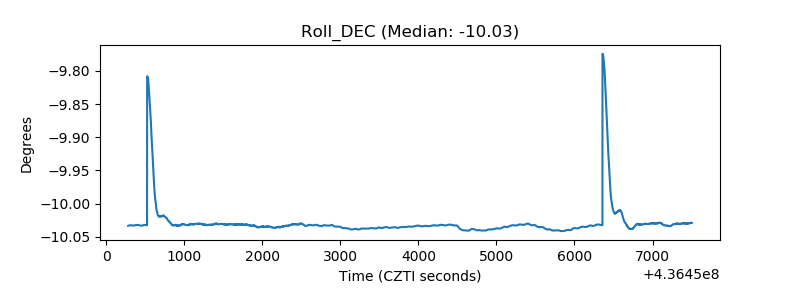 |
| _Roll_RA | 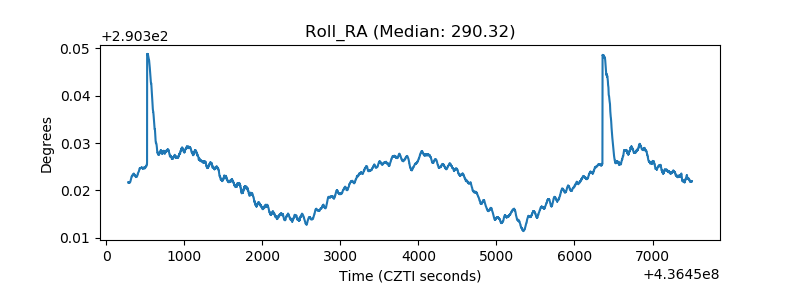 |
| Veto Counter |  |