| Param | Original file | Final file |
|---|---|---|
| Filename | modeM0/AS1A13_026T01_9000005904_43752cztM0_level2.fits | modeM0/AS1A13_026T01_9000005904_43752cztM0_level2_quad_clean.evt |
| Size (bytes) | 634,181,760 | 107,265,600 |
| Size | 604.8 MB | 102.3 MB |
| Events in quadrant A | 6,861,297 | 712,582 |
| Events in quadrant B | 3,986,808 | 768,419 |
| Events in quadrant C | 4,127,238 | 740,123 |
| Events in quadrant D | 7,977,303 | 556,275 |
| Mode M0 | |||
|---|---|---|---|
| Quadrant | BADHDUFLAG | Total packets | Discarded packets |
| A | 0 | 25208 | 5 |
| B | 0 | 16349 | 1 |
| C | 0 | 16843 | 1 |
| D | 0 | 28321 | 1 |
| Mode SS | |||
|---|---|---|---|
| Quadrant | BADHDUFLAG | Total packets | Discarded packets |
| A | 0 | 136 | 0 |
| B | 0 | 136 | 0 |
| C | 0 | 136 | 0 |
| D | 0 | 136 | 0 |
| Mode M9 | |||
|---|---|---|---|
| Quadrant | BADHDUFLAG | Total packets | Discarded packets |
| A | 0 | 7 | 0 |
| B | 0 | 7 | 0 |
| C | 0 | 7 | 0 |
| D | 0 | 7 | 0 |
| Quadrant | Total seconds | Saturated seconds | Saturation percentage |
|---|---|---|---|
| A | 6749 | 527 | 7.808564% |
| B | 6749 | 200 | 2.963402% |
| C | 6750 | 208 | 3.081481% |
| D | 6750 | 1412 | 20.918519% |
Noise dominated data is calculated using 1-second bins in cleaned event files. If a bin has >2000 counts, and if more than 50% of those come from <1% of pixels, then it is considered to be noise-dominated and hence unusable.
| Quadrant | # 1 sec bins | Bins with >0 counts | Bins with >2000 counts | High rate bins dominated by noise | Noise dominated (total time) | Noise dominated (detector-on time) | Marked lightcurve |
|---|---|---|---|---|---|---|---|
| A | 7419 | 6750 | 289 | 289 | 3.90% | 4.28% | 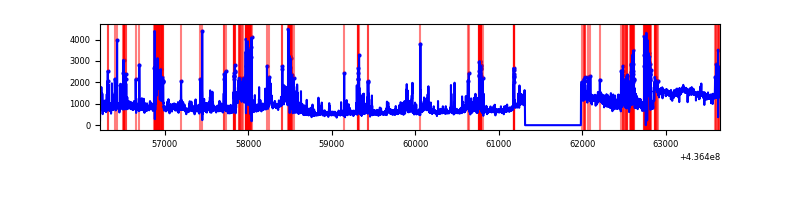 |
| B | 7419 | 6750 | 77 | 77 | 1.04% | 1.14% | 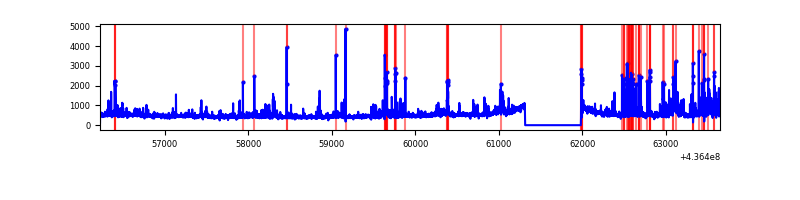 |
| C | 7420 | 6751 | 159 | 159 | 2.14% | 2.36% | 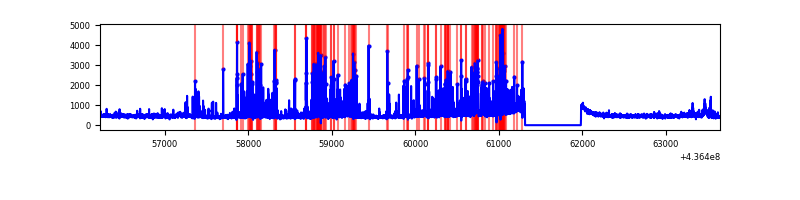 |
| D | 7420 | 6751 | 1134 | 1134 | 15.28% | 16.80% | 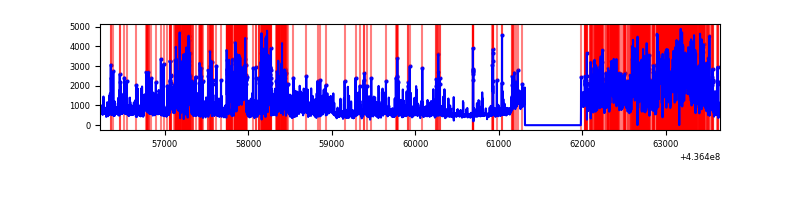 |
Top three noisy pixels from each quadrant. If the there are fewer than three noisy pixels in the level2.evt file, extra rows are filled as -1
| Pixel properties | Quadrant properties | ||||||
|---|---|---|---|---|---|---|---|
| Quadrant | DetID | PixID | Counts | Sigma | Mean | Median | Sigma |
| A | 14 | 63 | 1683057 | 10567.5 | 762 | 747 | 159.2 |
| A | 10 | 83 | 955003 | 5994.2 | 762 | 747 | 159.2 |
| A | 15 | 223 | 608988 | 3820.69 | 762 | 747 | 159.2 |
| B | 0 | 200 | 323638 | 2121.98 | 779 | 758 | 152.2 |
| B | 0 | 199 | 174372 | 1141.0 | 779 | 758 | 152.2 |
| B | 15 | 36 | 83890 | 546.35 | 779 | 758 | 152.2 |
| C | 15 | 158 | 706412 | 3946.61 | 756 | 761 | 178.8 |
| C | 15 | 157 | 247466 | 1379.79 | 756 | 761 | 178.8 |
| C | 3 | 233 | 88597 | 491.26 | 756 | 761 | 178.8 |
| D | 1 | 52 | 1362086 | 7432.43 | 699 | 677 | 183.2 |
| D | 5 | 235 | 1267524 | 6916.18 | 699 | 677 | 183.2 |
| D | 15 | 0 | 729132 | 3976.9 | 699 | 677 | 183.2 |
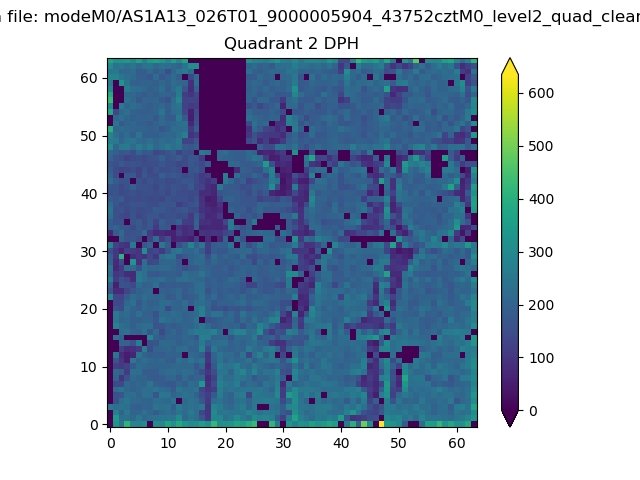
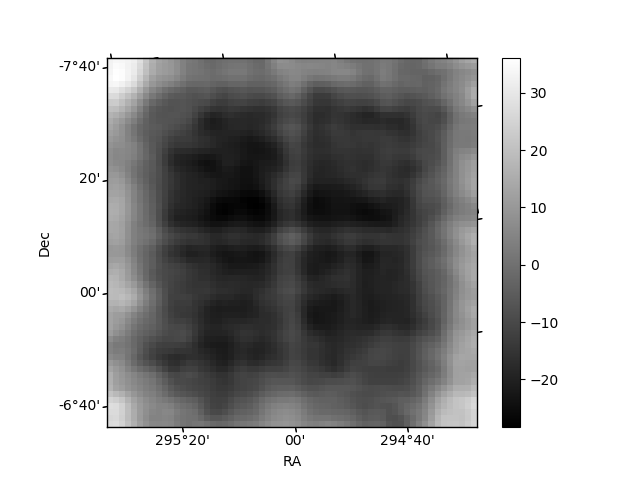
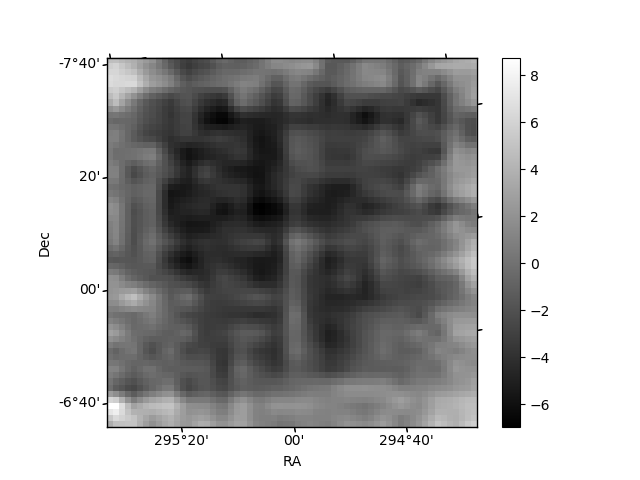
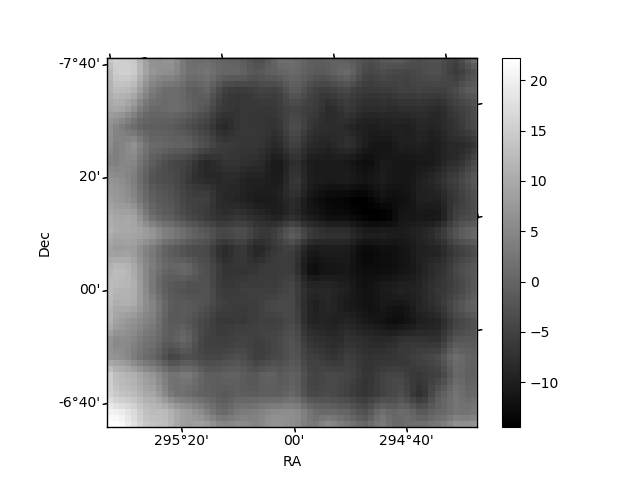
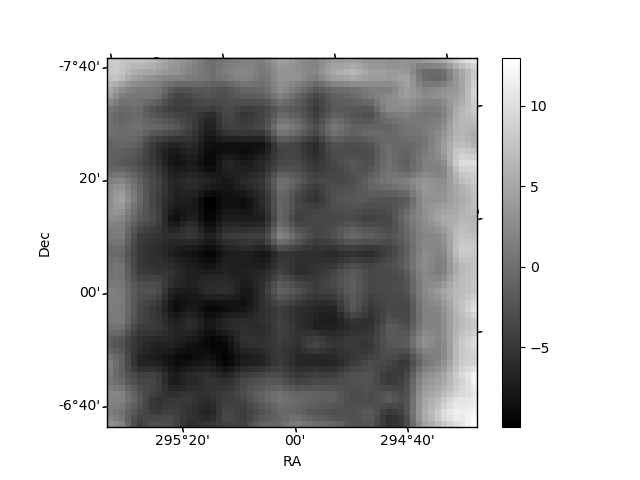
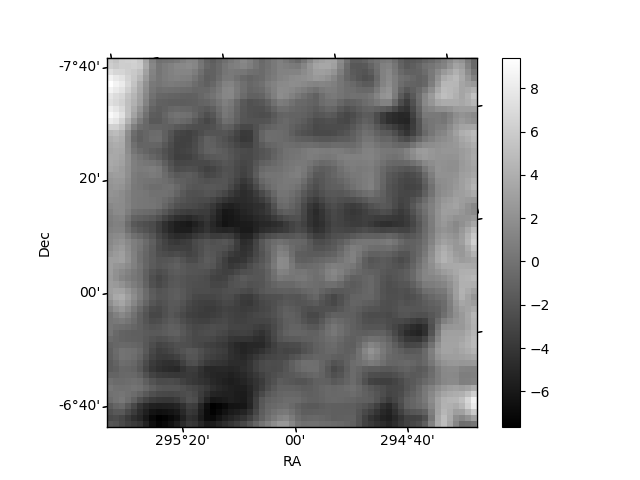
Histogram calculated using DETX and DETY for each event in the final _common_clean file
| Quadrant A | 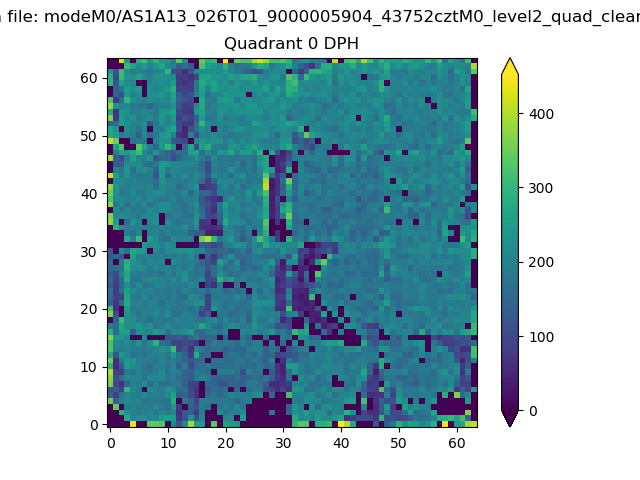 |
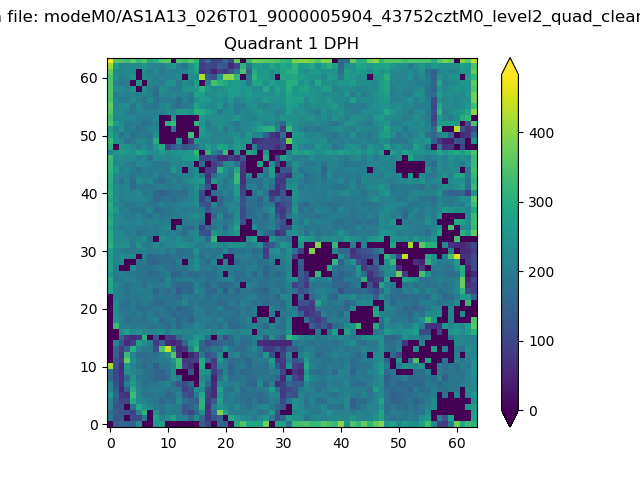 |
Quadrant B |
|---|---|---|---|
| Quadrant D | 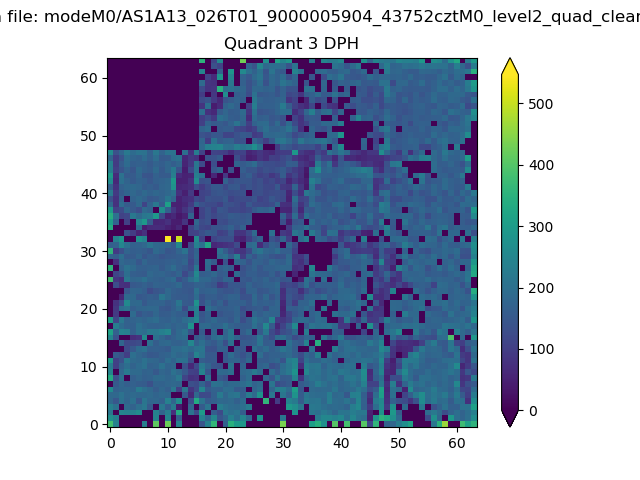 |
 |
Quadrant C |
| Plot type | Count rate plots | Images |
|---|---|---|
| Comparison with Poisson distribution Blue bars denote a histogram of data divided into 1 sec bins. Red curve is a Poisson curve with rate = median count rate of data. |
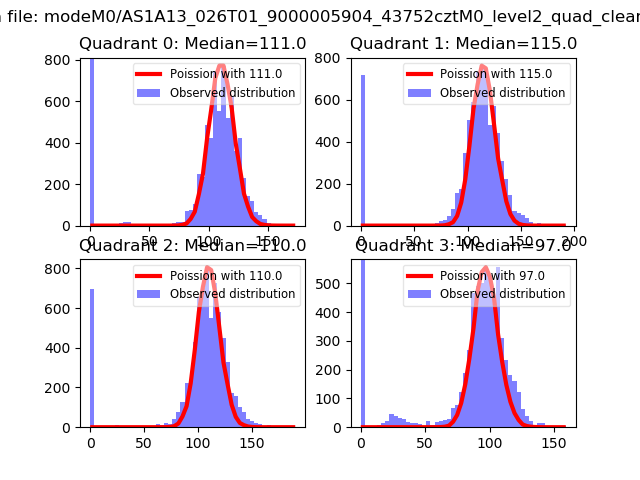 |
 |
| Quadrant-wise count rates Data is divided into 100 sec bins |
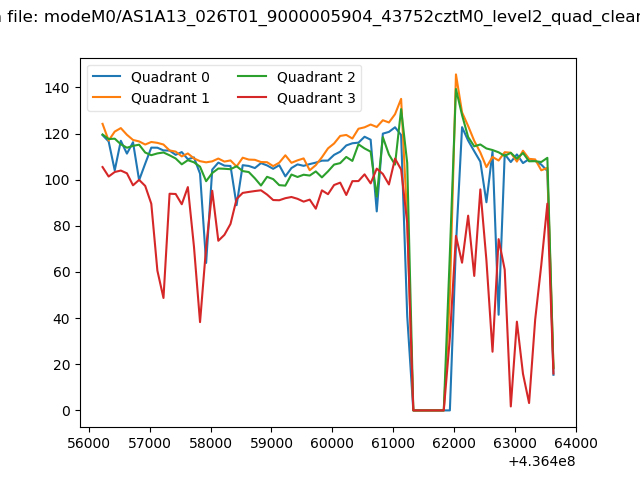 |
|
| Module-wise count rates for Quadrant A Data is divided into 100 sec bins |
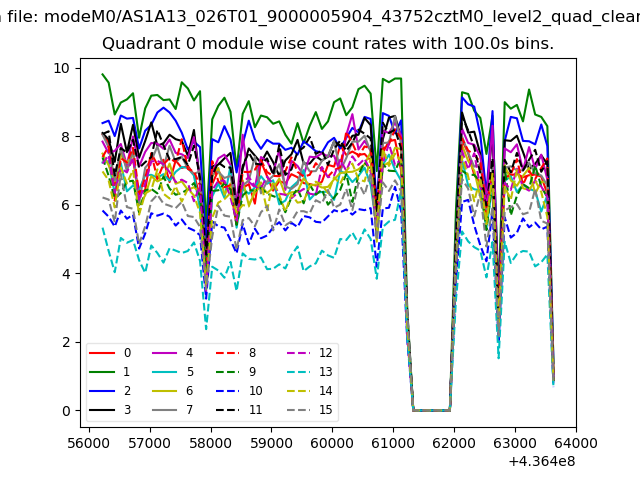 |
 |
| Module-wise count rates for Quadrant B Data is divided into 100 sec bins |
 |
 |
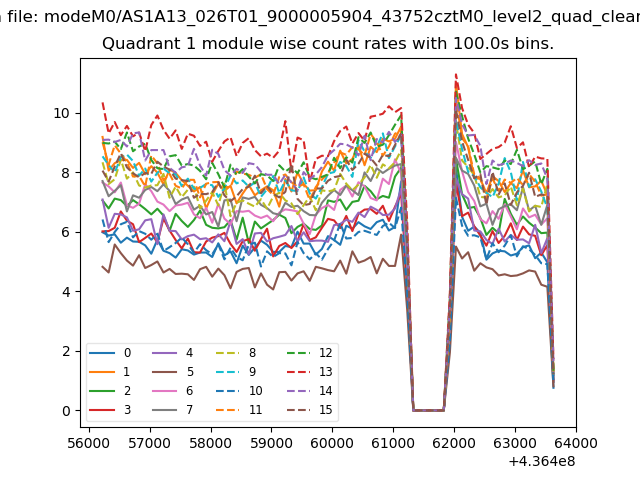
| Module-wise count rates for Quadrant C Data is divided into 100 sec bins |
 |
 |
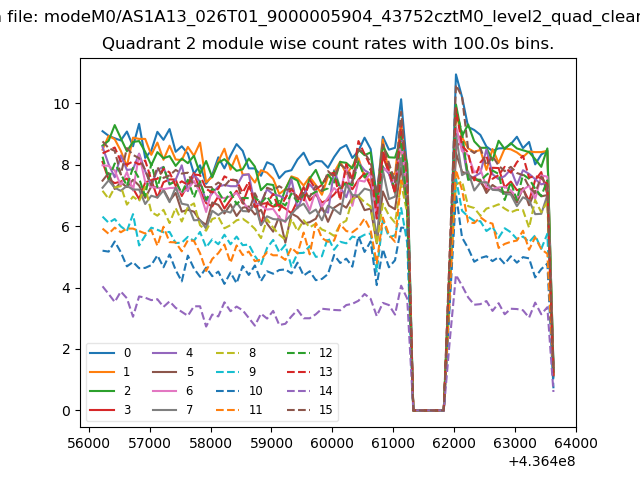
| Module-wise count rates for Quadrant D Data is divided into 100 sec bins |
 |
 |
| Parameter | Plot |
|---|---|
| CZT HV Monitor | 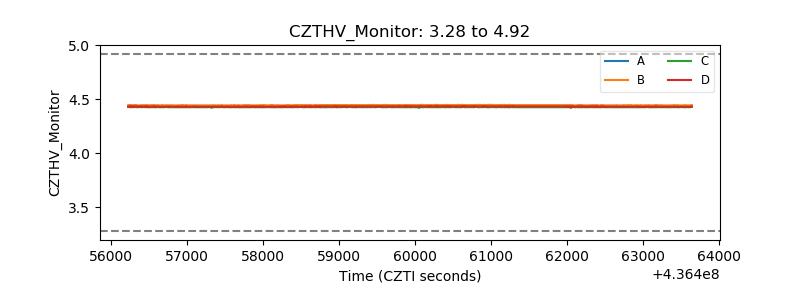 |
| D_VDD | 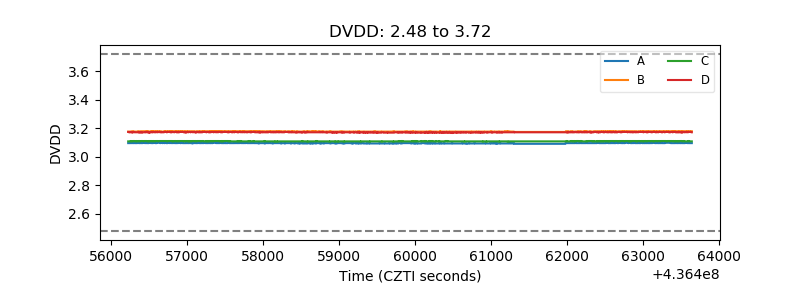 |
| Temperature 1 | 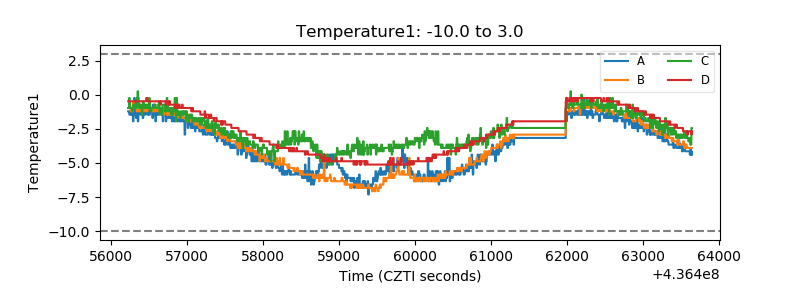 |
| Veto HV Monitor | 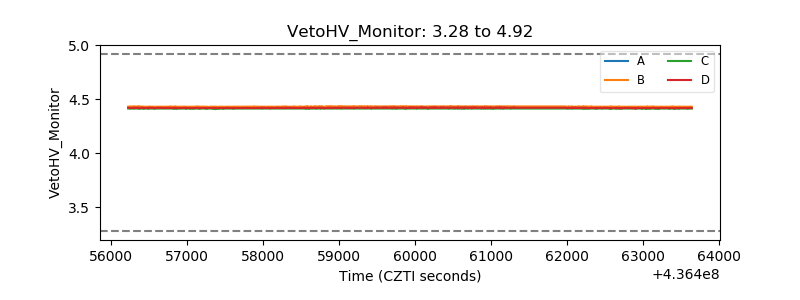 |
| Veto LLD | 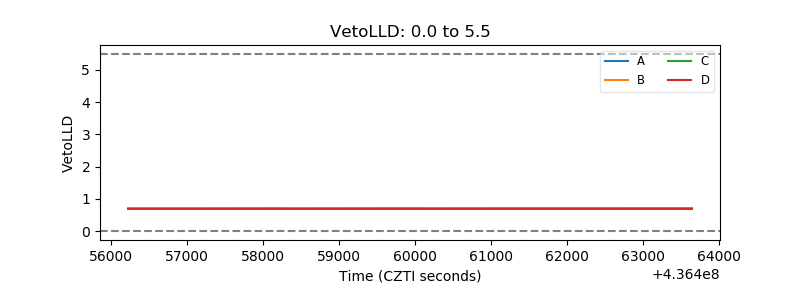 |
| Alpha Counter | 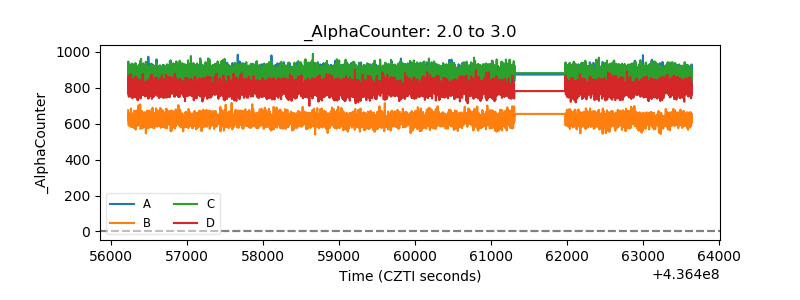 |
| _CPM_Rate | 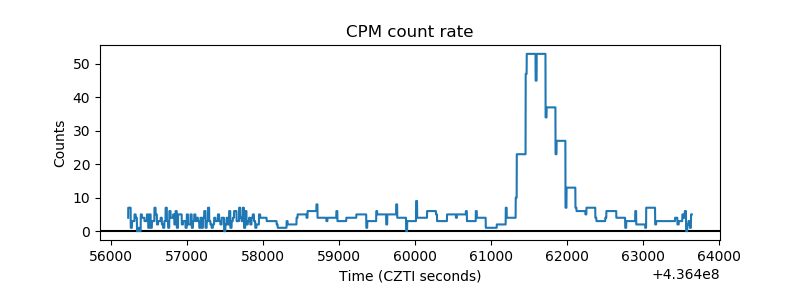 |
| CZT Counter | 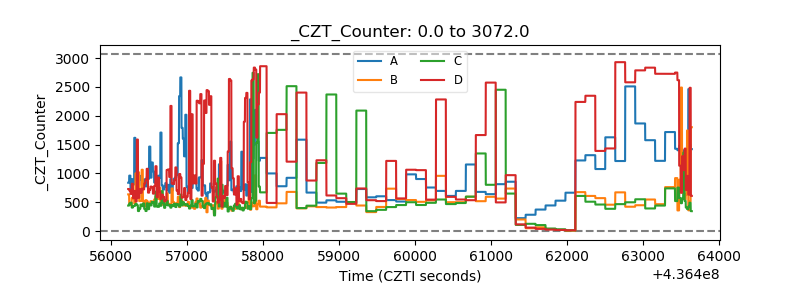 |
| +2.5 Volts monitor | 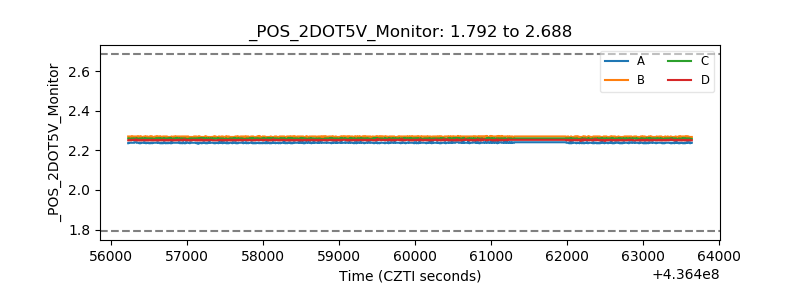 |
| +5 Volts monitor | 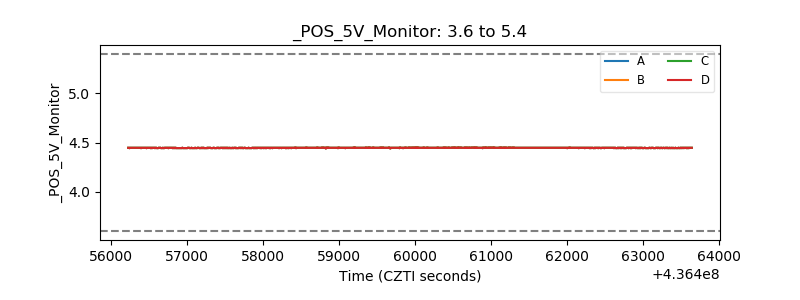 |
| _ROLL_ROT | 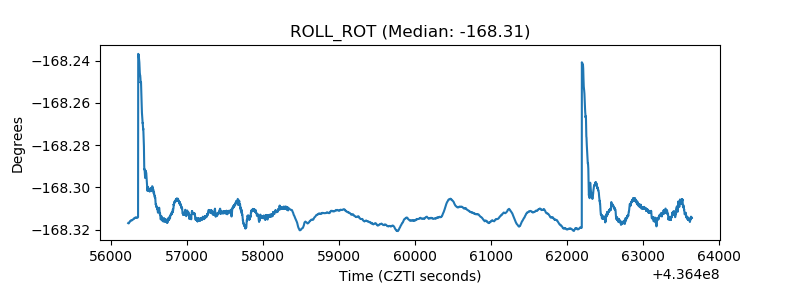 |
| _Roll_DEC | 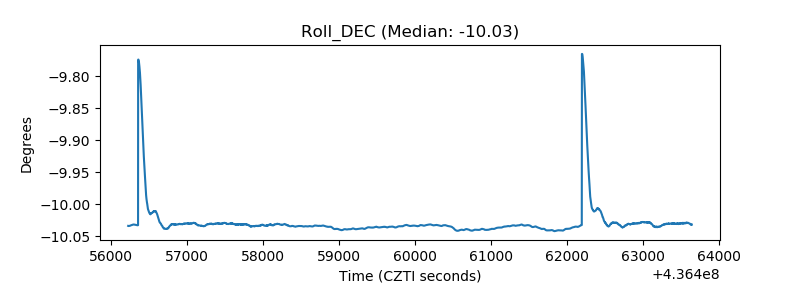 |
| _Roll_RA | 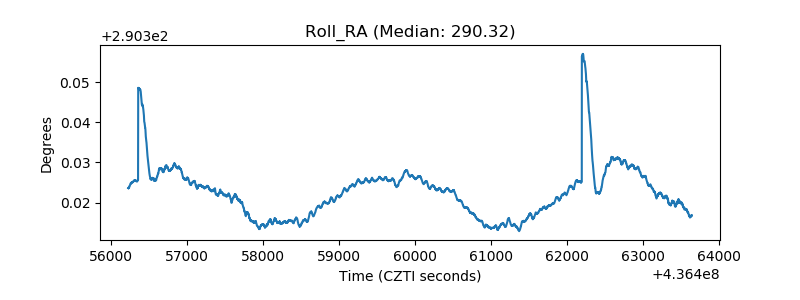 |
| Veto Counter |  |