| Param | Original file | Final file |
|---|---|---|
| Filename | modeM0/AS1A13_026T01_9000005904_43753cztM0_level2.fits | modeM0/AS1A13_026T01_9000005904_43753cztM0_level2_quad_clean.evt |
| Size (bytes) | 782,951,040 | 108,051,840 |
| Size | 746.7 MB | 103.0 MB |
| Events in quadrant A | 8,622,122 | 710,516 |
| Events in quadrant B | 5,869,843 | 730,039 |
| Events in quadrant C | 4,968,743 | 765,376 |
| Events in quadrant D | 8,972,250 | 570,059 |
| Mode M0 | |||
|---|---|---|---|
| Quadrant | BADHDUFLAG | Total packets | Discarded packets |
| A | 0 | 30740 | 0 |
| B | 0 | 22354 | 0 |
| C | 0 | 19756 | 0 |
| D | 0 | 31589 | 0 |
| Mode SS | |||
|---|---|---|---|
| Quadrant | BADHDUFLAG | Total packets | Discarded packets |
| A | 0 | 142 | 0 |
| B | 0 | 142 | 0 |
| C | 0 | 142 | 0 |
| D | 0 | 142 | 0 |
| Quadrant | Total seconds | Saturated seconds | Saturation percentage |
|---|---|---|---|
| A | 7111 | 1003 | 14.104908% |
| B | 7111 | 836 | 11.756434% |
| C | 7111 | 322 | 4.528196% |
| D | 7112 | 1691 | 23.776715% |
Noise dominated data is calculated using 1-second bins in cleaned event files. If a bin has >2000 counts, and if more than 50% of those come from <1% of pixels, then it is considered to be noise-dominated and hence unusable.
| Quadrant | # 1 sec bins | Bins with >0 counts | Bins with >2000 counts | High rate bins dominated by noise | Noise dominated (total time) | Noise dominated (detector-on time) | Marked lightcurve |
|---|---|---|---|---|---|---|---|
| A | 7111 | 7111 | 473 | 473 | 6.65% | 6.65% | 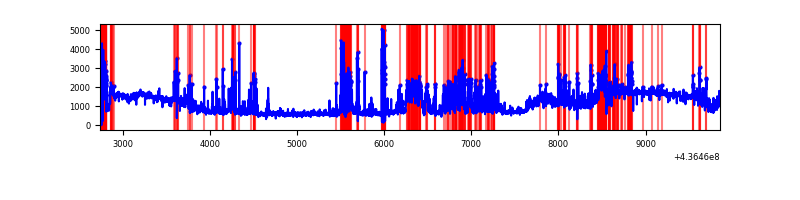 |
| B | 7111 | 7111 | 469 | 469 | 6.60% | 6.60% | 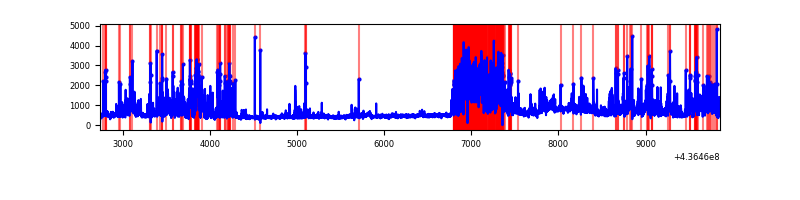 |
| C | 7111 | 7111 | 217 | 217 | 3.05% | 3.05% | 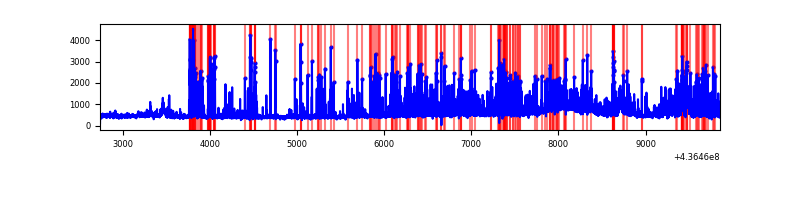 |
| D | 7112 | 7112 | 1342 | 1342 | 18.87% | 18.87% | 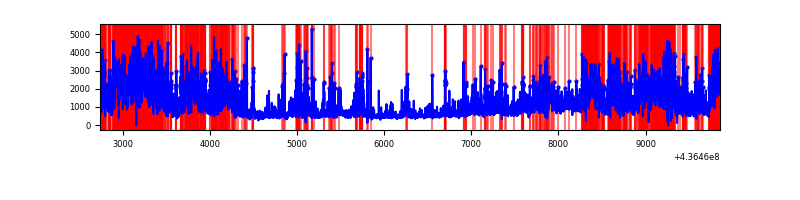 |
Top three noisy pixels from each quadrant. If the there are fewer than three noisy pixels in the level2.evt file, extra rows are filled as -1
| Pixel properties | Quadrant properties | ||||||
|---|---|---|---|---|---|---|---|
| Quadrant | DetID | PixID | Counts | Sigma | Mean | Median | Sigma |
| A | 14 | 63 | 3041088 | 18378.7 | 793 | 779 | 165.4 |
| A | 15 | 223 | 1050423 | 6345.11 | 793 | 779 | 165.4 |
| A | 10 | 83 | 909933 | 5495.84 | 793 | 779 | 165.4 |
| B | 0 | 200 | 2058923 | 13126.05 | 794 | 770 | 156.8 |
| B | 5 | 235 | 227947 | 1448.84 | 794 | 770 | 156.8 |
| B | 4 | 171 | 112103 | 710.04 | 794 | 770 | 156.8 |
| C | 15 | 158 | 1292971 | 6854.97 | 799 | 803 | 188.5 |
| C | 15 | 157 | 296110 | 1566.61 | 799 | 803 | 188.5 |
| C | 3 | 233 | 102621 | 540.15 | 799 | 803 | 188.5 |
| D | 5 | 235 | 1534777 | 8006.66 | 734 | 708 | 191.6 |
| D | 1 | 52 | 994659 | 5187.66 | 734 | 708 | 191.6 |
| D | 4 | 221 | 590626 | 3078.92 | 734 | 708 | 191.6 |
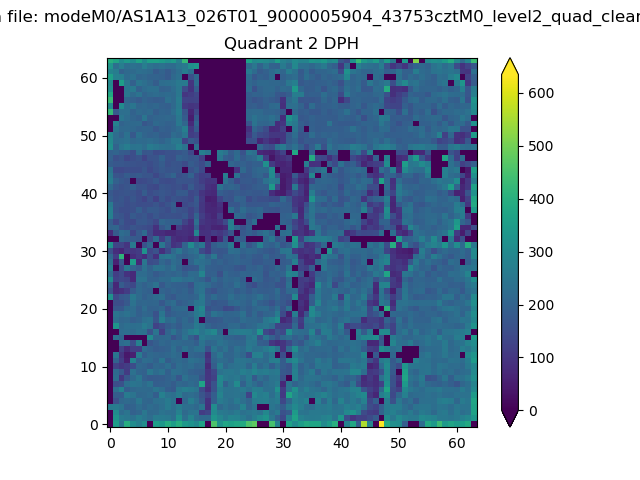
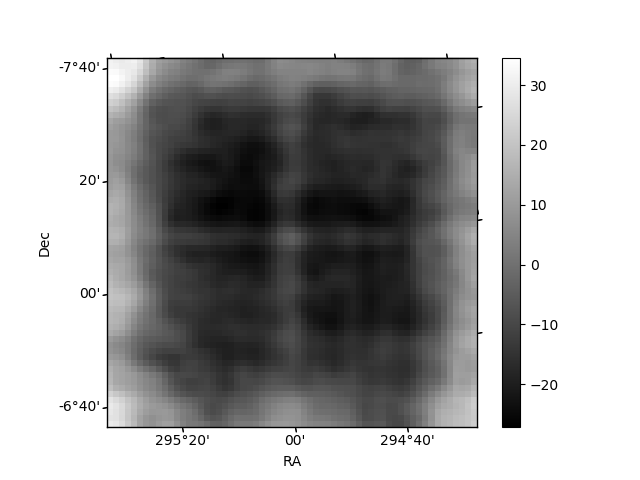
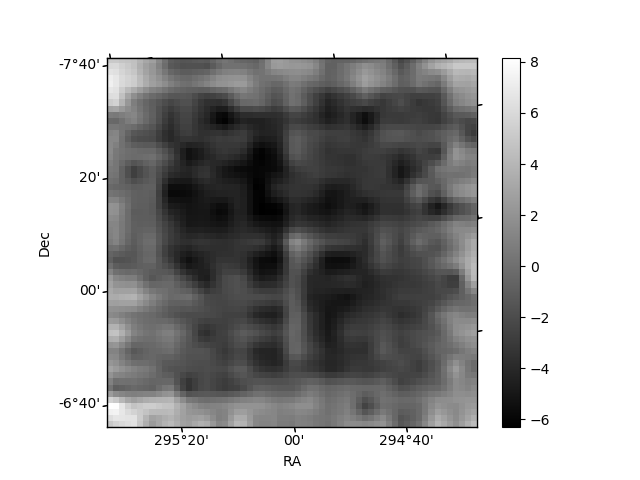
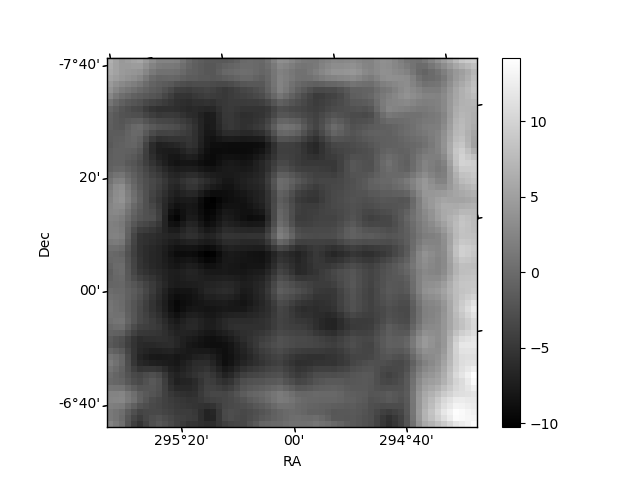
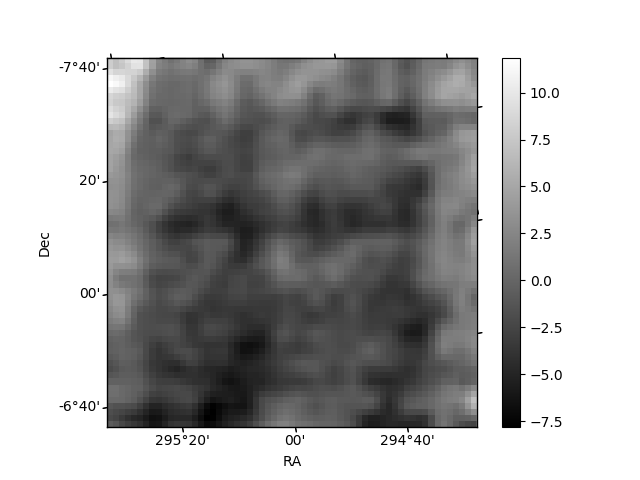
Histogram calculated using DETX and DETY for each event in the final _common_clean file
| Quadrant A | 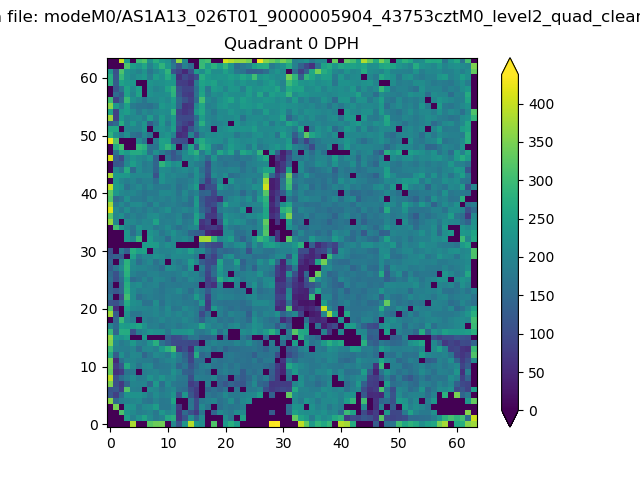 |
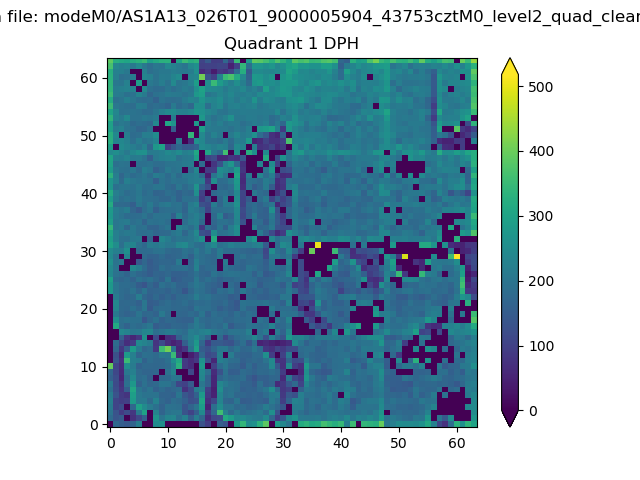 |
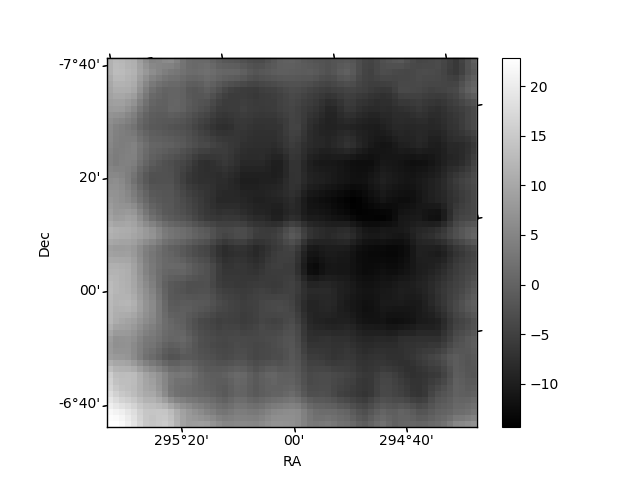
Quadrant B |
|---|---|---|---|
| Quadrant D | 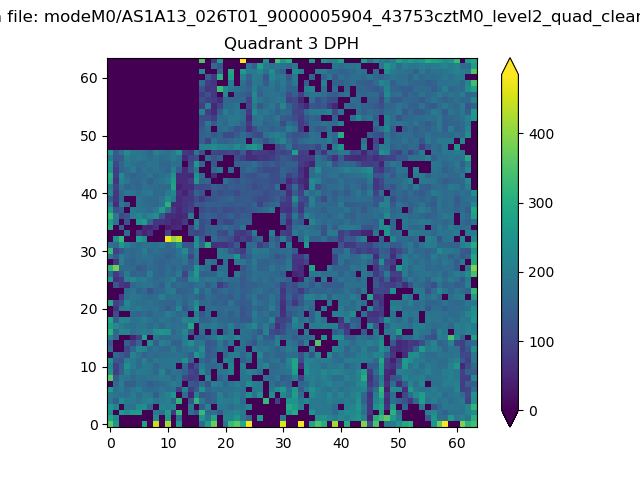 |
 |
Quadrant C |
| Plot type | Count rate plots | Images |
|---|---|---|
| Comparison with Poisson distribution Blue bars denote a histogram of data divided into 1 sec bins. Red curve is a Poisson curve with rate = median count rate of data. |
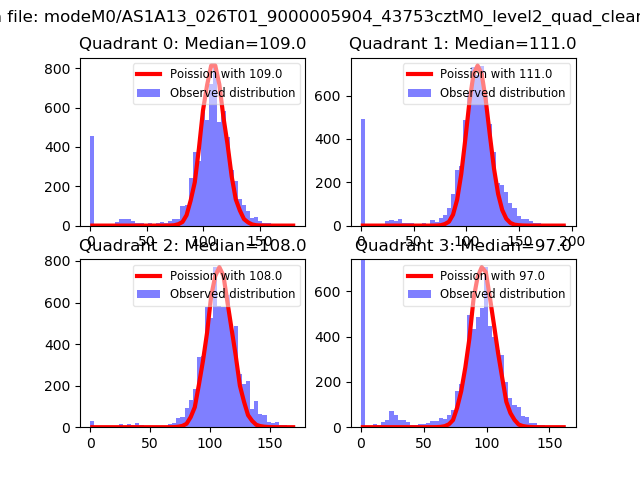 |
 |
| Quadrant-wise count rates Data is divided into 100 sec bins |
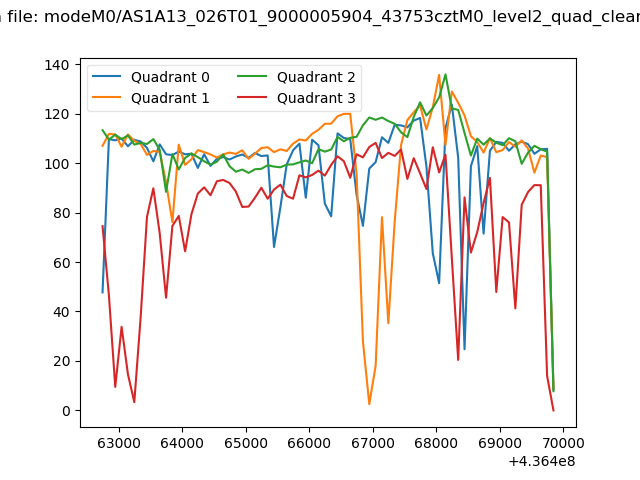 |
|
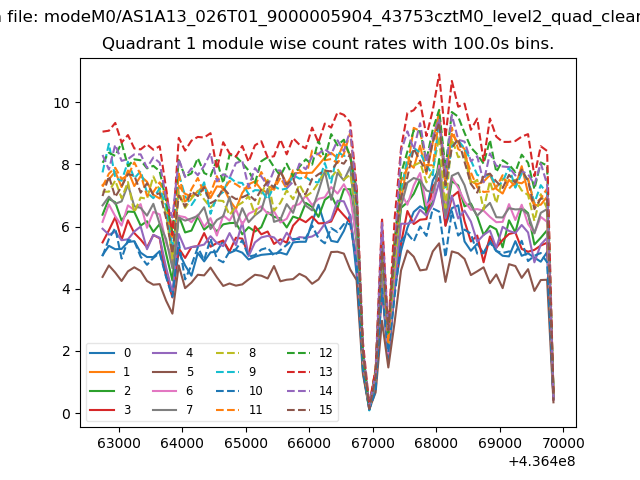
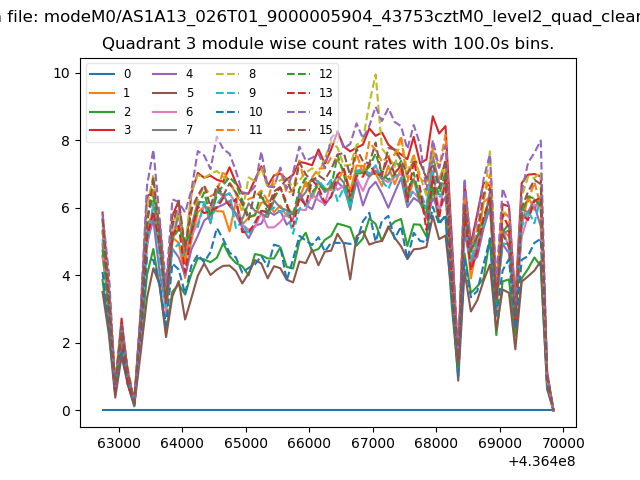
| Module-wise count rates for Quadrant A Data is divided into 100 sec bins |
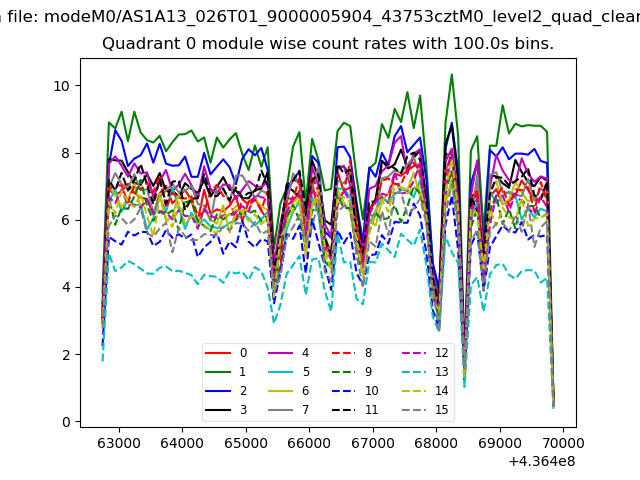 |
 |
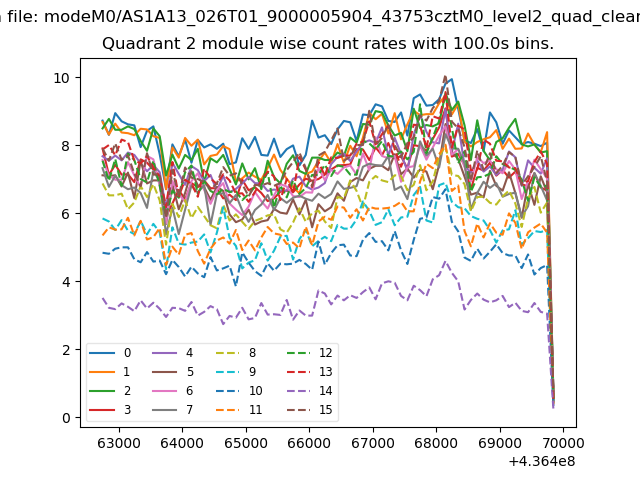
| Module-wise count rates for Quadrant B Data is divided into 100 sec bins |
 |
 |
| Module-wise count rates for Quadrant C Data is divided into 100 sec bins |
 |
 |
| Module-wise count rates for Quadrant D Data is divided into 100 sec bins |
 |
 |
| Parameter | Plot |
|---|---|
| CZT HV Monitor | 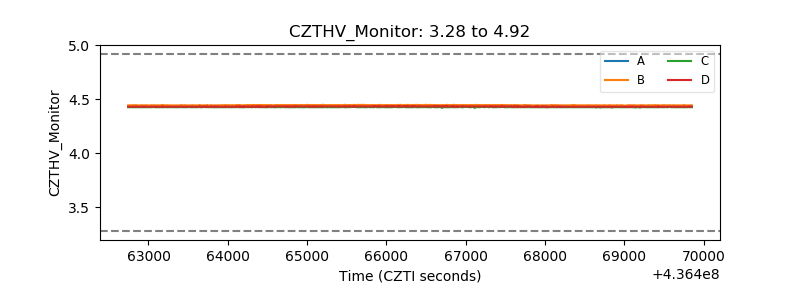 |
| D_VDD | 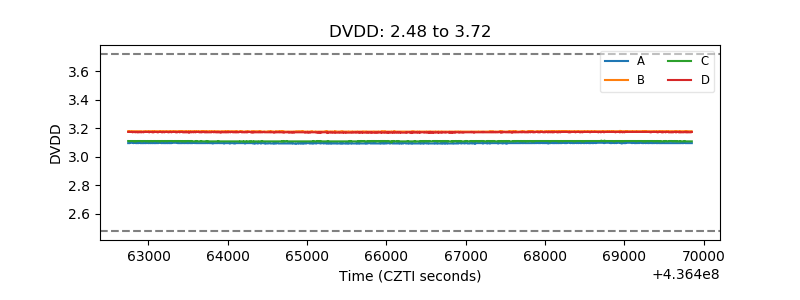 |
| Temperature 1 | 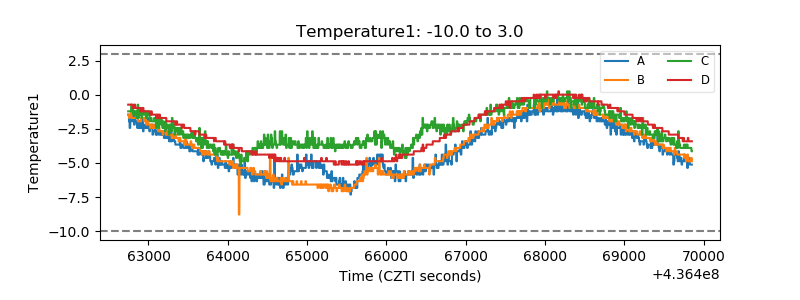 |
| Veto HV Monitor | 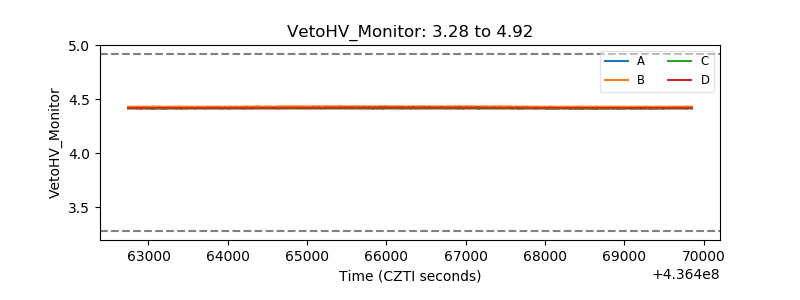 |
| Veto LLD | 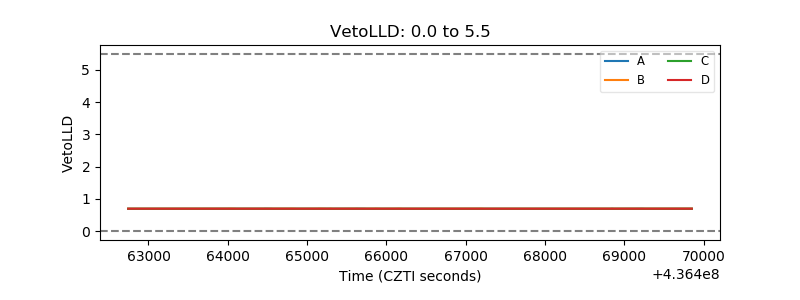 |
| Alpha Counter | 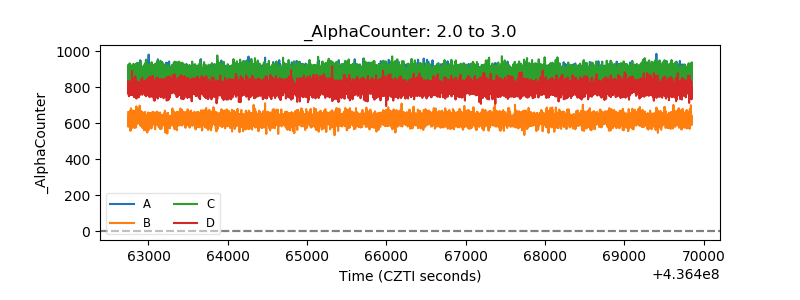 |
| _CPM_Rate | 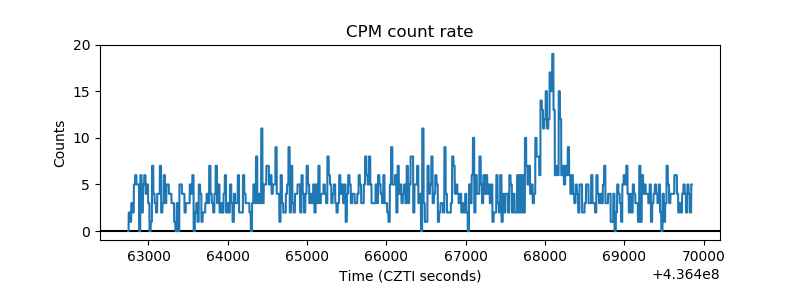 |
| CZT Counter | 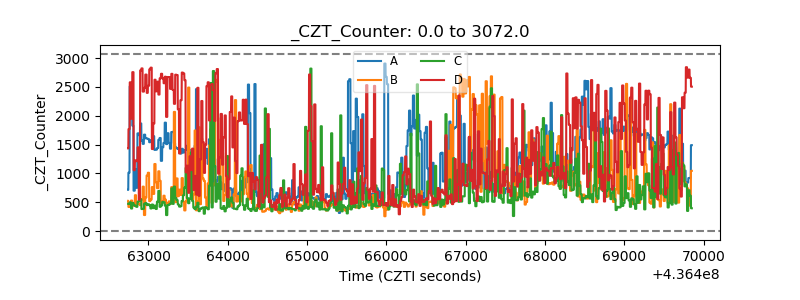 |
| +2.5 Volts monitor | 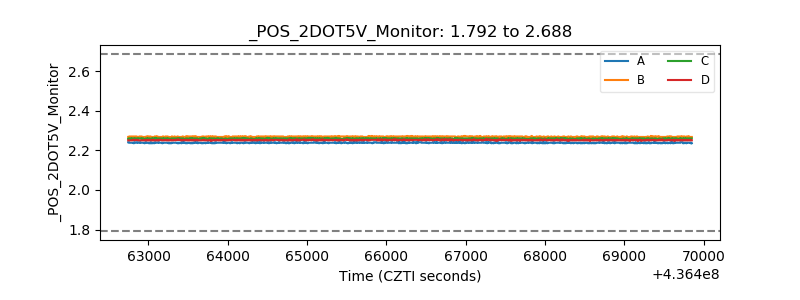 |
| +5 Volts monitor | 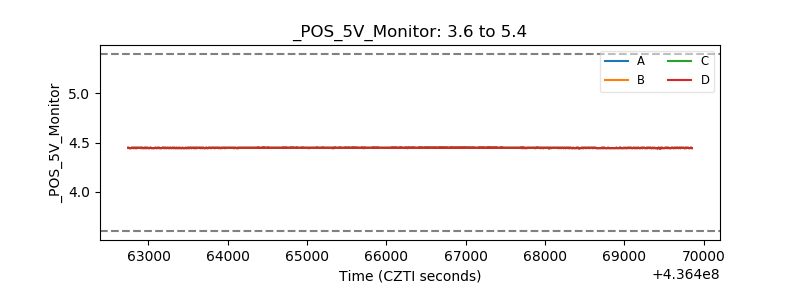 |
| _ROLL_ROT | 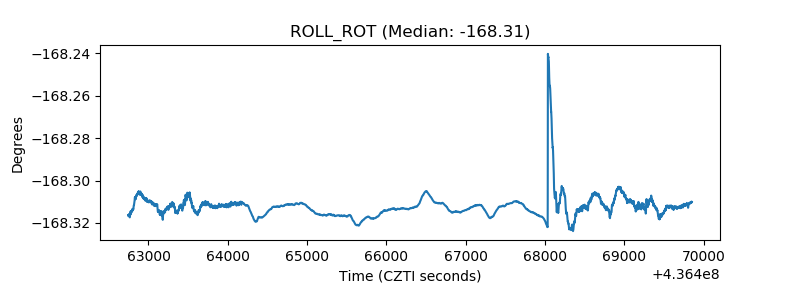 |
| _Roll_DEC | 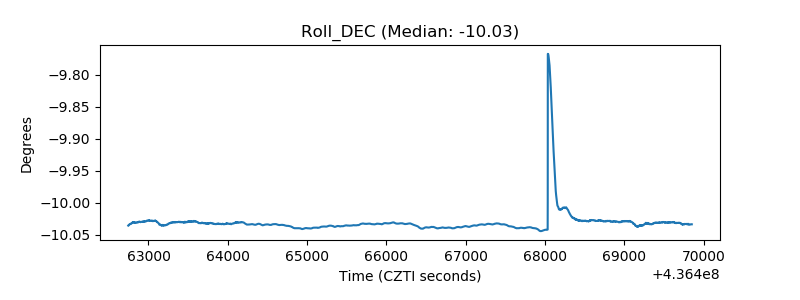 |
| _Roll_RA | 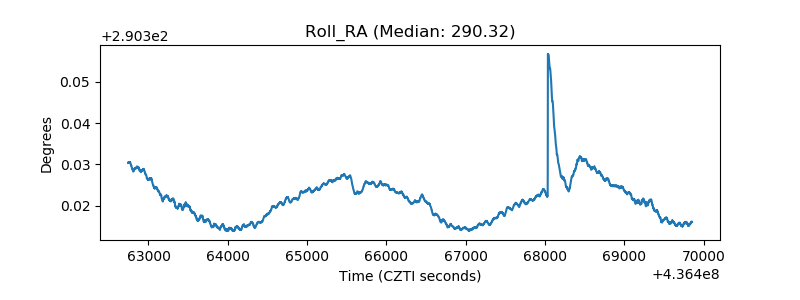 |
| Veto Counter | 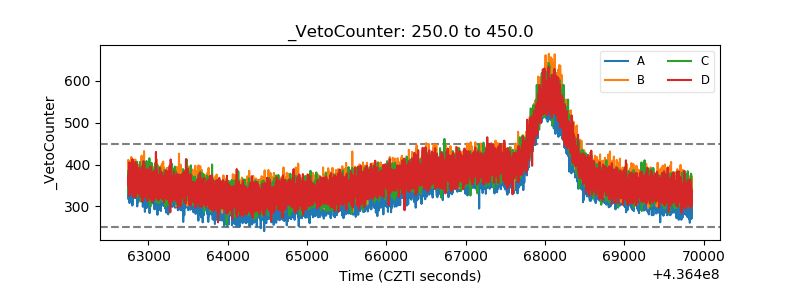 |