| Param | Original file | Final file |
|---|---|---|
| Filename | modeM0/AS1A13_026T01_9000005904_43754cztM0_level2.fits | modeM0/AS1A13_026T01_9000005904_43754cztM0_level2_quad_clean.evt |
| Size (bytes) | 811,414,080 | 109,880,640 |
| Size | 773.8 MB | 104.8 MB |
| Events in quadrant A | 9,252,321 | 707,083 |
| Events in quadrant B | 4,885,946 | 799,281 |
| Events in quadrant C | 5,769,542 | 764,170 |
| Events in quadrant D | 9,567,509 | 549,856 |
| Mode M0 | |||
|---|---|---|---|
| Quadrant | BADHDUFLAG | Total packets | Discarded packets |
| A | 0 | 32783 | 3 |
| B | 0 | 19339 | 0 |
| C | 0 | 22124 | 0 |
| D | 0 | 33511 | 0 |
| Mode SS | |||
|---|---|---|---|
| Quadrant | BADHDUFLAG | Total packets | Discarded packets |
| A | 0 | 146 | 0 |
| B | 0 | 146 | 0 |
| C | 0 | 146 | 0 |
| D | 0 | 146 | 0 |
| Quadrant | Total seconds | Saturated seconds | Saturation percentage |
|---|---|---|---|
| A | 7263 | 1011 | 13.919868% |
| B | 7264 | 216 | 2.973568% |
| C | 7264 | 368 | 5.066079% |
| D | 7264 | 2064 | 28.414097% |
Noise dominated data is calculated using 1-second bins in cleaned event files. If a bin has >2000 counts, and if more than 50% of those come from <1% of pixels, then it is considered to be noise-dominated and hence unusable.
| Quadrant | # 1 sec bins | Bins with >0 counts | Bins with >2000 counts | High rate bins dominated by noise | Noise dominated (total time) | Noise dominated (detector-on time) | Marked lightcurve |
|---|---|---|---|---|---|---|---|
| A | 7263 | 7263 | 691 | 691 | 9.51% | 9.51% | 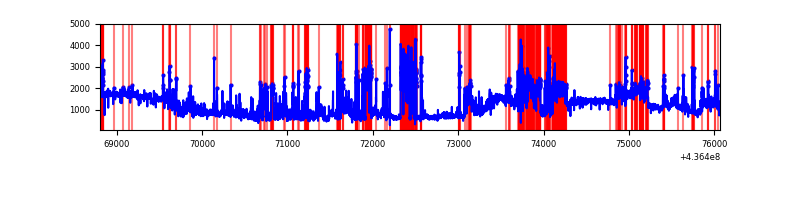 |
| B | 7264 | 7264 | 119 | 119 | 1.64% | 1.64% | 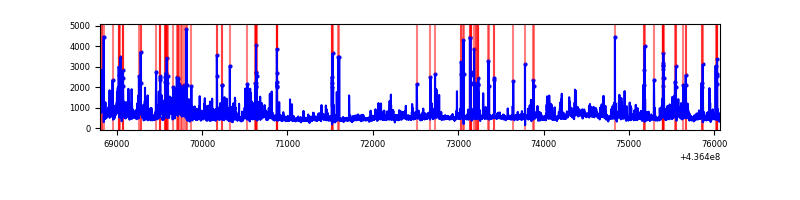 |
| C | 7264 | 7264 | 339 | 339 | 4.67% | 4.67% | 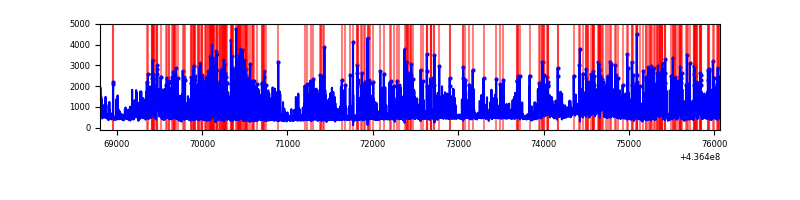 |
| D | 7264 | 7263 | 1227 | 1227 | 16.89% | 16.89% | 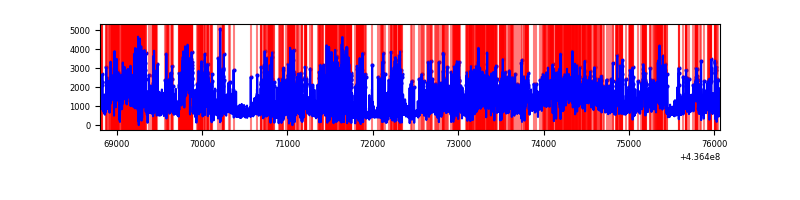 |
Top three noisy pixels from each quadrant. If the there are fewer than three noisy pixels in the level2.evt file, extra rows are filled as -1
| Pixel properties | Quadrant properties | ||||||
|---|---|---|---|---|---|---|---|
| Quadrant | DetID | PixID | Counts | Sigma | Mean | Median | Sigma |
| A | 14 | 63 | 4301874 | 26290.45 | 781 | 767 | 163.6 |
| A | 10 | 83 | 955493 | 5835.75 | 781 | 767 | 163.6 |
| A | 15 | 223 | 430720 | 2628.08 | 781 | 767 | 163.6 |
| B | 0 | 200 | 884343 | 5561.29 | 811 | 789 | 158.9 |
| B | 5 | 235 | 143741 | 899.77 | 811 | 789 | 158.9 |
| B | 0 | 219 | 123238 | 770.72 | 811 | 789 | 158.9 |
| C | 15 | 158 | 2182736 | 11801.16 | 786 | 793 | 184.9 |
| C | 15 | 157 | 229132 | 1234.98 | 786 | 793 | 184.9 |
| C | 3 | 233 | 111837 | 600.59 | 786 | 793 | 184.9 |
| D | 1 | 52 | 1791354 | 9687.79 | 706 | 684 | 184.8 |
| D | 4 | 212 | 1240888 | 6709.69 | 706 | 684 | 184.8 |
| D | 5 | 235 | 763751 | 4128.31 | 706 | 684 | 184.8 |
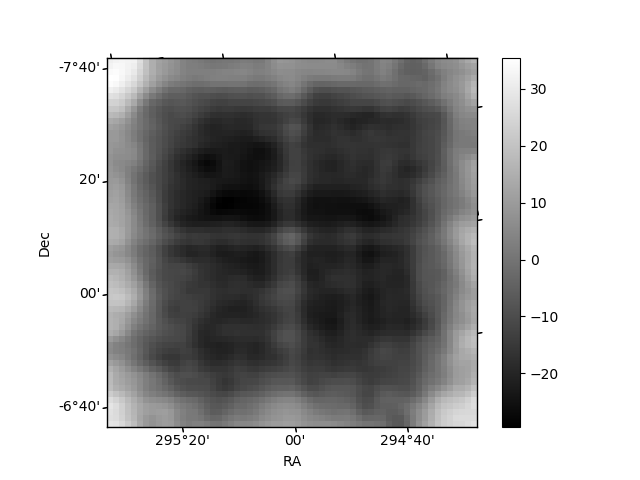
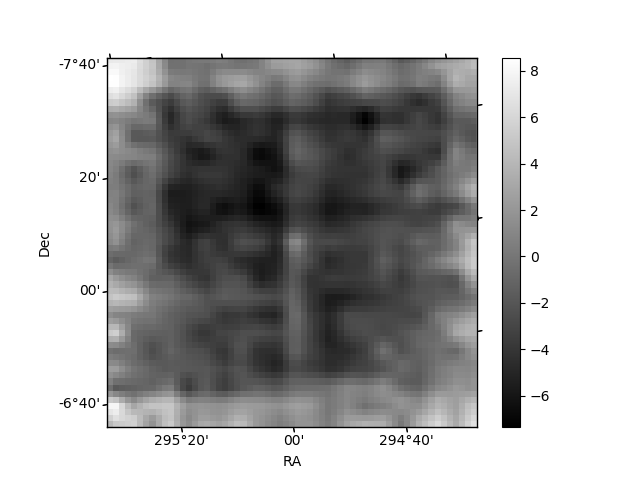
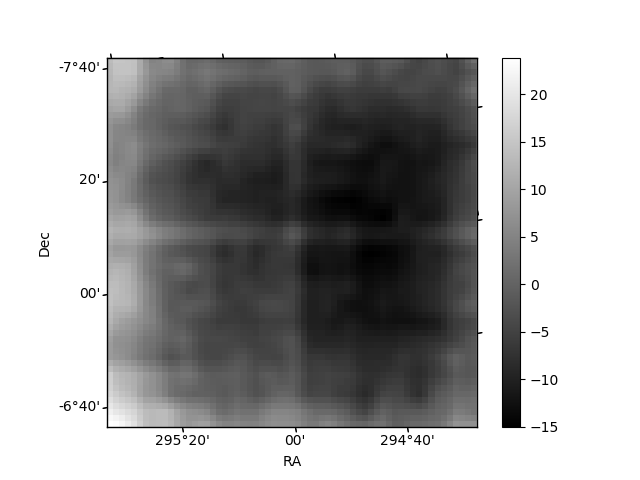
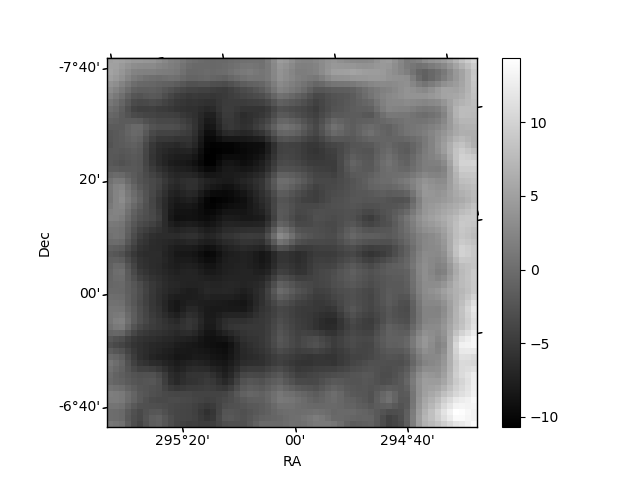
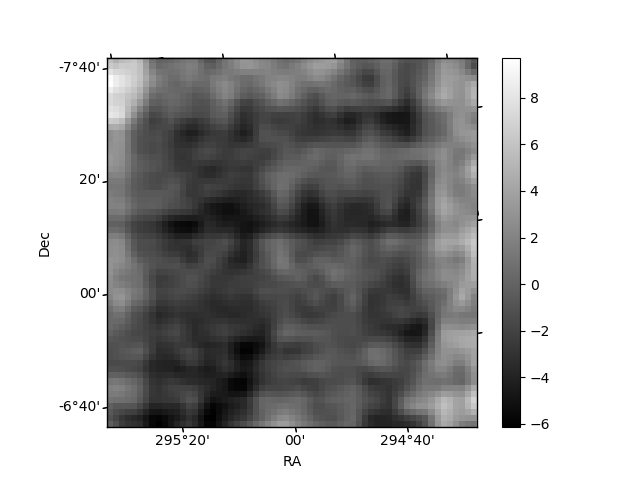
Histogram calculated using DETX and DETY for each event in the final _common_clean file
| Quadrant A | 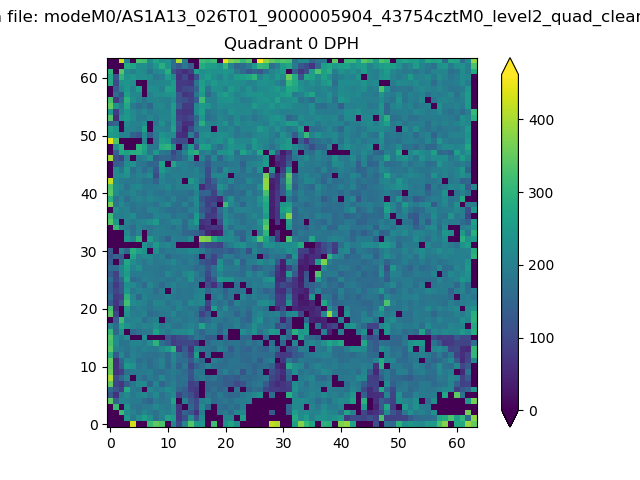 |
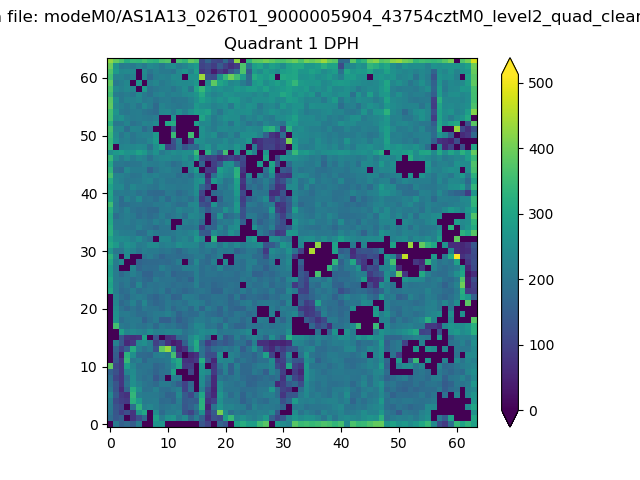 |
Quadrant B |
|---|---|---|---|
| Quadrant D | 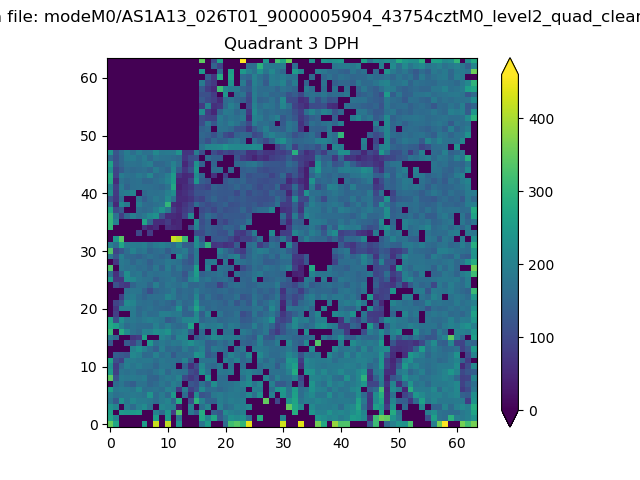 |
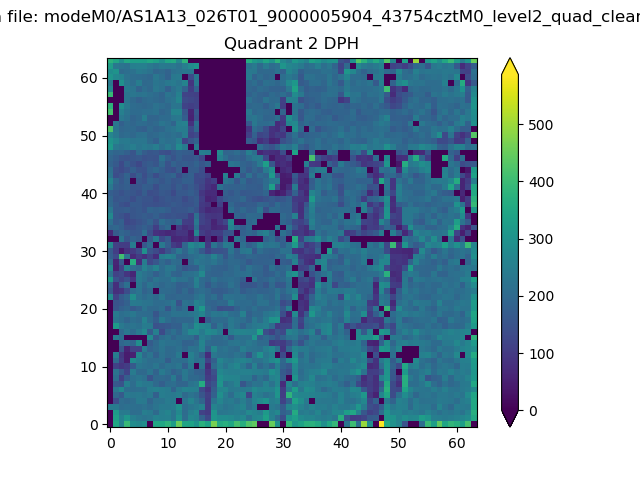 |
Quadrant C |
| Plot type | Count rate plots | Images |
|---|---|---|
| Comparison with Poisson distribution Blue bars denote a histogram of data divided into 1 sec bins. Red curve is a Poisson curve with rate = median count rate of data. |
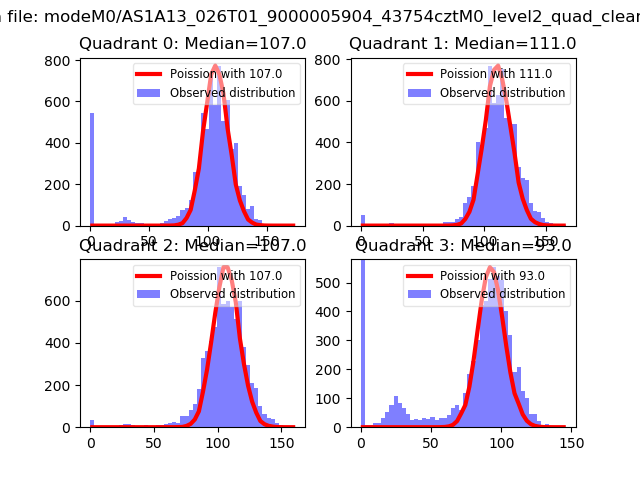 |
 |
| Quadrant-wise count rates Data is divided into 100 sec bins |
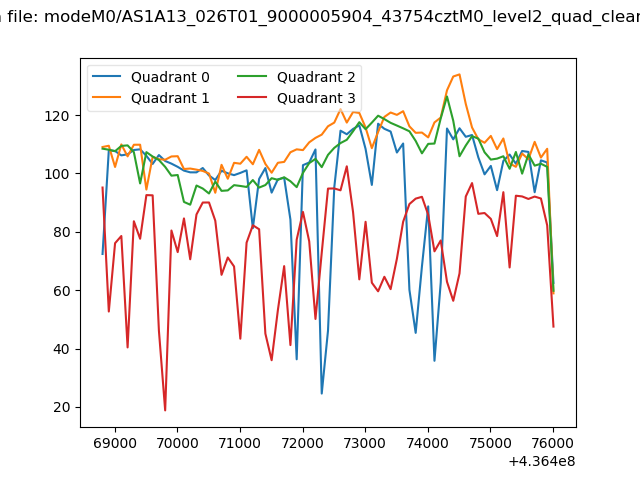 |
|
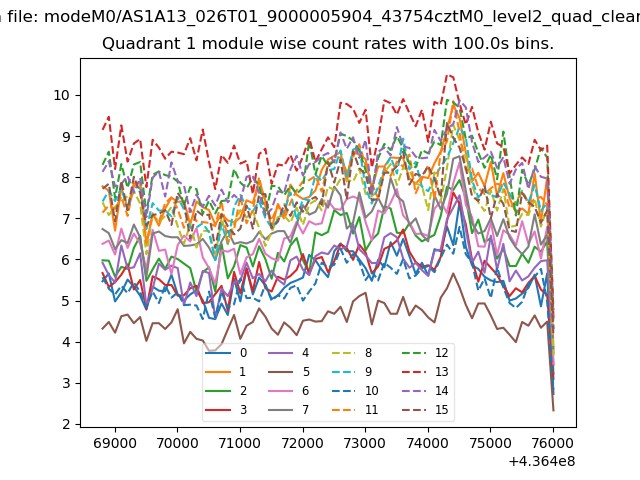
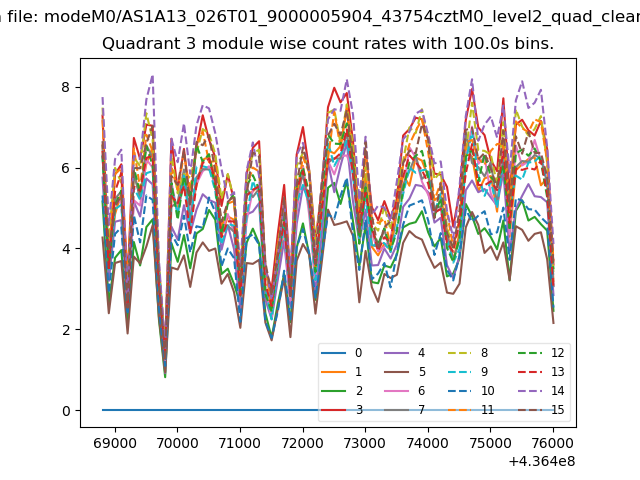
| Module-wise count rates for Quadrant A Data is divided into 100 sec bins |
 |
 |
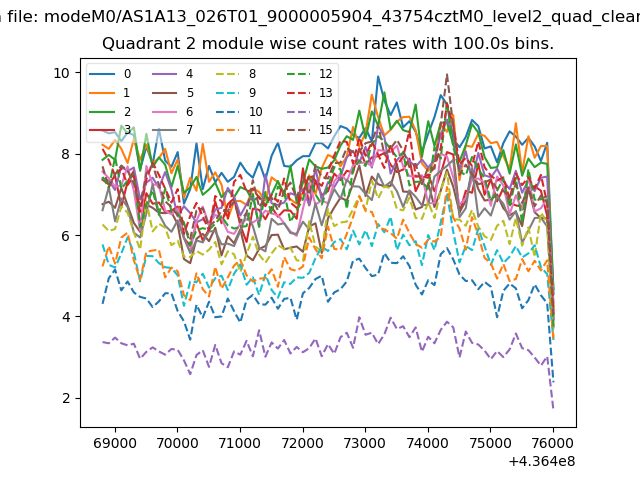
| Module-wise count rates for Quadrant B Data is divided into 100 sec bins |
 |
 |
| Module-wise count rates for Quadrant C Data is divided into 100 sec bins |
 |
 |
| Module-wise count rates for Quadrant D Data is divided into 100 sec bins |
 |
 |
| Parameter | Plot |
|---|---|
| CZT HV Monitor | 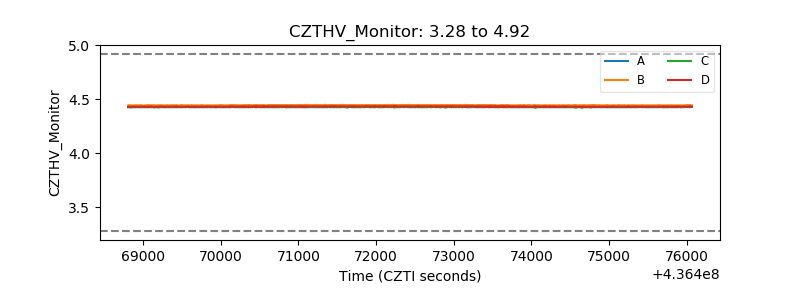 |
| D_VDD | 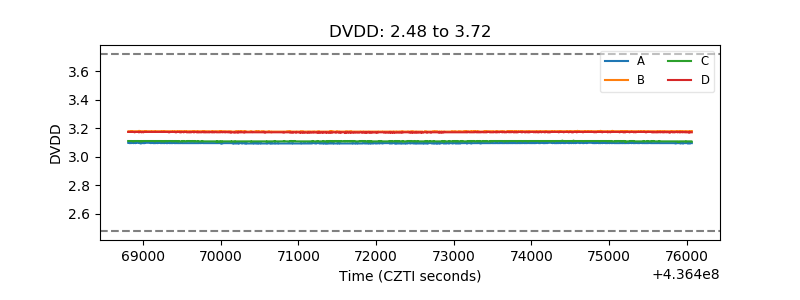 |
| Temperature 1 | 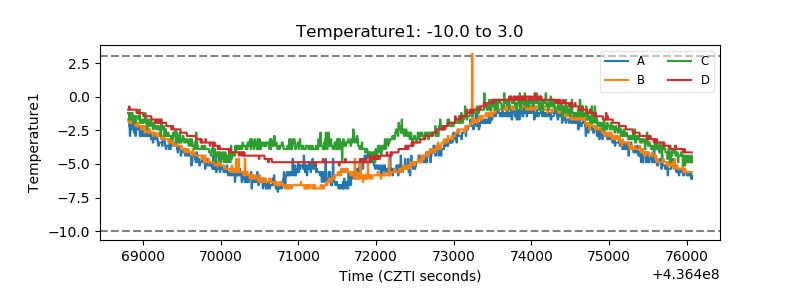 |
| Veto HV Monitor | 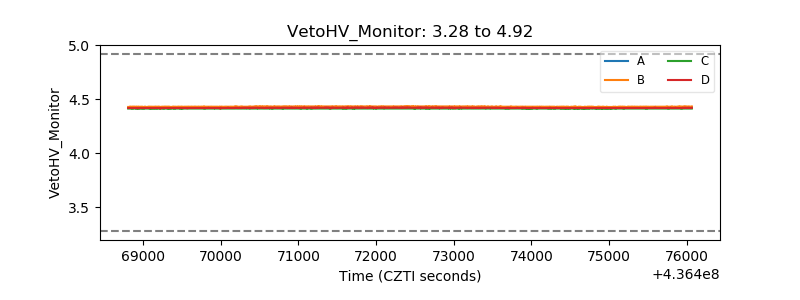 |
| Veto LLD | 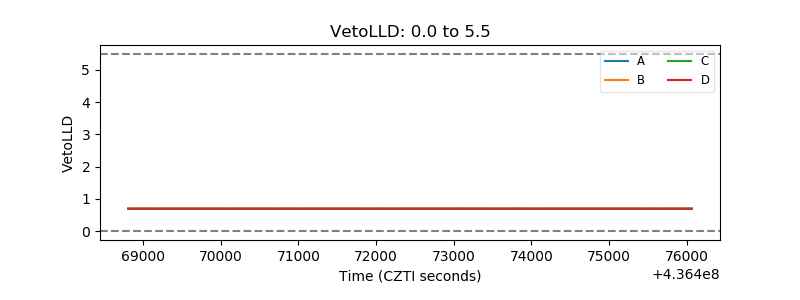 |
| Alpha Counter | 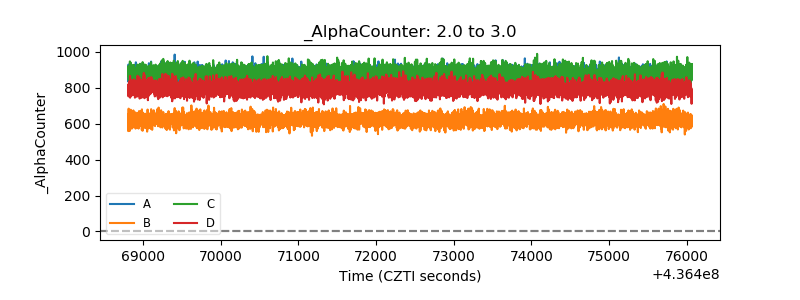 |
| _CPM_Rate | 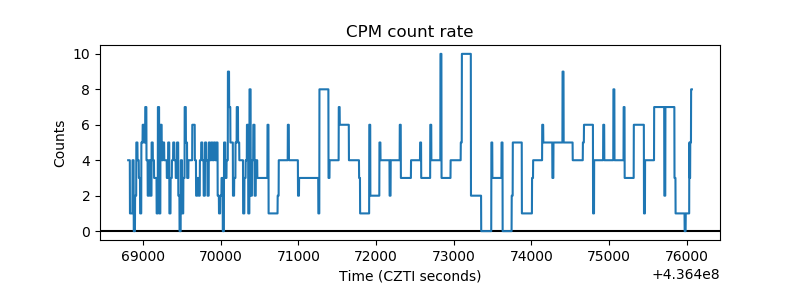 |
| CZT Counter | 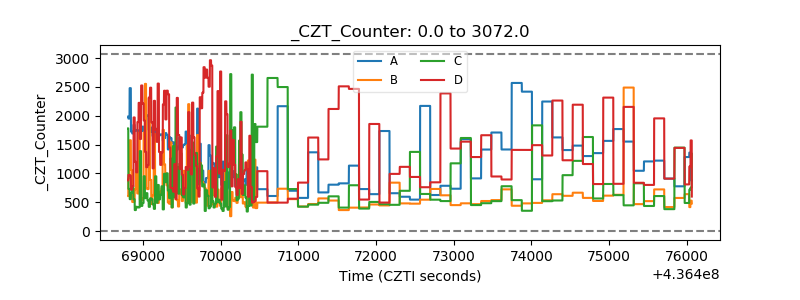 |
| +2.5 Volts monitor | 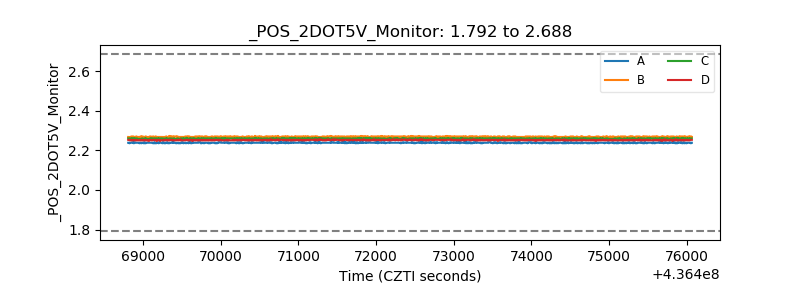 |
| +5 Volts monitor | 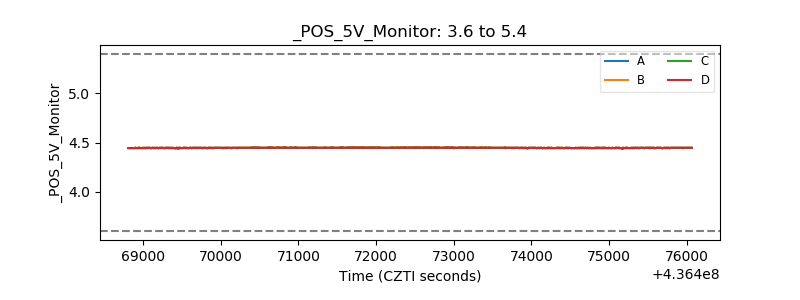 |
| _ROLL_ROT | 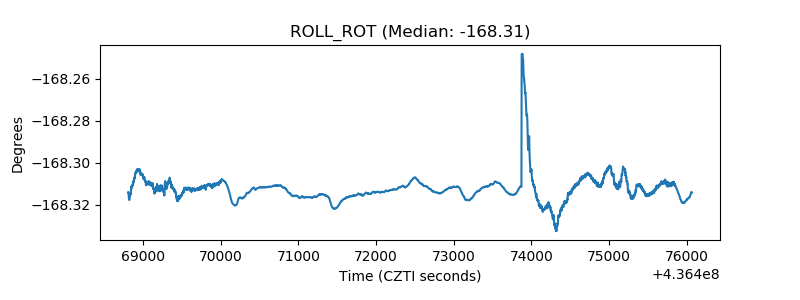 |
| _Roll_DEC | 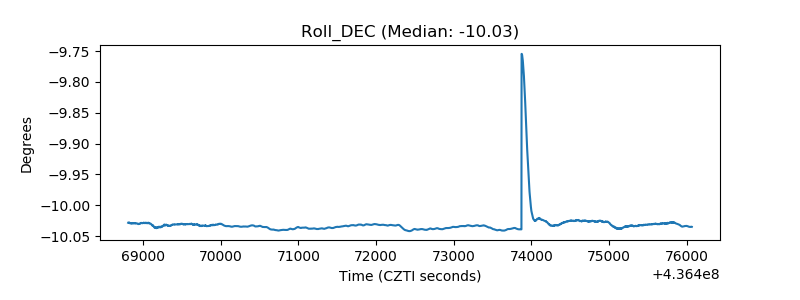 |
| _Roll_RA | 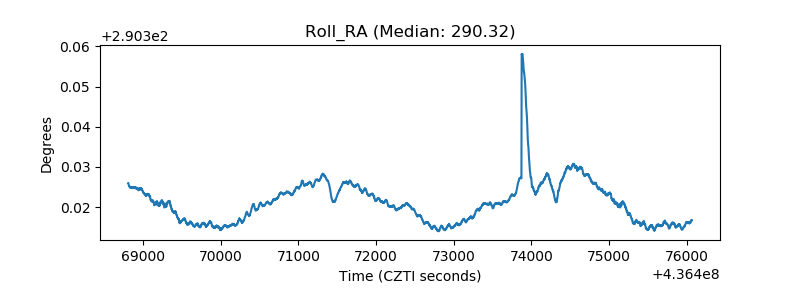 |
| Veto Counter | 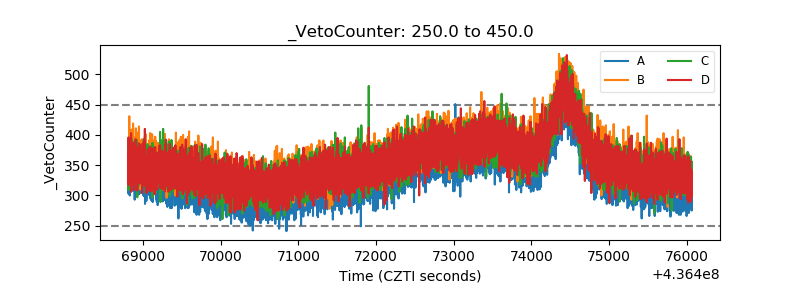 |