| Param | Original file | Final file |
|---|---|---|
| Filename | modeM0/AS1A13_026T01_9000005904_43755cztM0_level2.fits | modeM0/AS1A13_026T01_9000005904_43755cztM0_level2_quad_clean.evt |
| Size (bytes) | 732,856,320 | 120,237,120 |
| Size | 698.9 MB | 114.7 MB |
| Events in quadrant A | 7,807,562 | 796,668 |
| Events in quadrant B | 4,792,136 | 834,867 |
| Events in quadrant C | 5,917,770 | 808,174 |
| Events in quadrant D | 8,014,003 | 663,840 |
| Mode M0 | |||
|---|---|---|---|
| Quadrant | BADHDUFLAG | Total packets | Discarded packets |
| A | 0 | 28558 | 0 |
| B | 0 | 19311 | 0 |
| C | 0 | 22880 | 0 |
| D | 0 | 29181 | 0 |
| Mode SS | |||
|---|---|---|---|
| Quadrant | BADHDUFLAG | Total packets | Discarded packets |
| A | 0 | 154 | 0 |
| B | 0 | 154 | 0 |
| C | 0 | 154 | 0 |
| D | 0 | 154 | 0 |
| Quadrant | Total seconds | Saturated seconds | Saturation percentage |
|---|---|---|---|
| A | 7714 | 565 | 7.324345% |
| B | 7715 | 298 | 3.862605% |
| C | 7715 | 375 | 4.860661% |
| D | 7715 | 1161 | 15.048607% |
Noise dominated data is calculated using 1-second bins in cleaned event files. If a bin has >2000 counts, and if more than 50% of those come from <1% of pixels, then it is considered to be noise-dominated and hence unusable.
| Quadrant | # 1 sec bins | Bins with >0 counts | Bins with >2000 counts | High rate bins dominated by noise | Noise dominated (total time) | Noise dominated (detector-on time) | Marked lightcurve |
|---|---|---|---|---|---|---|---|
| A | 7714 | 7714 | 486 | 486 | 6.30% | 6.30% | 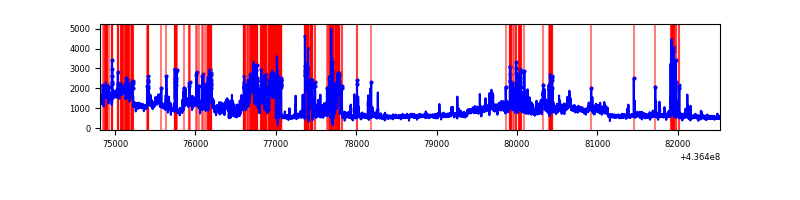 |
| B | 7715 | 7715 | 113 | 113 | 1.46% | 1.46% | 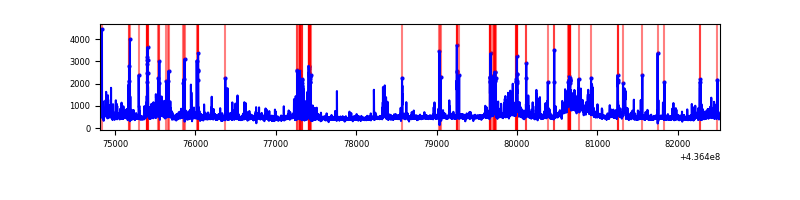 |
| C | 7715 | 7715 | 338 | 338 | 4.38% | 4.38% | 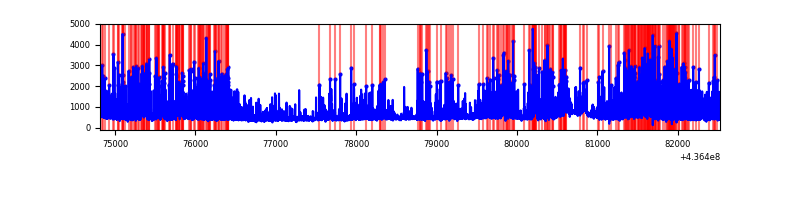 |
| D | 7715 | 7715 | 698 | 698 | 9.05% | 9.05% | 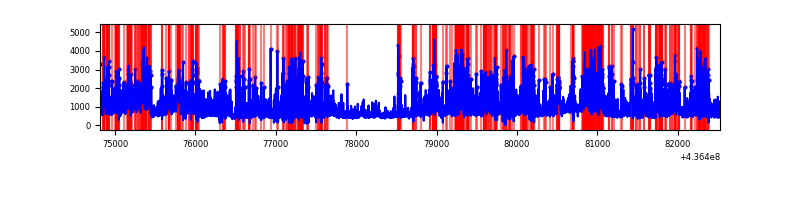 |
Top three noisy pixels from each quadrant. If the there are fewer than three noisy pixels in the level2.evt file, extra rows are filled as -1
| Pixel properties | Quadrant properties | ||||||
|---|---|---|---|---|---|---|---|
| Quadrant | DetID | PixID | Counts | Sigma | Mean | Median | Sigma |
| A | 14 | 63 | 2614802 | 14664.54 | 853 | 834 | 178.3 |
| A | 10 | 83 | 1001212 | 5612.19 | 853 | 834 | 178.3 |
| A | 15 | 223 | 312467 | 1748.28 | 853 | 834 | 178.3 |
| B | 0 | 200 | 705362 | 4075.05 | 865 | 838 | 172.9 |
| B | 5 | 235 | 117570 | 675.19 | 865 | 838 | 172.9 |
| B | 0 | 219 | 103290 | 592.59 | 865 | 838 | 172.9 |
| C | 15 | 158 | 2036449 | 10135.52 | 842 | 846 | 200.8 |
| C | 15 | 174 | 243636 | 1208.88 | 842 | 846 | 200.8 |
| C | 3 | 233 | 138312 | 684.46 | 842 | 846 | 200.8 |
| D | 1 | 52 | 886629 | 4209.02 | 803 | 778 | 210.5 |
| D | 5 | 235 | 868828 | 4124.44 | 803 | 778 | 210.5 |
| D | 4 | 212 | 515985 | 2447.95 | 803 | 778 | 210.5 |
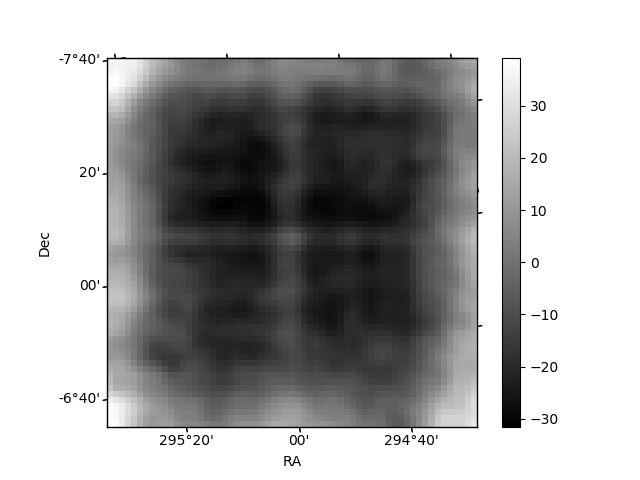
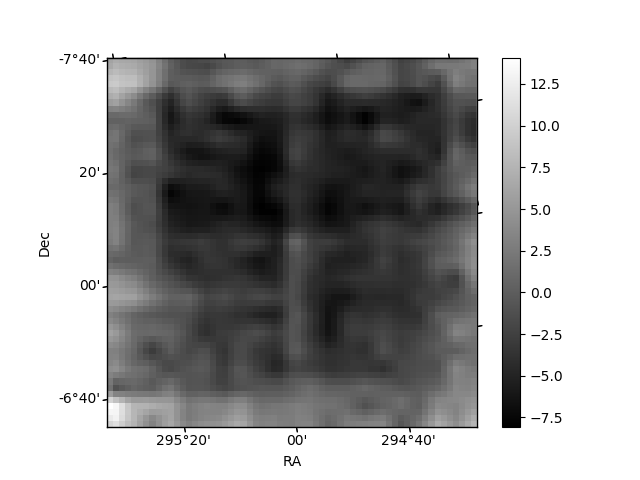
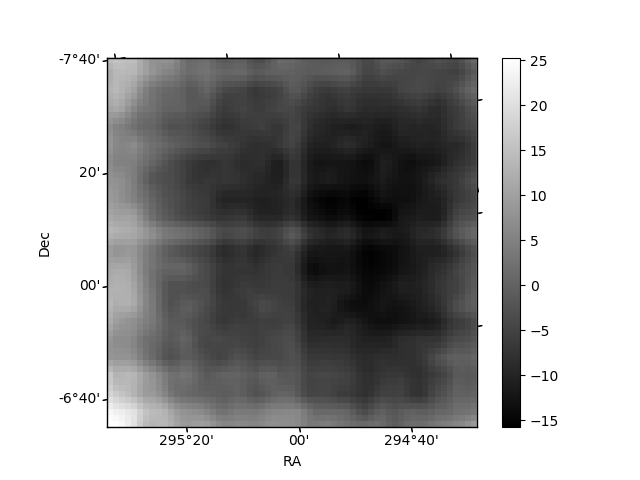
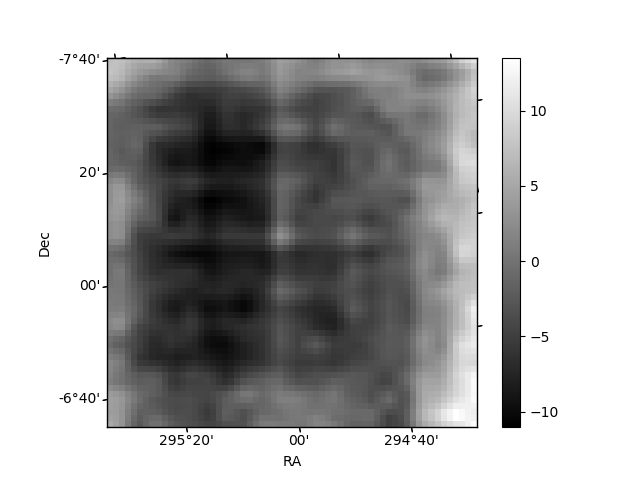
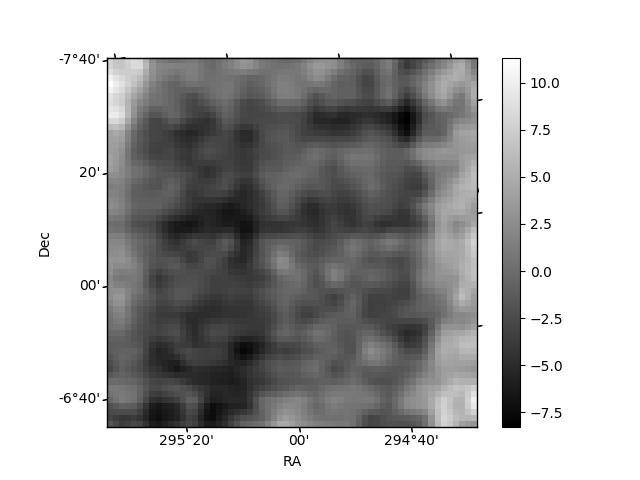
Histogram calculated using DETX and DETY for each event in the final _common_clean file
| Quadrant A | 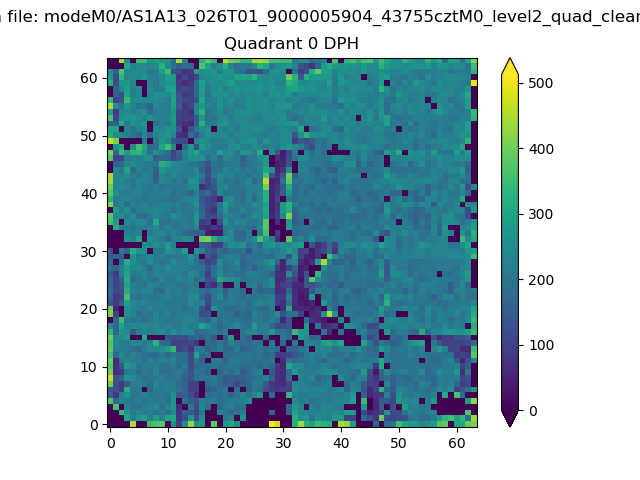 |
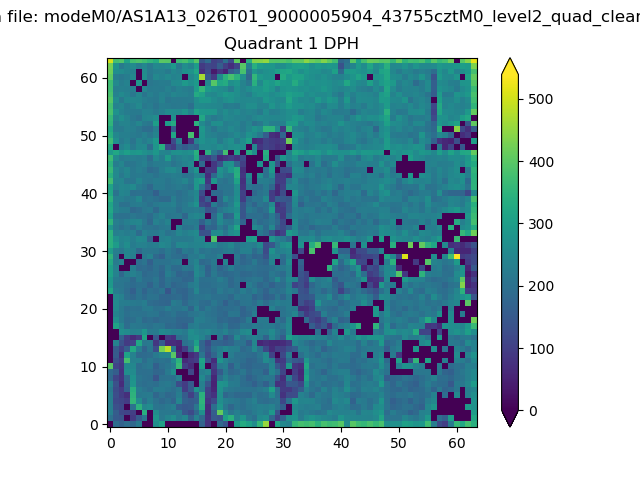 |
Quadrant B |
|---|---|---|---|
| Quadrant D | 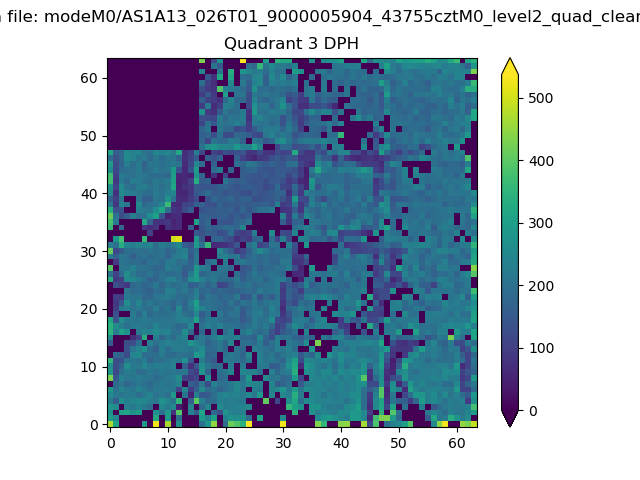 |
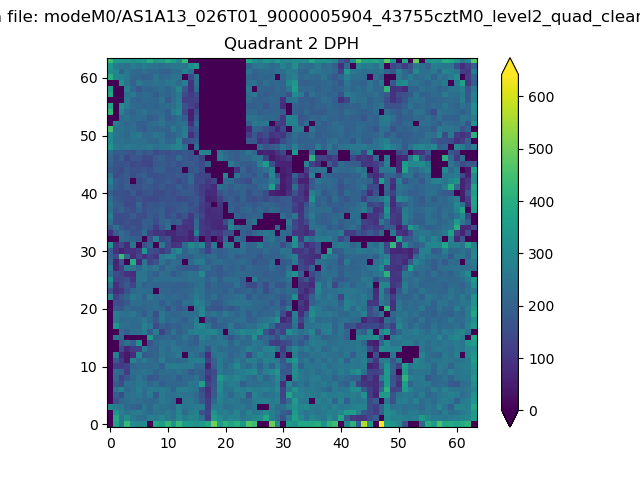 |
Quadrant C |
| Plot type | Count rate plots | Images |
|---|---|---|
| Comparison with Poisson distribution Blue bars denote a histogram of data divided into 1 sec bins. Red curve is a Poisson curve with rate = median count rate of data. |
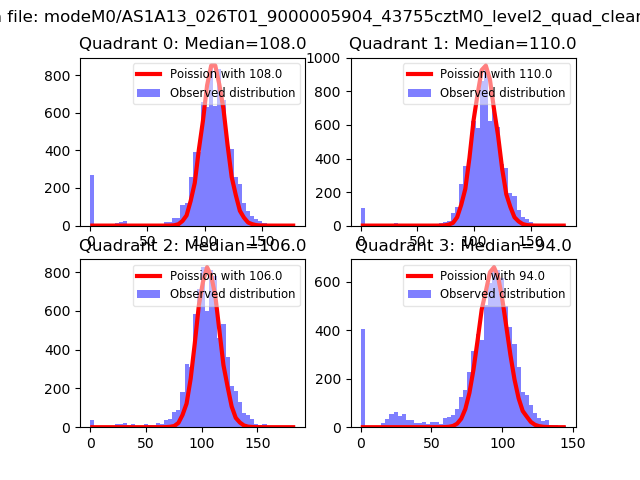 |
 |
| Quadrant-wise count rates Data is divided into 100 sec bins |
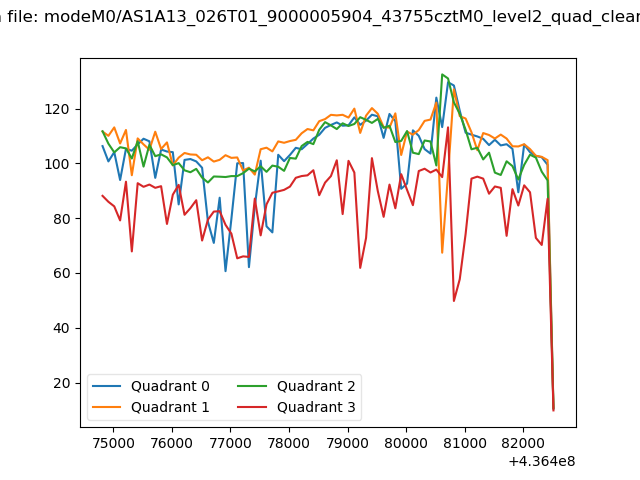 |
|
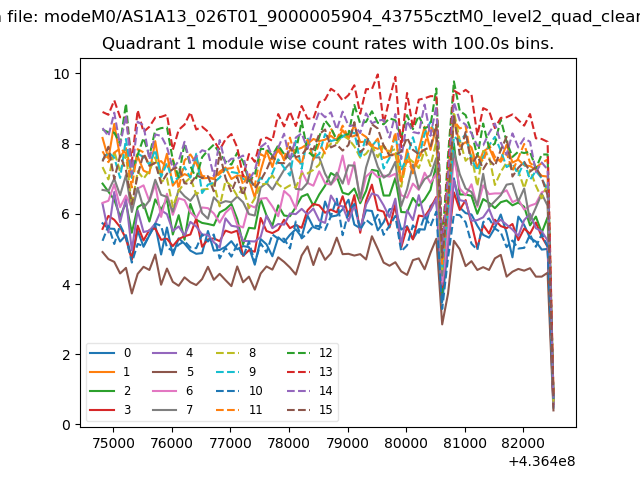
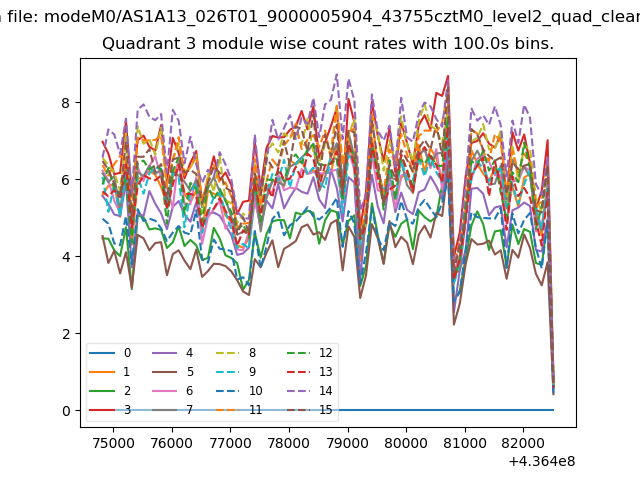
| Module-wise count rates for Quadrant A Data is divided into 100 sec bins |
 |
 |
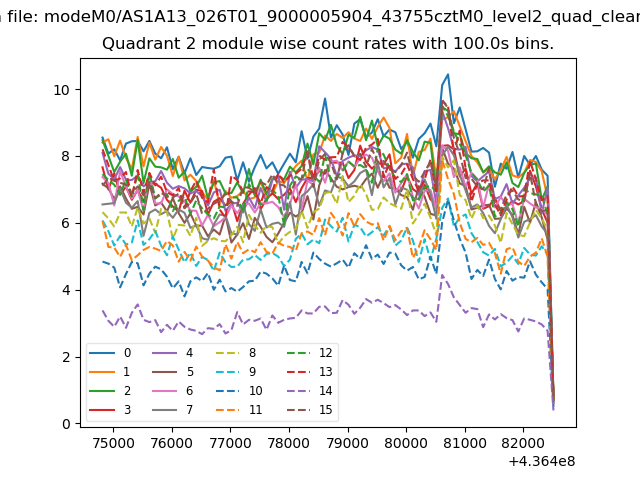
| Module-wise count rates for Quadrant B Data is divided into 100 sec bins |
 |
 |
| Module-wise count rates for Quadrant C Data is divided into 100 sec bins |
 |
 |
| Module-wise count rates for Quadrant D Data is divided into 100 sec bins |
 |
 |
| Parameter | Plot |
|---|---|
| CZT HV Monitor | 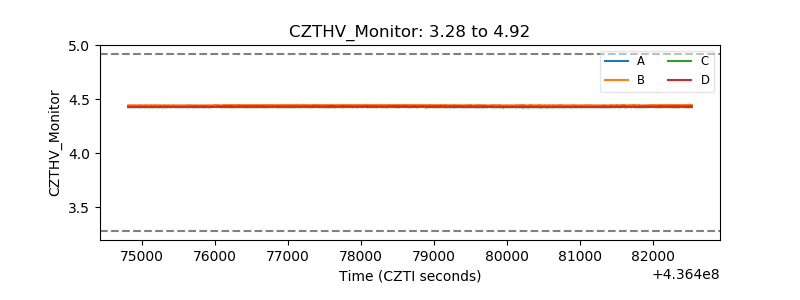 |
| D_VDD | 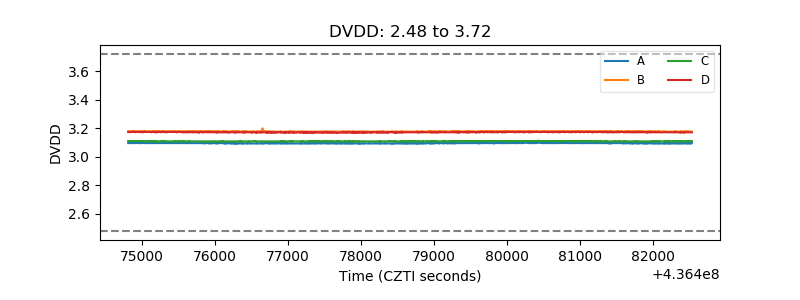 |
| Temperature 1 | 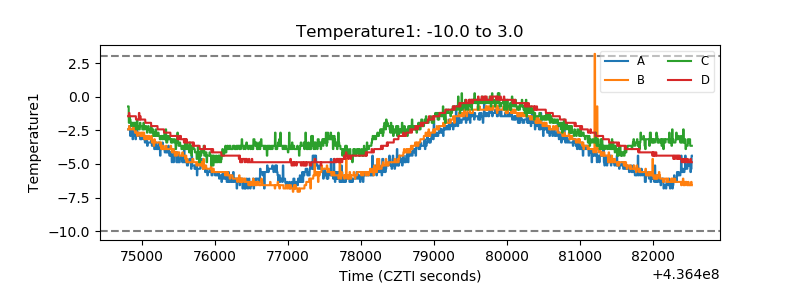 |
| Veto HV Monitor | 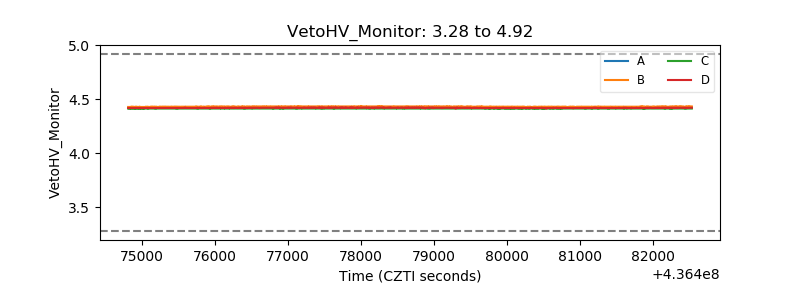 |
| Veto LLD | 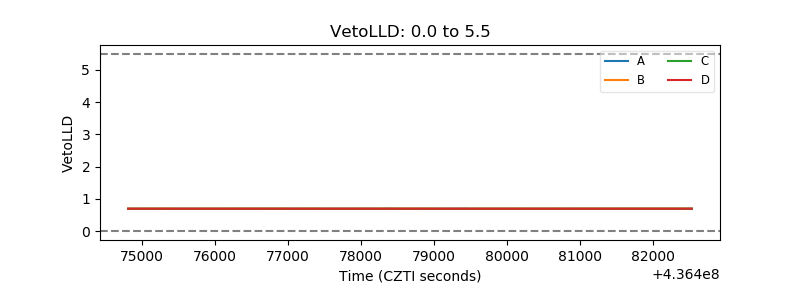 |
| Alpha Counter | 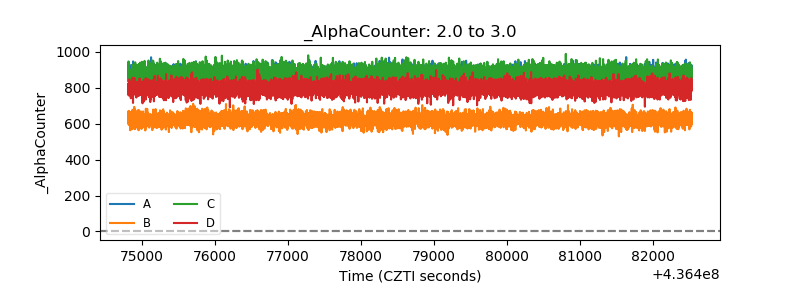 |
| _CPM_Rate | 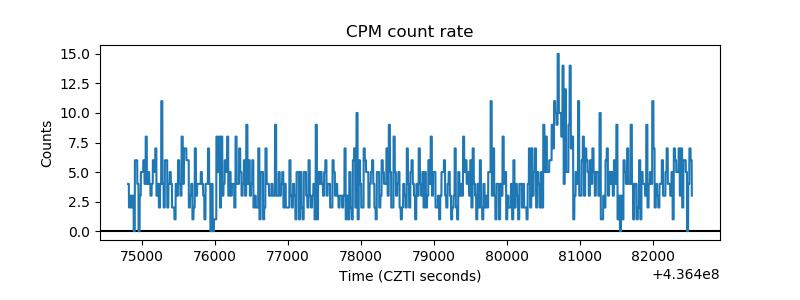 |
| CZT Counter | 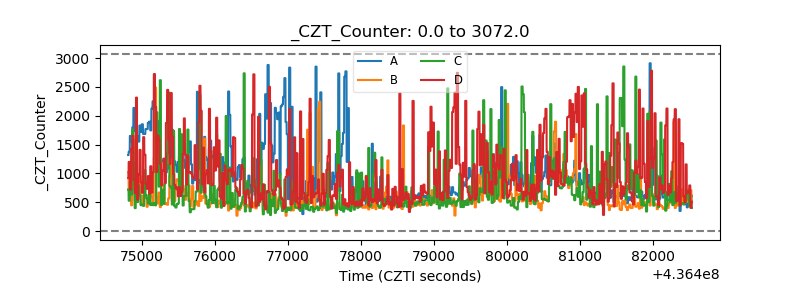 |
| +2.5 Volts monitor | 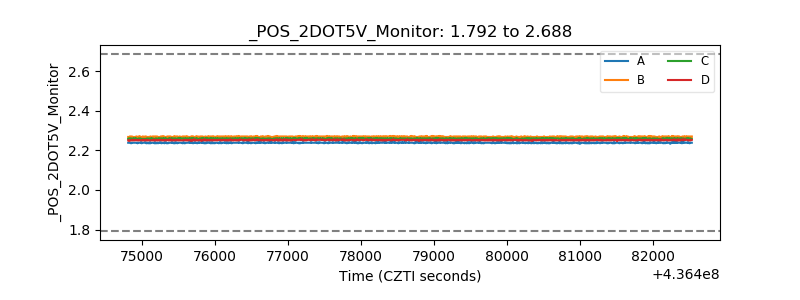 |
| +5 Volts monitor | 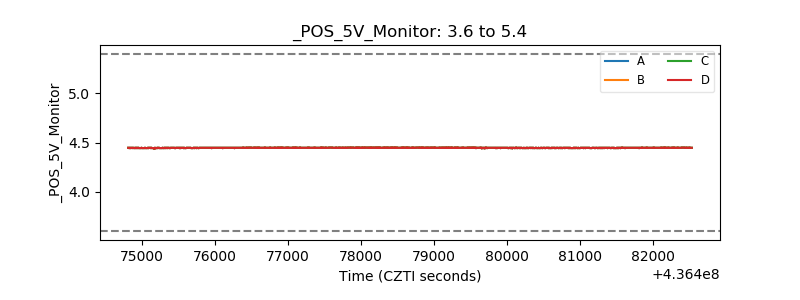 |
| _ROLL_ROT | 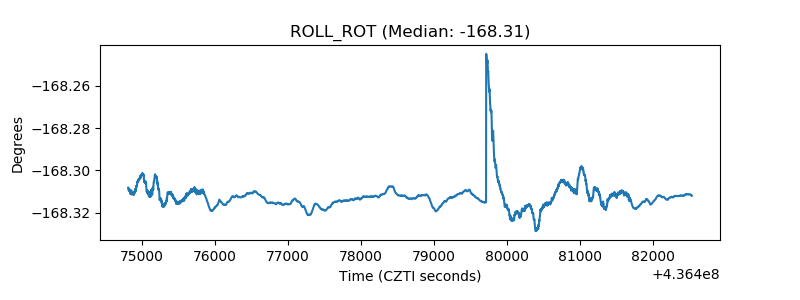 |
| _Roll_DEC | 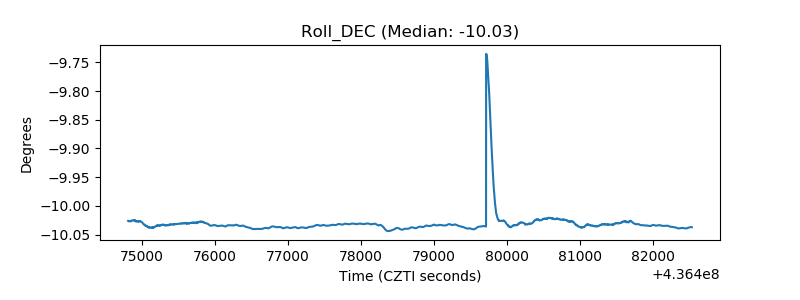 |
| _Roll_RA | 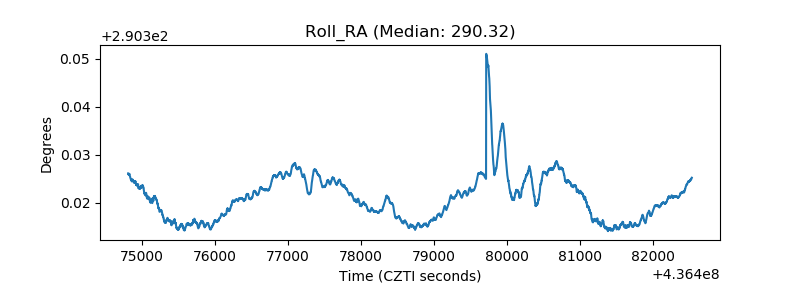 |
| Veto Counter | 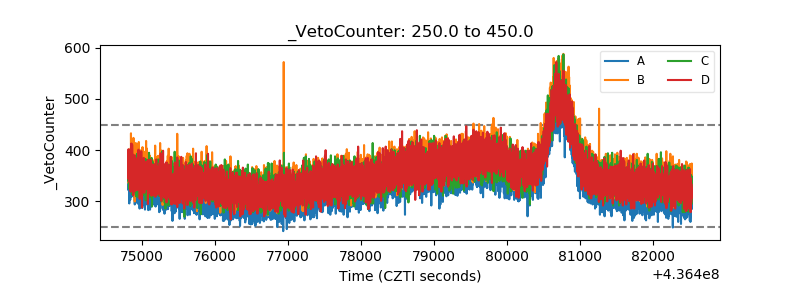 |