| Param | Original file | Final file |
|---|---|---|
| Filename | modeM0/AS1A13_026T01_9000005904_43759cztM0_level2.fits | modeM0/AS1A13_026T01_9000005904_43759cztM0_level2_quad_clean.evt |
| Size (bytes) | 540,780,480 | 105,514,560 |
| Size | 515.7 MB | 100.6 MB |
| Events in quadrant A | 5,572,646 | 700,176 |
| Events in quadrant B | 3,922,733 | 744,854 |
| Events in quadrant C | 4,195,882 | 707,895 |
| Events in quadrant D | 5,807,487 | 575,765 |
| Mode M0 | |||
|---|---|---|---|
| Quadrant | BADHDUFLAG | Total packets | Discarded packets |
| A | 0 | 21597 | 2 |
| B | 0 | 16007 | 2 |
| C | 0 | 17028 | 2 |
| D | 0 | 21791 | 3 |
| Mode SS | |||
|---|---|---|---|
| Quadrant | BADHDUFLAG | Total packets | Discarded packets |
| A | 0 | 134 | 0 |
| B | 0 | 134 | 0 |
| C | 0 | 134 | 0 |
| D | 0 | 134 | 0 |
| Mode M9 | |||
|---|---|---|---|
| Quadrant | BADHDUFLAG | Total packets | Discarded packets |
| A | 0 | 13 | 0 |
| B | 0 | 14 | 0 |
| C | 0 | 14 | 0 |
| D | 0 | 14 | 0 |
| Quadrant | Total seconds | Saturated seconds | Saturation percentage |
|---|---|---|---|
| A | 6690 | 432 | 6.457399% |
| B | 6690 | 206 | 3.079223% |
| C | 6690 | 277 | 4.140508% |
| D | 6689 | 982 | 14.680819% |
Noise dominated data is calculated using 1-second bins in cleaned event files. If a bin has >2000 counts, and if more than 50% of those come from <1% of pixels, then it is considered to be noise-dominated and hence unusable.
| Quadrant | # 1 sec bins | Bins with >0 counts | Bins with >2000 counts | High rate bins dominated by noise | Noise dominated (total time) | Noise dominated (detector-on time) | Marked lightcurve |
|---|---|---|---|---|---|---|---|
| A | 7615 | 6691 | 240 | 240 | 3.15% | 3.59% | 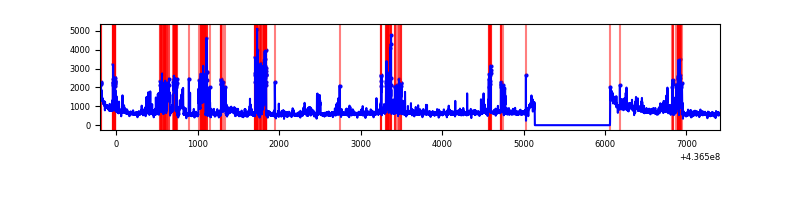 |
| B | 7615 | 6691 | 82 | 82 | 1.08% | 1.23% | 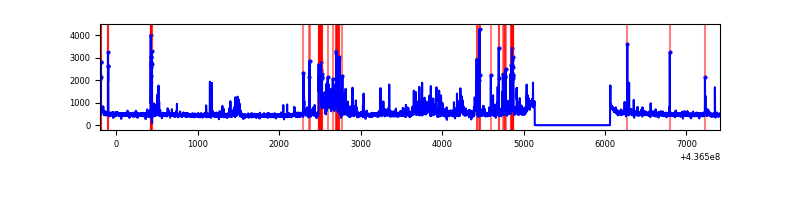 |
| C | 7615 | 6691 | 201 | 201 | 2.64% | 3.00% | 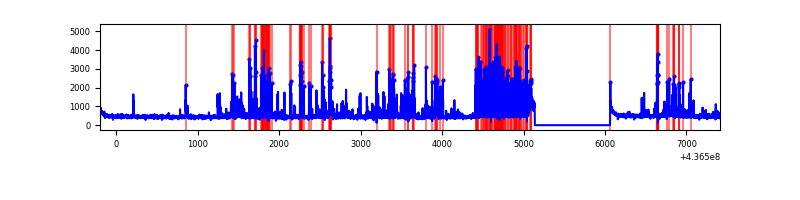 |
| D | 7613 | 6688 | 443 | 443 | 5.82% | 6.62% | 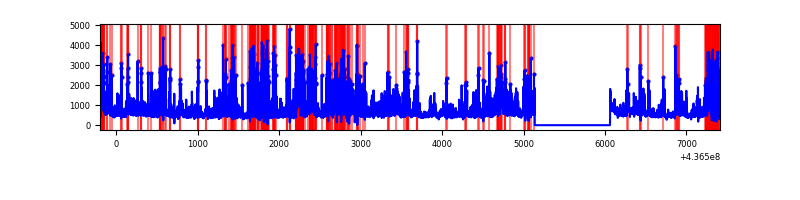 |
Top three noisy pixels from each quadrant. If the there are fewer than three noisy pixels in the level2.evt file, extra rows are filled as -1
| Pixel properties | Quadrant properties | ||||||
|---|---|---|---|---|---|---|---|
| Quadrant | DetID | PixID | Counts | Sigma | Mean | Median | Sigma |
| A | 10 | 83 | 1007039 | 6372.04 | 758 | 741 | 157.9 |
| A | 14 | 63 | 732425 | 4633.14 | 758 | 741 | 157.9 |
| A | 15 | 174 | 352835 | 2229.51 | 758 | 741 | 157.9 |
| B | 0 | 200 | 548277 | 3610.0 | 771 | 749 | 151.7 |
| B | 5 | 235 | 122537 | 802.98 | 771 | 749 | 151.7 |
| B | 4 | 80 | 83095 | 542.93 | 771 | 749 | 151.7 |
| C | 15 | 158 | 871582 | 4906.11 | 750 | 752 | 177.5 |
| C | 14 | 254 | 212857 | 1194.96 | 750 | 752 | 177.5 |
| C | 15 | 157 | 75600 | 421.68 | 750 | 752 | 177.5 |
| D | 4 | 212 | 1127640 | 6164.31 | 704 | 681 | 182.8 |
| D | 13 | 249 | 506864 | 2768.75 | 704 | 681 | 182.8 |
| D | 5 | 235 | 217357 | 1185.19 | 704 | 681 | 182.8 |
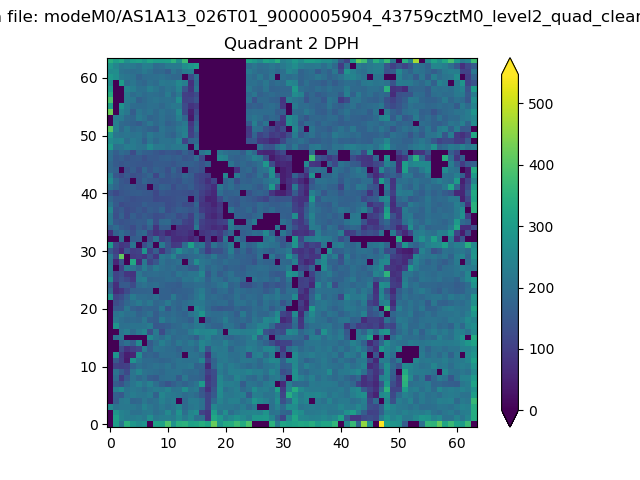
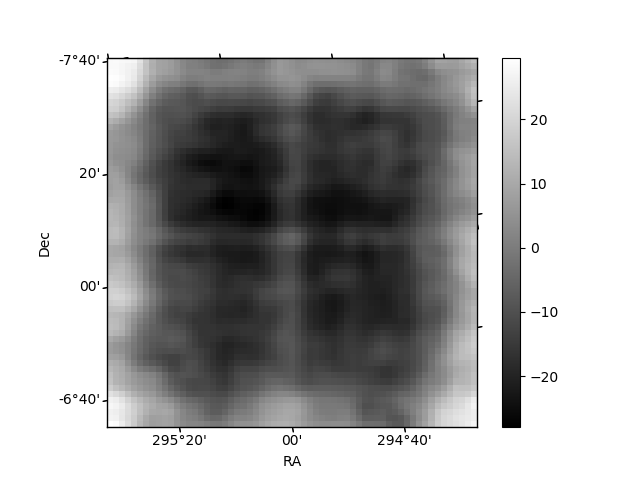
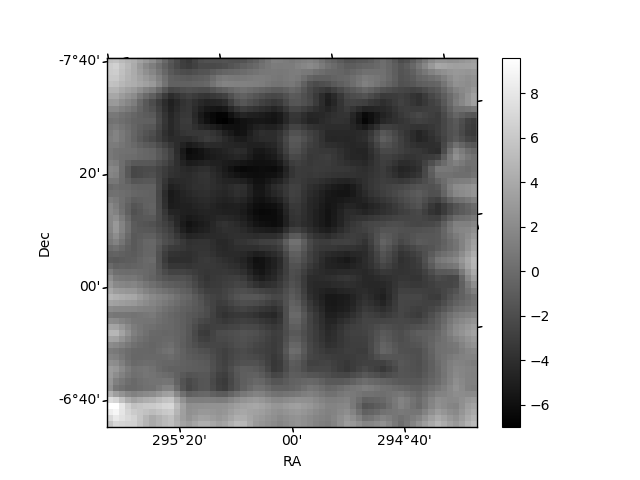
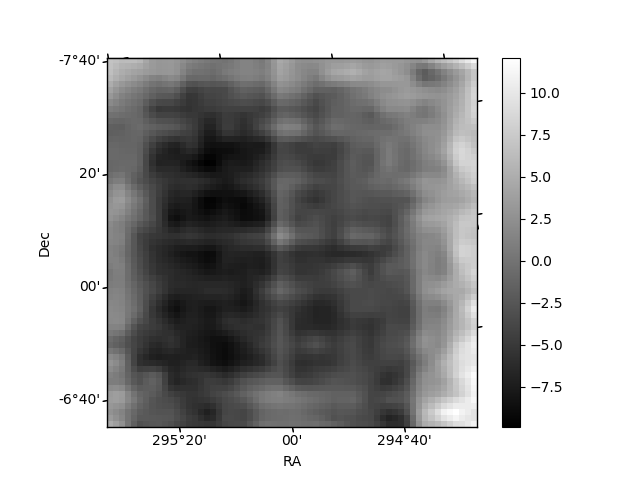
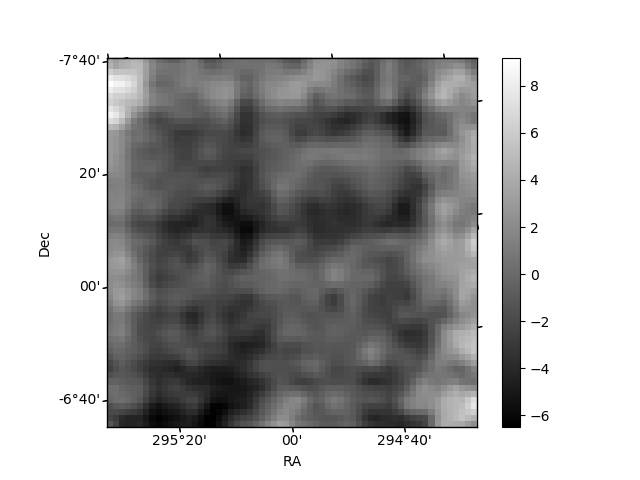
Histogram calculated using DETX and DETY for each event in the final _common_clean file
| Quadrant A | 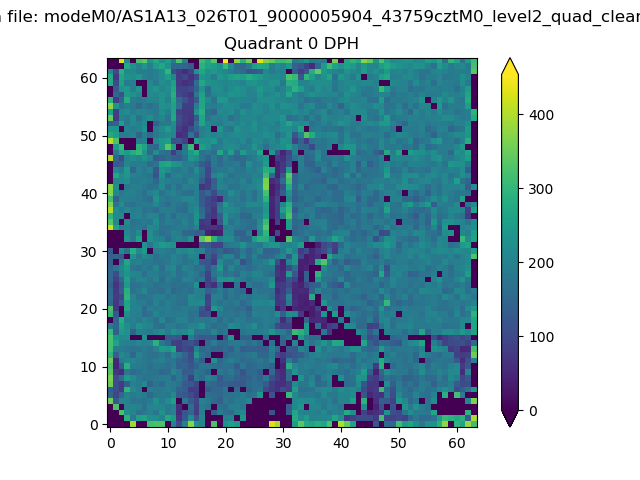 |
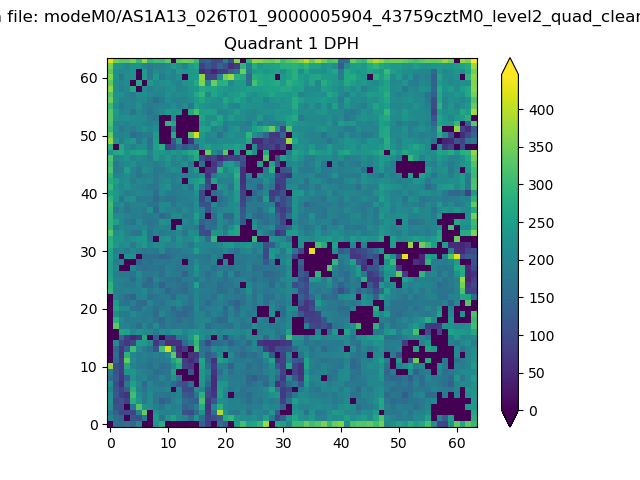 |
Quadrant B |
|---|---|---|---|
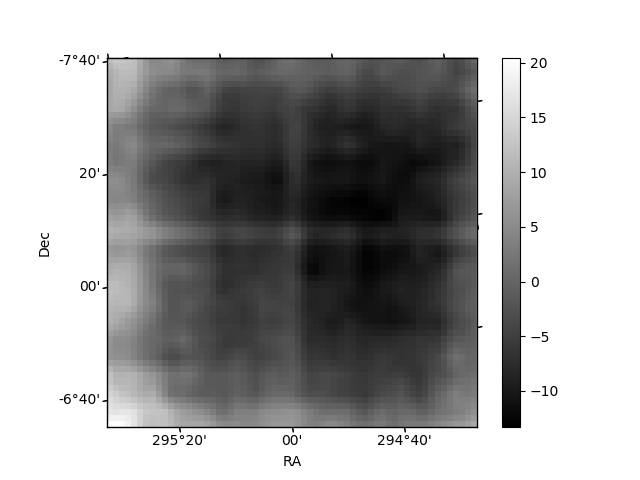
| Quadrant D | 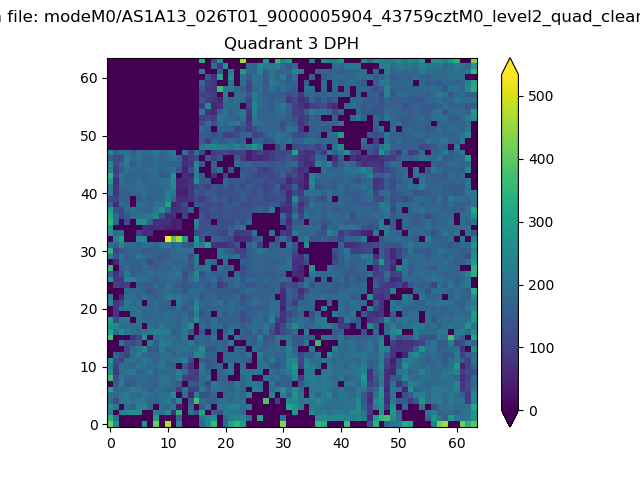 |
 |
Quadrant C |
| Plot type | Count rate plots | Images |
|---|---|---|
| Comparison with Poisson distribution Blue bars denote a histogram of data divided into 1 sec bins. Red curve is a Poisson curve with rate = median count rate of data. |
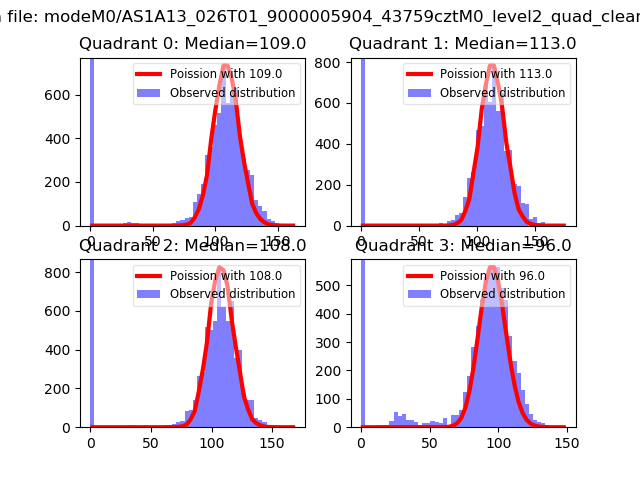 |
 |
| Quadrant-wise count rates Data is divided into 100 sec bins |
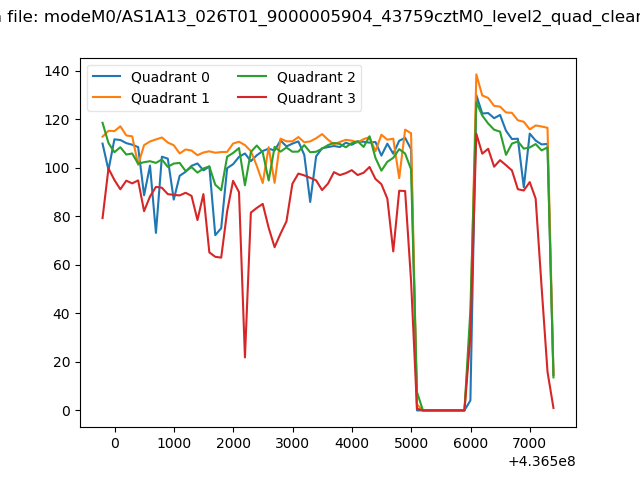 |
|
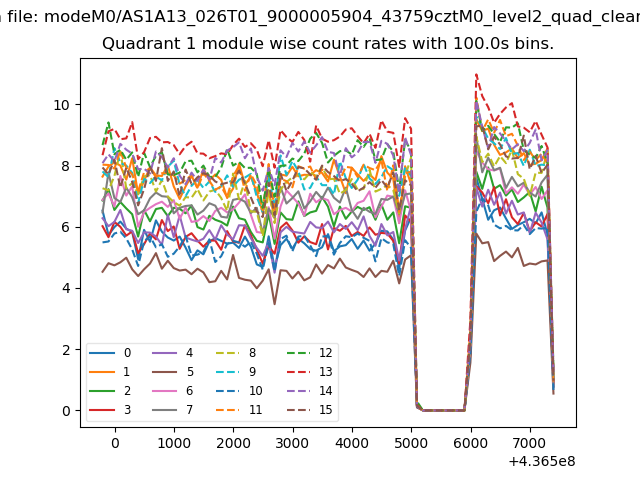
| Module-wise count rates for Quadrant A Data is divided into 100 sec bins |
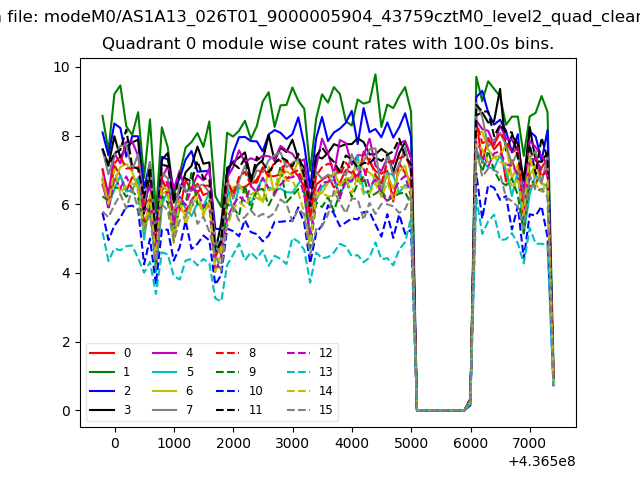 |
 |
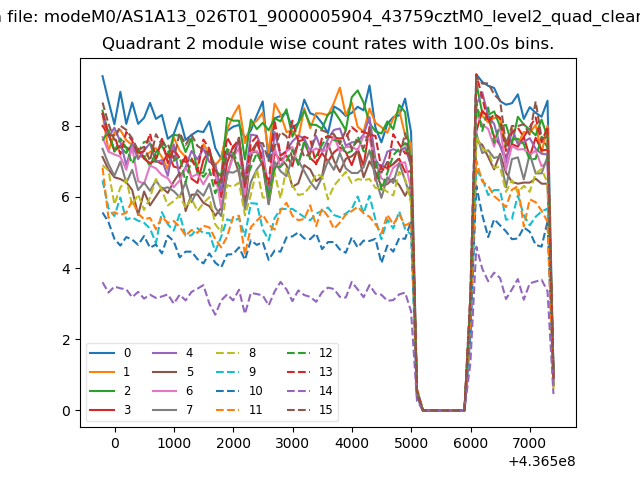
| Module-wise count rates for Quadrant B Data is divided into 100 sec bins |
 |
 |
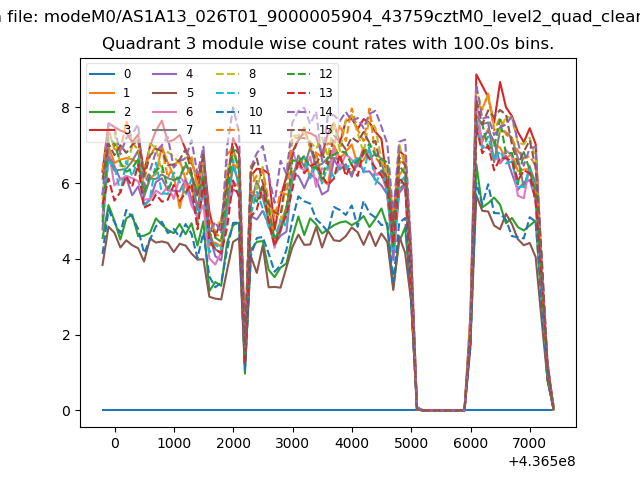
| Module-wise count rates for Quadrant C Data is divided into 100 sec bins |
 |
 |
| Module-wise count rates for Quadrant D Data is divided into 100 sec bins |
 |
 |
| Parameter | Plot |
|---|---|
| CZT HV Monitor |  |
| D_VDD | 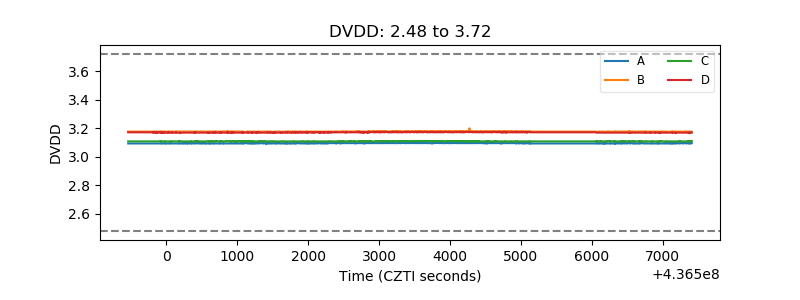 |
| Temperature 1 | 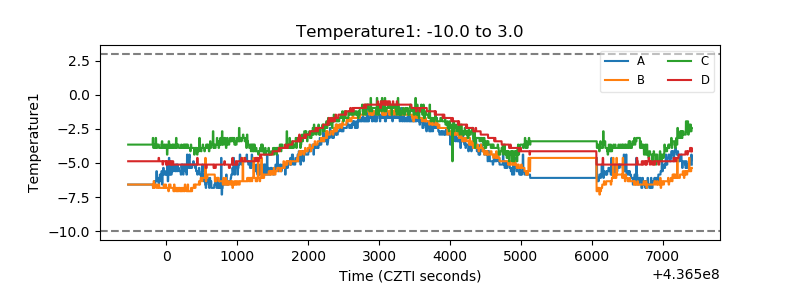 |
| Veto HV Monitor | 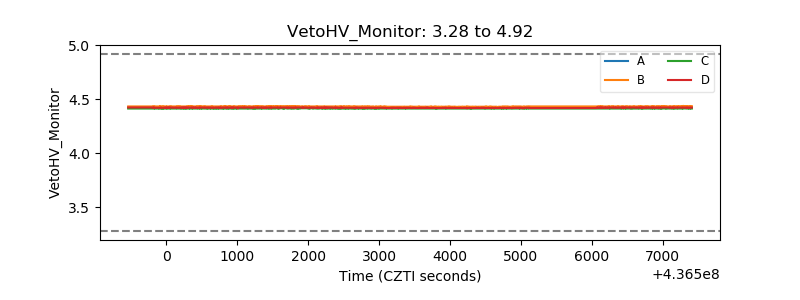 |
| Veto LLD | 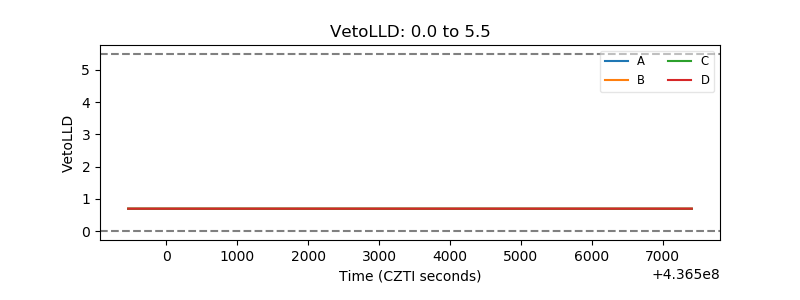 |
| Alpha Counter | 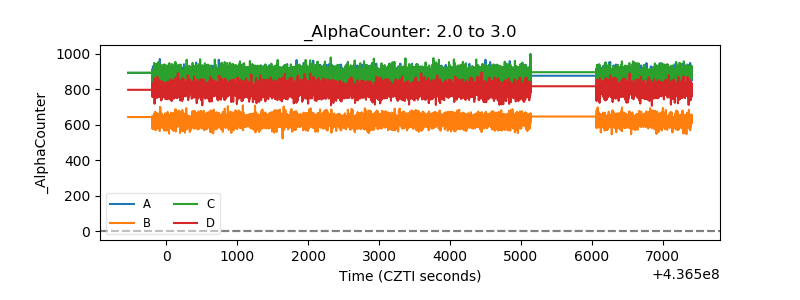 |
| _CPM_Rate | 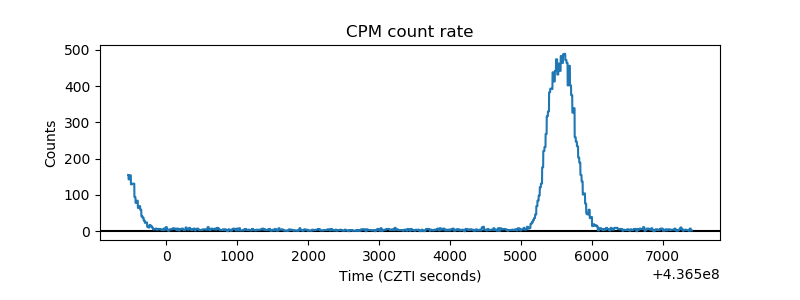 |
| CZT Counter | 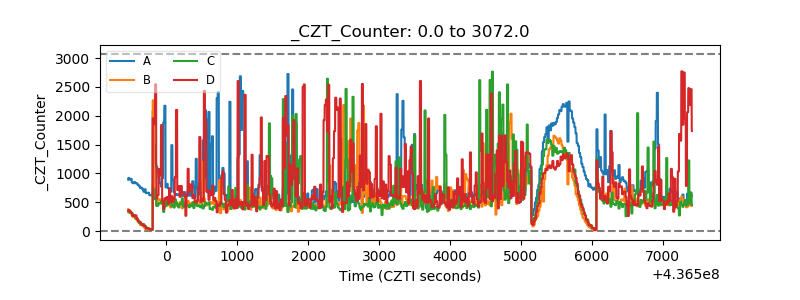 |
| +2.5 Volts monitor | 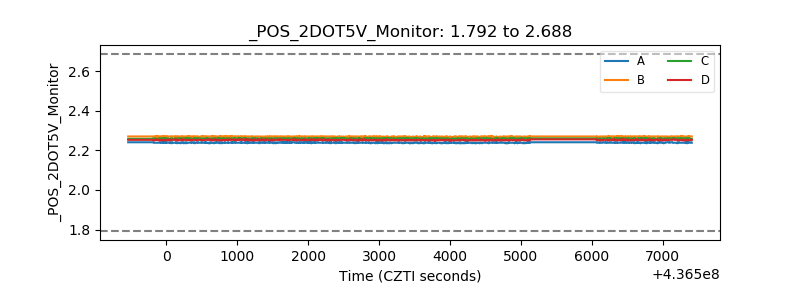 |
| +5 Volts monitor | 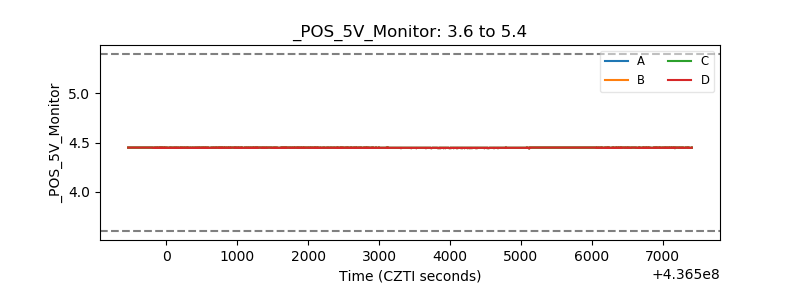 |
| _ROLL_ROT | 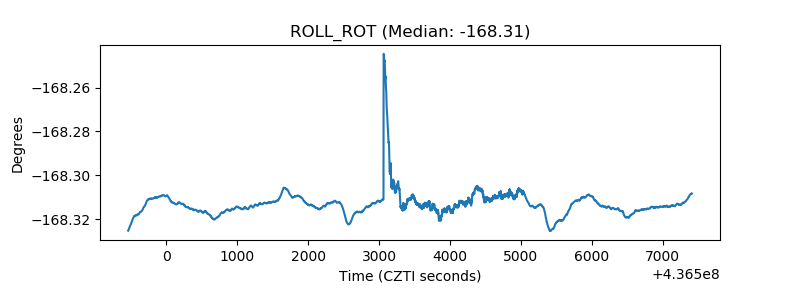 |
| _Roll_DEC | 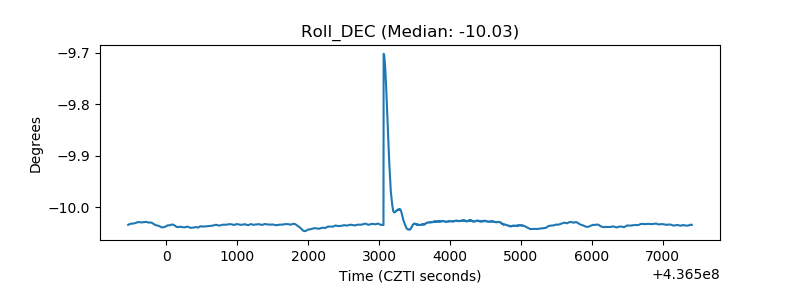 |
| _Roll_RA | 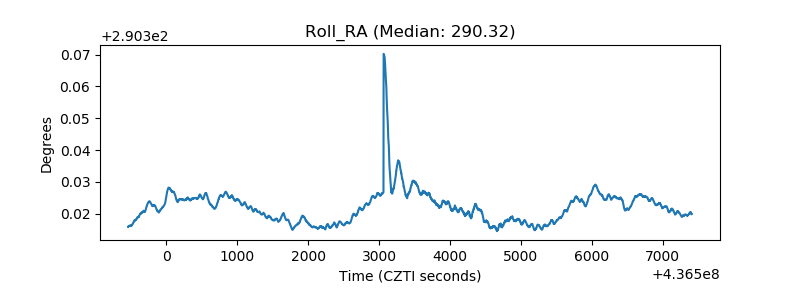 |
| Veto Counter | 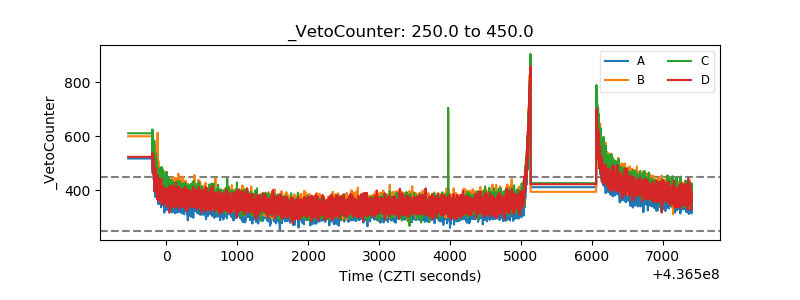 |