| Param | Original file | Final file |
|---|---|---|
| Filename | modeM0/AS1A13_026T01_9000005904_43761cztM0_level2.fits | modeM0/AS1A13_026T01_9000005904_43761cztM0_level2_quad_clean.evt |
| Size (bytes) | 508,317,120 | 104,656,320 |
| Size | 484.8 MB | 99.8 MB |
| Events in quadrant A | 4,749,946 | 712,473 |
| Events in quadrant B | 3,897,906 | 742,415 |
| Events in quadrant C | 3,710,294 | 709,013 |
| Events in quadrant D | 5,966,411 | 563,230 |
| Mode M0 | |||
|---|---|---|---|
| Quadrant | BADHDUFLAG | Total packets | Discarded packets |
| A | 0 | 18898 | 1 |
| B | 0 | 15564 | 1 |
| C | 0 | 15249 | 1 |
| D | 0 | 22041 | 1 |
| Mode SS | |||
|---|---|---|---|
| Quadrant | BADHDUFLAG | Total packets | Discarded packets |
| A | 0 | 128 | 0 |
| B | 0 | 128 | 0 |
| C | 0 | 128 | 0 |
| D | 0 | 128 | 0 |
| Mode M9 | |||
|---|---|---|---|
| Quadrant | BADHDUFLAG | Total packets | Discarded packets |
| A | 0 | 10 | 0 |
| B | 0 | 10 | 0 |
| C | 0 | 10 | 0 |
| D | 0 | 10 | 0 |
| Quadrant | Total seconds | Saturated seconds | Saturation percentage |
|---|---|---|---|
| A | 6331 | 225 | 3.553941% |
| B | 6331 | 212 | 3.348602% |
| C | 6331 | 212 | 3.348602% |
| D | 6332 | 1033 | 16.313961% |
Noise dominated data is calculated using 1-second bins in cleaned event files. If a bin has >2000 counts, and if more than 50% of those come from <1% of pixels, then it is considered to be noise-dominated and hence unusable.
| Quadrant | # 1 sec bins | Bins with >0 counts | Bins with >2000 counts | High rate bins dominated by noise | Noise dominated (total time) | Noise dominated (detector-on time) | Marked lightcurve |
|---|---|---|---|---|---|---|---|
| A | 7386 | 6332 | 74 | 74 | 1.00% | 1.17% | 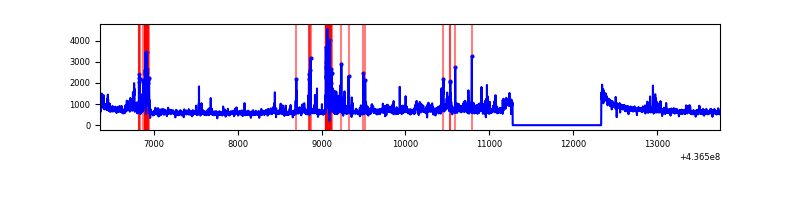 |
| B | 7386 | 6332 | 92 | 92 | 1.25% | 1.45% | 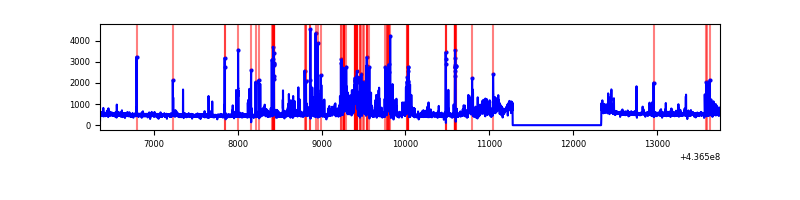 |
| C | 7386 | 6332 | 138 | 138 | 1.87% | 2.18% | 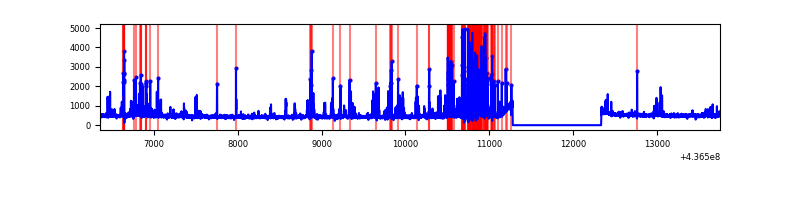 |
| D | 7387 | 6332 | 508 | 508 | 6.88% | 8.02% | 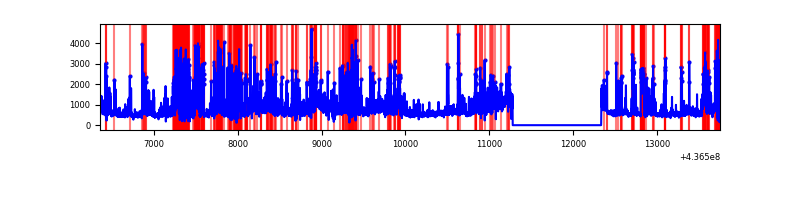 |
Top three noisy pixels from each quadrant. If the there are fewer than three noisy pixels in the level2.evt file, extra rows are filled as -1
| Pixel properties | Quadrant properties | ||||||
|---|---|---|---|---|---|---|---|
| Quadrant | DetID | PixID | Counts | Sigma | Mean | Median | Sigma |
| A | 10 | 83 | 910044 | 5946.18 | 743 | 728 | 152.9 |
| A | 14 | 63 | 213962 | 1394.38 | 743 | 728 | 152.9 |
| A | 13 | 248 | 212149 | 1382.52 | 743 | 728 | 152.9 |
| B | 0 | 200 | 283866 | 1942.64 | 745 | 722 | 145.8 |
| B | 5 | 235 | 234446 | 1603.57 | 745 | 722 | 145.8 |
| B | 4 | 80 | 148685 | 1015.17 | 745 | 722 | 145.8 |
| C | 15 | 158 | 551907 | 3251.81 | 726 | 730 | 169.5 |
| C | 14 | 254 | 135378 | 794.39 | 726 | 730 | 169.5 |
| C | 14 | 96 | 64499 | 376.22 | 726 | 730 | 169.5 |
| D | 13 | 249 | 776889 | 4406.24 | 678 | 657 | 176.2 |
| D | 4 | 212 | 716153 | 4061.47 | 678 | 657 | 176.2 |
| D | 5 | 235 | 446872 | 2532.91 | 678 | 657 | 176.2 |
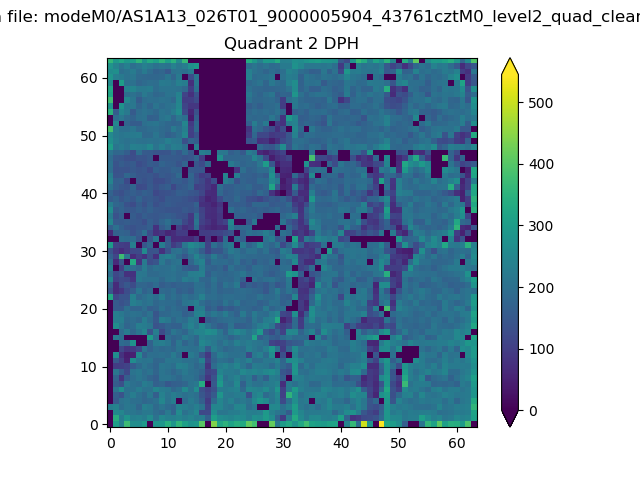
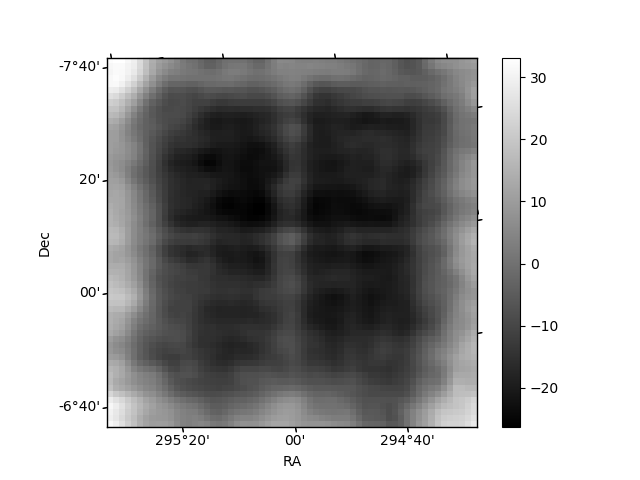
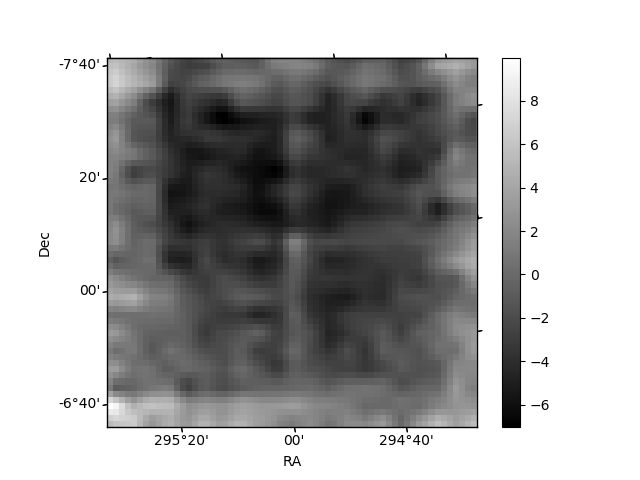
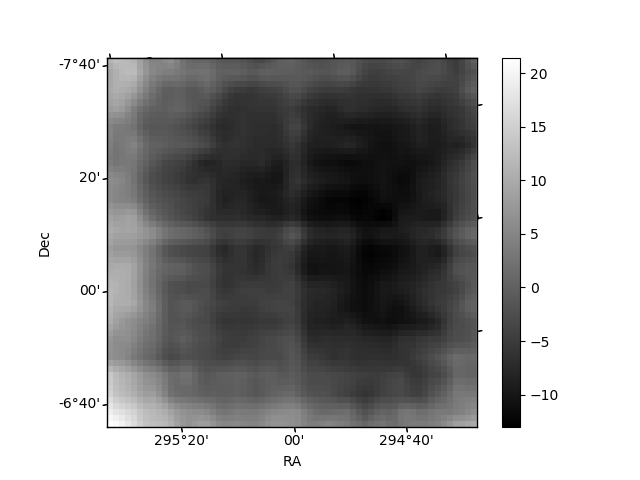
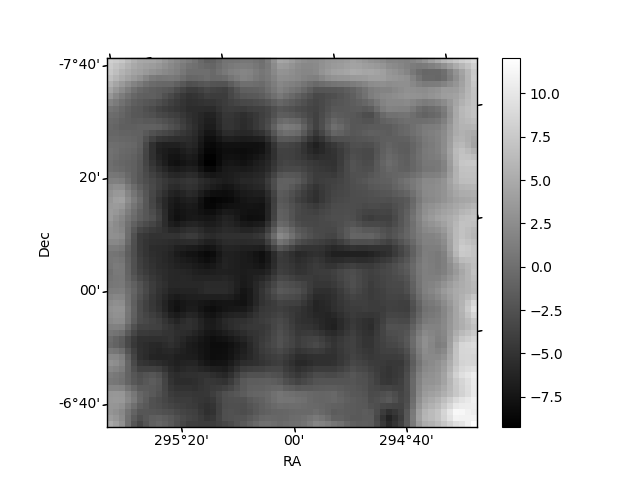
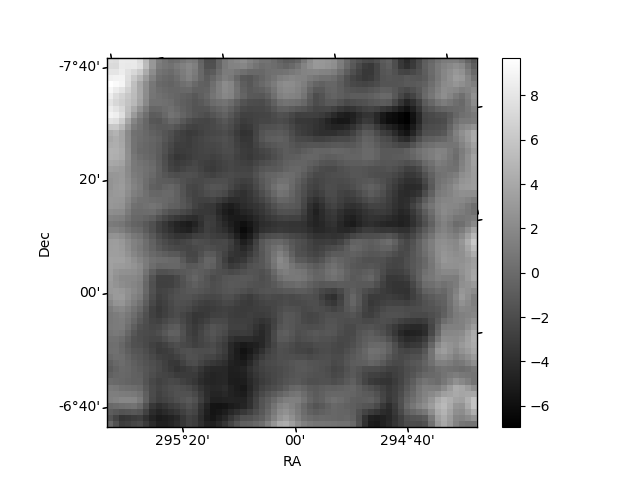
Histogram calculated using DETX and DETY for each event in the final _common_clean file
| Quadrant A | 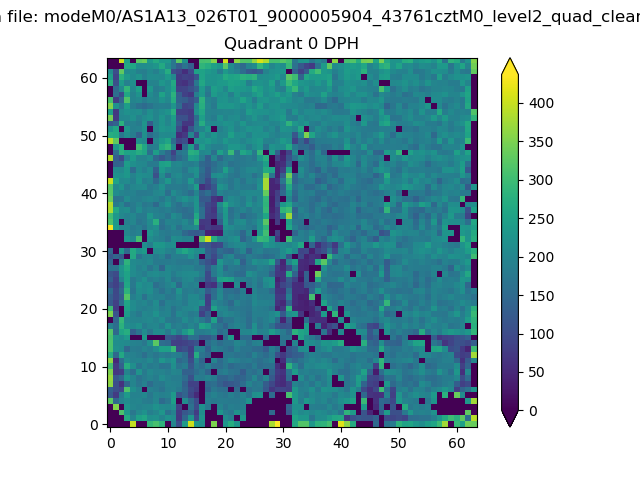 |
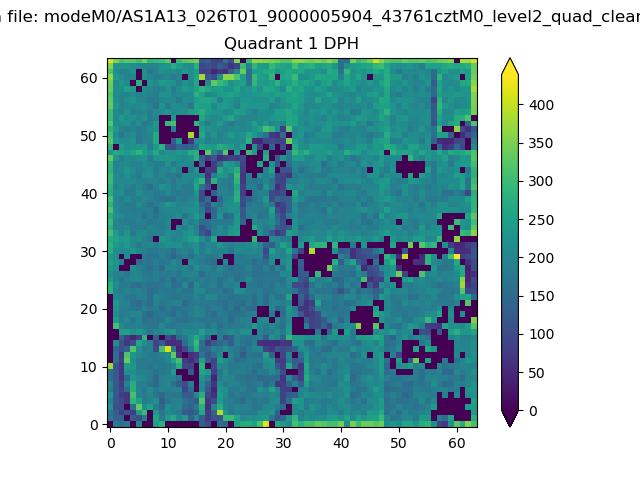 |
Quadrant B |
|---|---|---|---|
| Quadrant D | 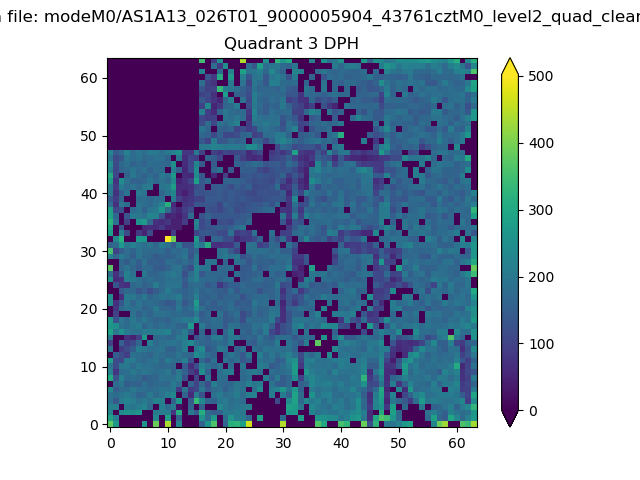 |
 |
Quadrant C |
| Plot type | Count rate plots | Images |
|---|---|---|
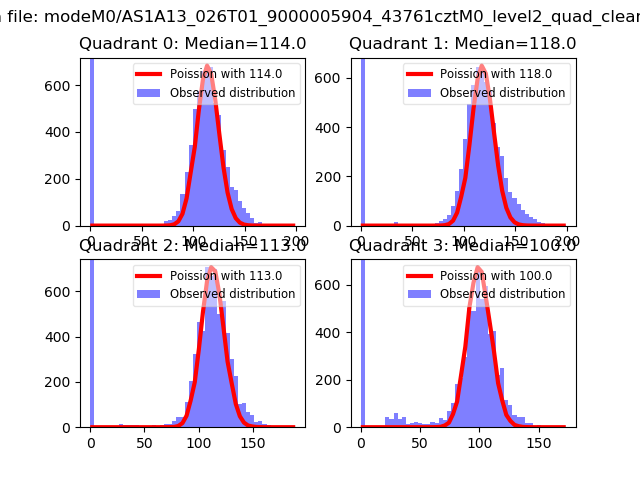
| Comparison with Poisson distribution Blue bars denote a histogram of data divided into 1 sec bins. Red curve is a Poisson curve with rate = median count rate of data. |
 |
 |
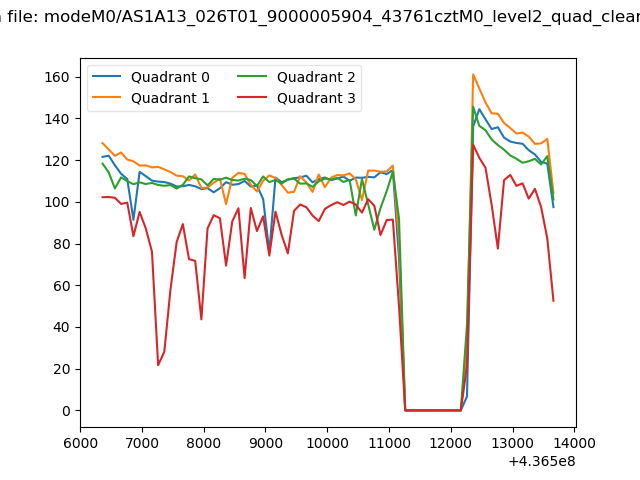
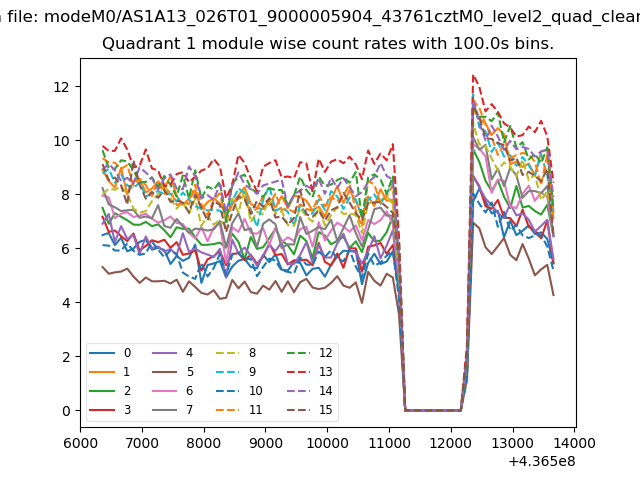
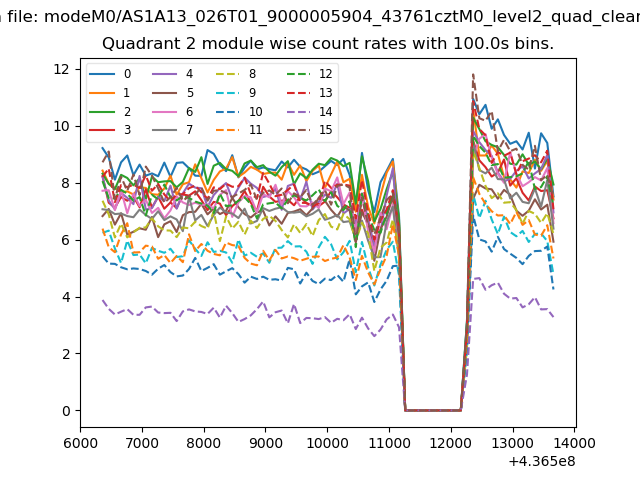
| Quadrant-wise count rates Data is divided into 100 sec bins |
 |
|
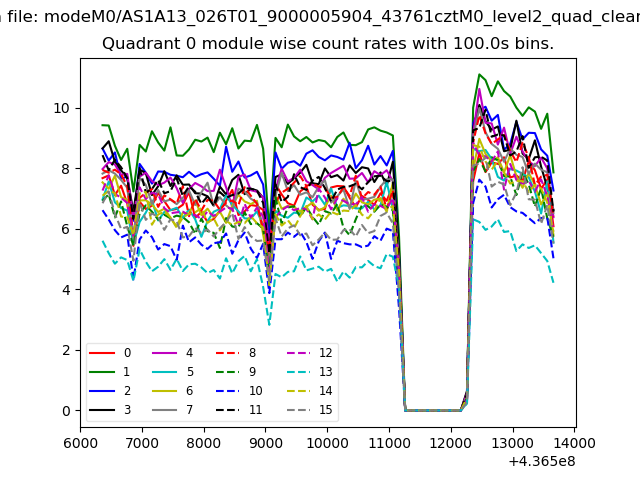
| Module-wise count rates for Quadrant A Data is divided into 100 sec bins |
 |
 |
| Module-wise count rates for Quadrant B Data is divided into 100 sec bins |
 |
 |
| Module-wise count rates for Quadrant C Data is divided into 100 sec bins |
 |
 |
| Module-wise count rates for Quadrant D Data is divided into 100 sec bins |
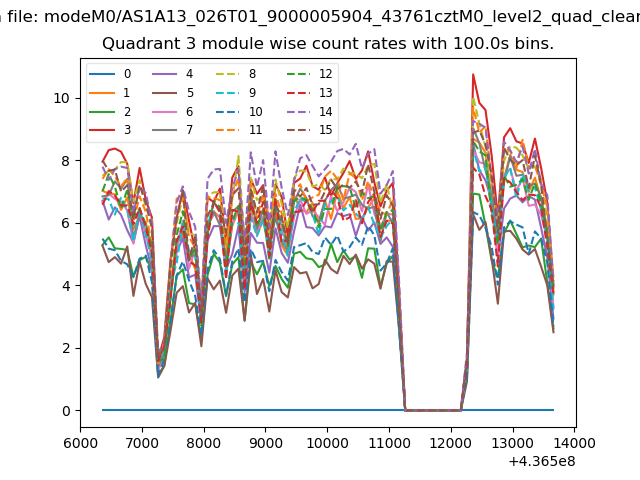 |
 |
| Parameter | Plot |
|---|---|
| CZT HV Monitor | 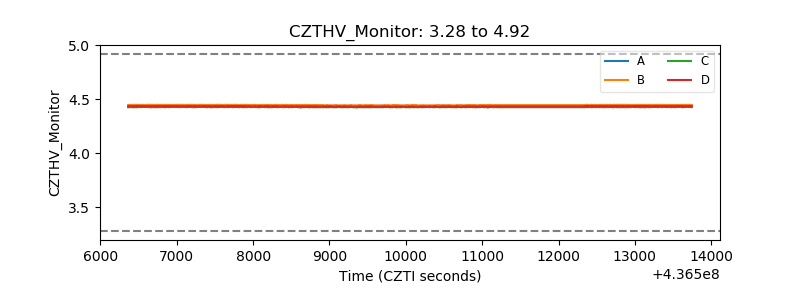 |
| D_VDD | 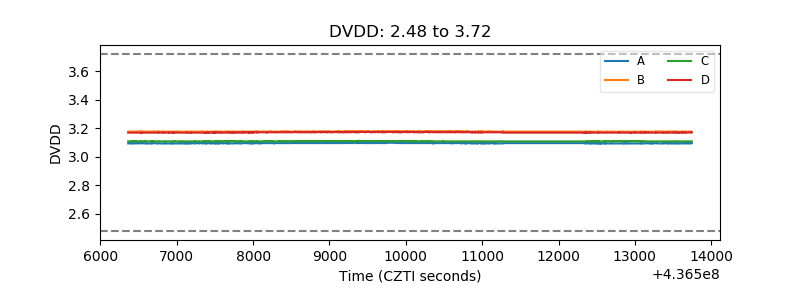 |
| Temperature 1 | 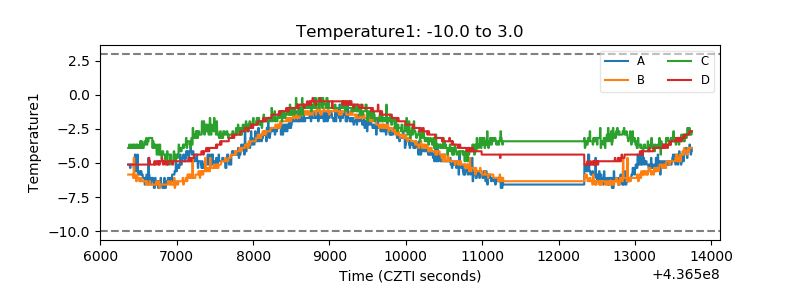 |
| Veto HV Monitor | 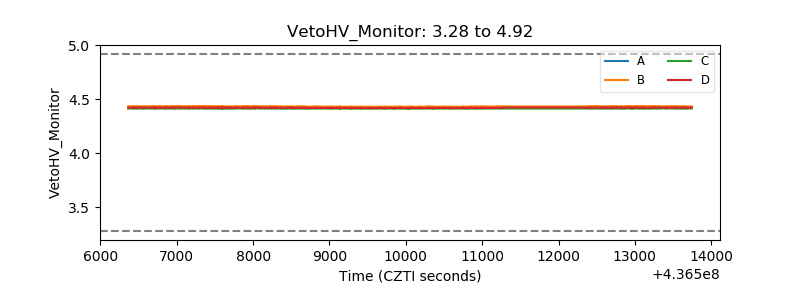 |
| Veto LLD | 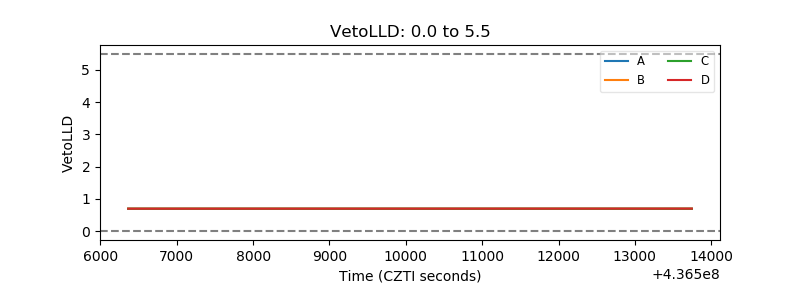 |
| Alpha Counter | 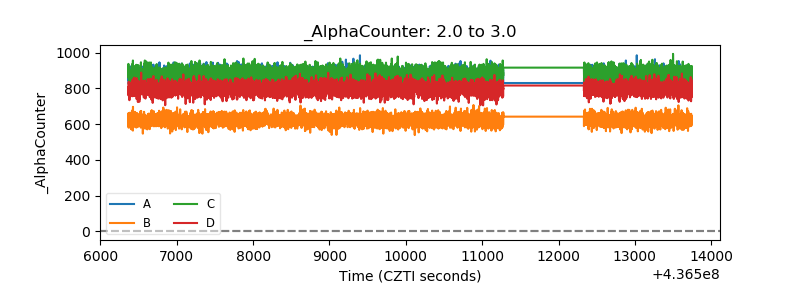 |
| _CPM_Rate | 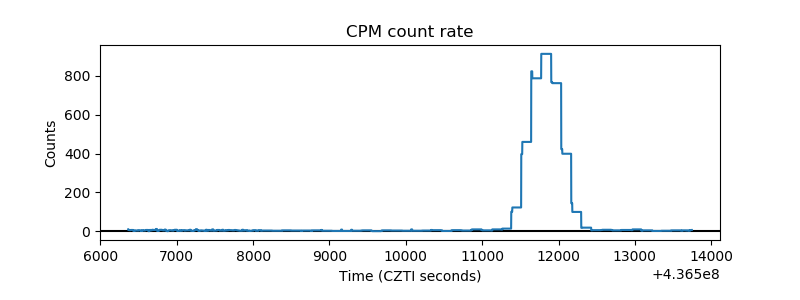 |
| CZT Counter | 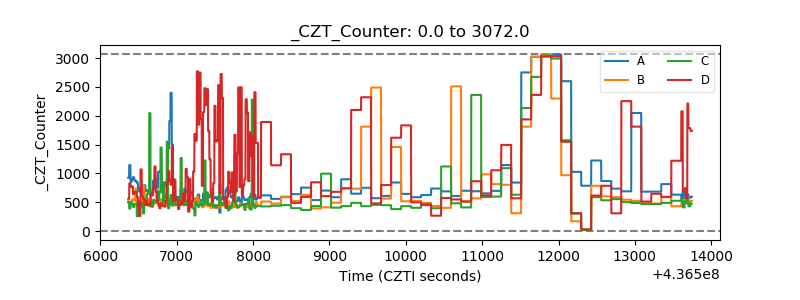 |
| +2.5 Volts monitor | 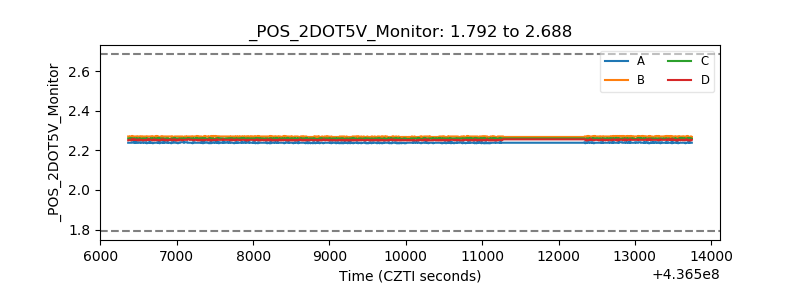 |
| +5 Volts monitor | 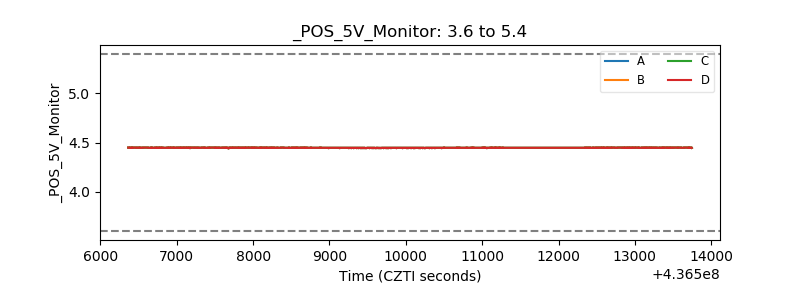 |
| _ROLL_ROT | 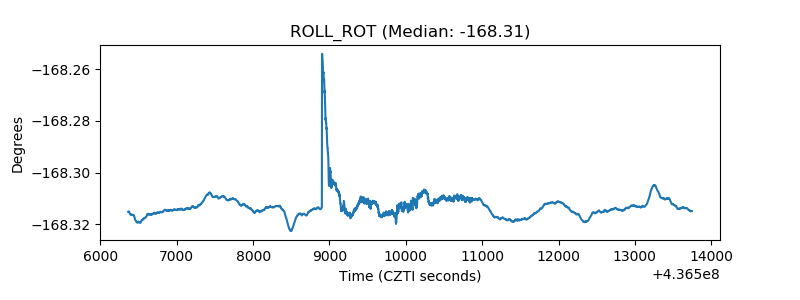 |
| _Roll_DEC | 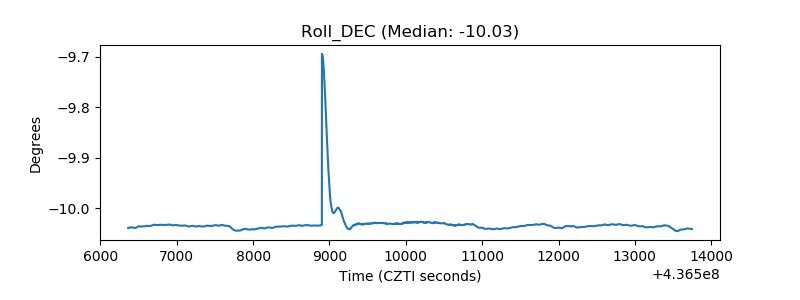 |
| _Roll_RA | 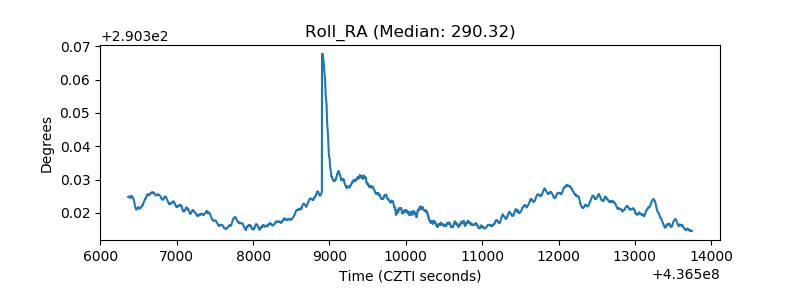 |
| Veto Counter | 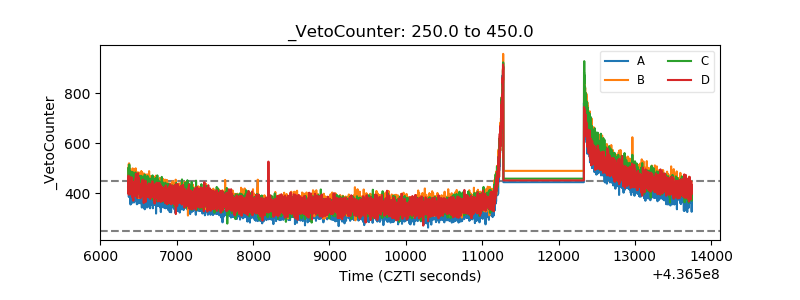 |