| Param | Original file | Final file |
|---|---|---|
| Filename | modeM0/AS1A13_026T01_9000005904_43762cztM0_level2.fits | modeM0/AS1A13_026T01_9000005904_43762cztM0_level2_quad_clean.evt |
| Size (bytes) | 572,123,520 | 112,593,600 |
| Size | 545.6 MB | 107.4 MB |
| Events in quadrant A | 5,334,892 | 774,487 |
| Events in quadrant B | 4,651,254 | 816,386 |
| Events in quadrant C | 4,329,490 | 760,715 |
| Events in quadrant D | 6,363,209 | 608,578 |
| Mode M0 | |||
|---|---|---|---|
| Quadrant | BADHDUFLAG | Total packets | Discarded packets |
| A | 0 | 20964 | 2 |
| B | 0 | 18029 | 2 |
| C | 0 | 17014 | 2 |
| D | 0 | 23274 | 2 |
| Mode SS | |||
|---|---|---|---|
| Quadrant | BADHDUFLAG | Total packets | Discarded packets |
| A | 0 | 130 | 0 |
| B | 0 | 130 | 0 |
| C | 0 | 130 | 0 |
| D | 0 | 130 | 0 |
| Mode M9 | |||
|---|---|---|---|
| Quadrant | BADHDUFLAG | Total packets | Discarded packets |
| A | 0 | 14 | 0 |
| B | 0 | 15 | 0 |
| C | 0 | 15 | 0 |
| D | 0 | 15 | 0 |
| Quadrant | Total seconds | Saturated seconds | Saturation percentage |
|---|---|---|---|
| A | 6440 | 354 | 5.496894% |
| B | 6440 | 230 | 3.571429% |
| C | 6440 | 376 | 5.838509% |
| D | 6440 | 1195 | 18.555901% |
Noise dominated data is calculated using 1-second bins in cleaned event files. If a bin has >2000 counts, and if more than 50% of those come from <1% of pixels, then it is considered to be noise-dominated and hence unusable.
| Quadrant | # 1 sec bins | Bins with >0 counts | Bins with >2000 counts | High rate bins dominated by noise | Noise dominated (total time) | Noise dominated (detector-on time) | Marked lightcurve |
|---|---|---|---|---|---|---|---|
| A | 7615 | 6441 | 190 | 190 | 2.50% | 2.95% | 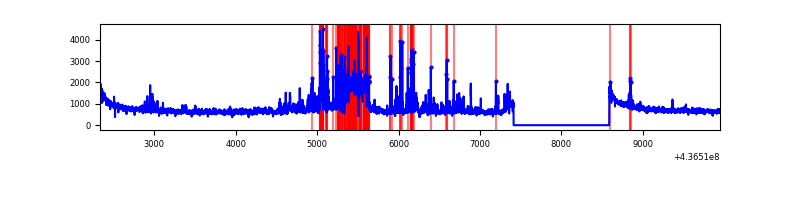 |
| B | 7615 | 6441 | 122 | 122 | 1.60% | 1.89% | 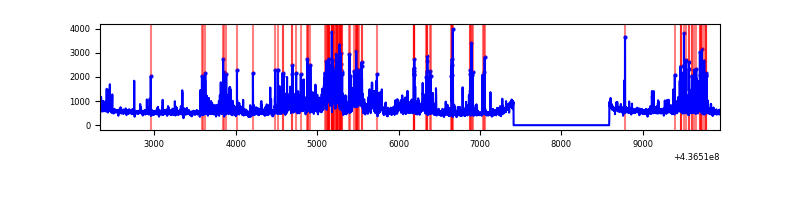 |
| C | 7615 | 6441 | 260 | 260 | 3.41% | 4.04% | 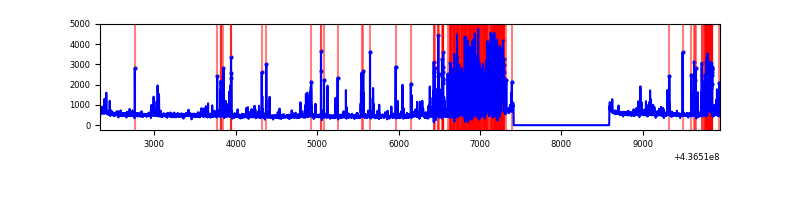 |
| D | 7615 | 6441 | 603 | 603 | 7.92% | 9.36% | 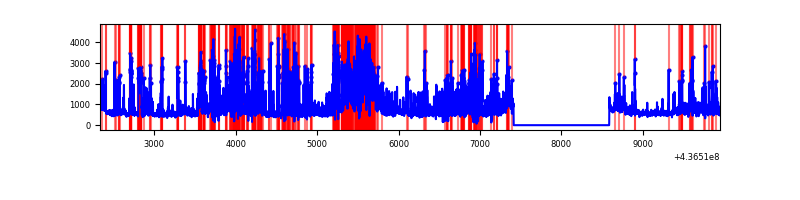 |
Top three noisy pixels from each quadrant. If the there are fewer than three noisy pixels in the level2.evt file, extra rows are filled as -1
| Pixel properties | Quadrant properties | ||||||
|---|---|---|---|---|---|---|---|
| Quadrant | DetID | PixID | Counts | Sigma | Mean | Median | Sigma |
| A | 10 | 83 | 996266 | 6096.57 | 792 | 778 | 163.3 |
| A | 15 | 223 | 647735 | 3962.1 | 792 | 778 | 163.3 |
| A | 14 | 63 | 198761 | 1212.49 | 792 | 778 | 163.3 |
| B | 0 | 200 | 630785 | 4081.66 | 793 | 771 | 154.4 |
| B | 5 | 235 | 454420 | 2939.05 | 793 | 771 | 154.4 |
| B | 0 | 213 | 130607 | 841.17 | 793 | 771 | 154.4 |
| C | 15 | 158 | 1072785 | 5988.67 | 763 | 767 | 179.0 |
| C | 14 | 254 | 128841 | 715.47 | 763 | 767 | 179.0 |
| C | 15 | 174 | 46125 | 253.39 | 763 | 767 | 179.0 |
| D | 4 | 212 | 1216896 | 6538.49 | 726 | 703 | 186.0 |
| D | 12 | 2 | 480519 | 2579.59 | 726 | 703 | 186.0 |
| D | 5 | 235 | 279674 | 1499.8 | 726 | 703 | 186.0 |
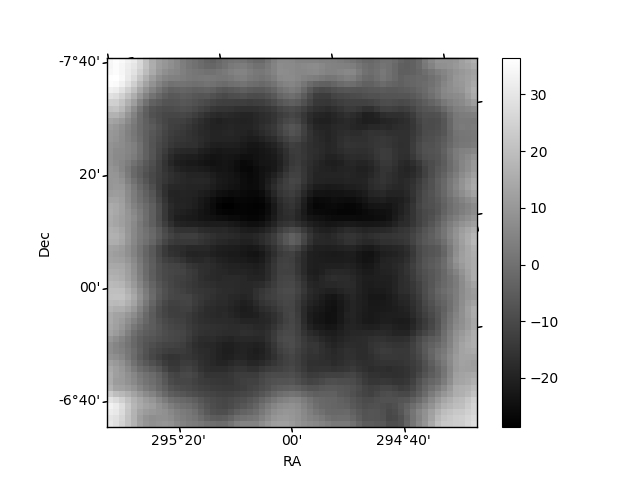
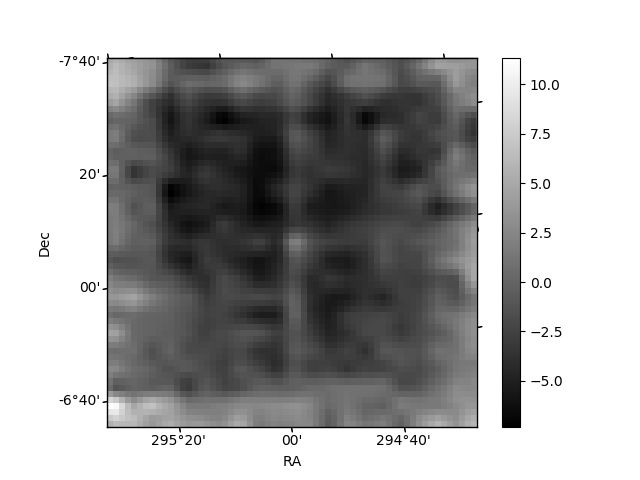
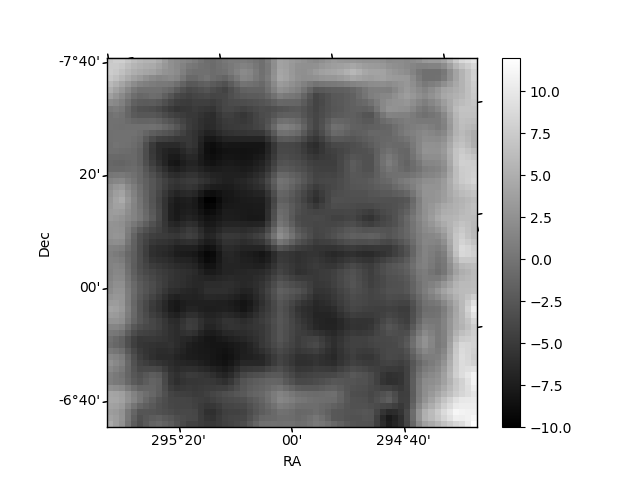
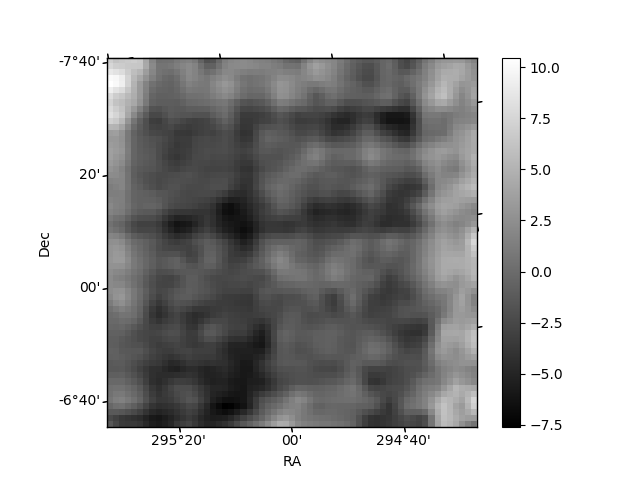
Histogram calculated using DETX and DETY for each event in the final _common_clean file
| Quadrant A | 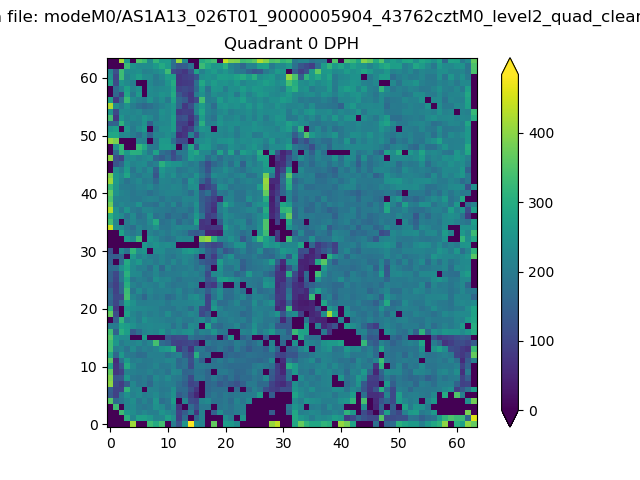 |
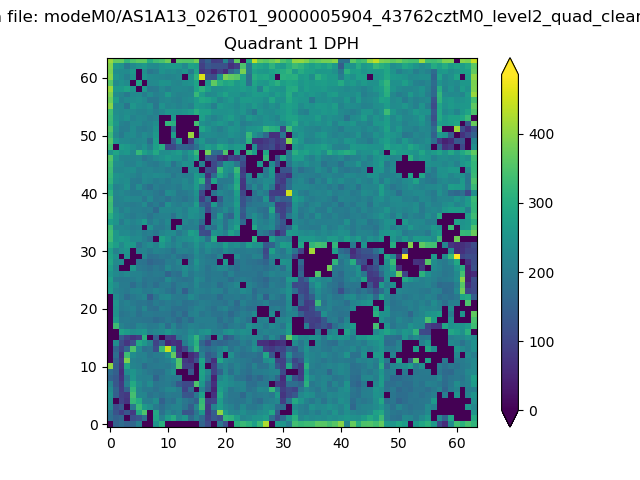 |
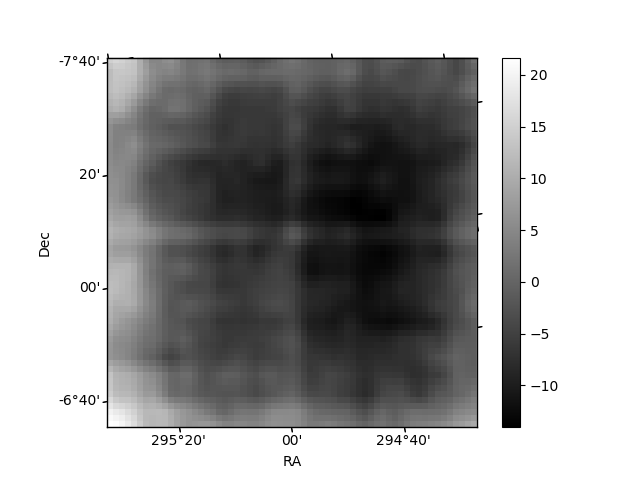
Quadrant B |
|---|---|---|---|
| Quadrant D | 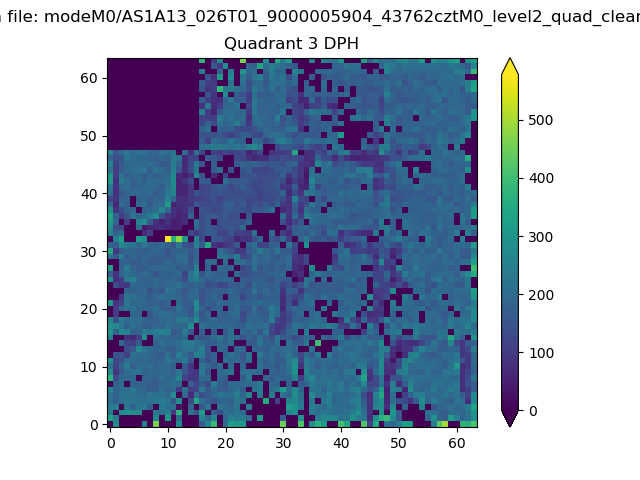 |
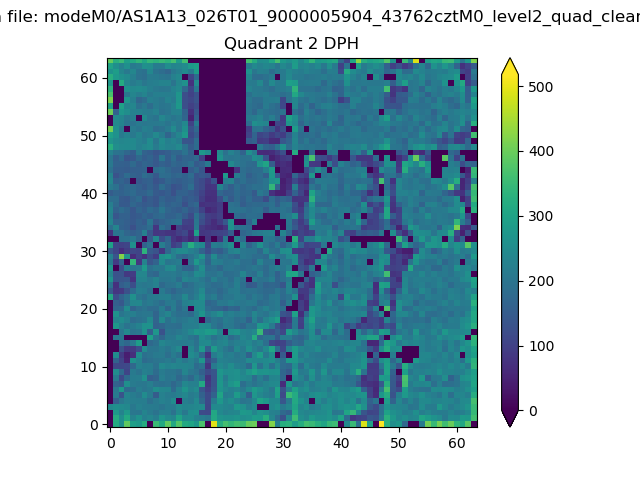 |
Quadrant C |
| Plot type | Count rate plots | Images |
|---|---|---|
| Comparison with Poisson distribution Blue bars denote a histogram of data divided into 1 sec bins. Red curve is a Poisson curve with rate = median count rate of data. |
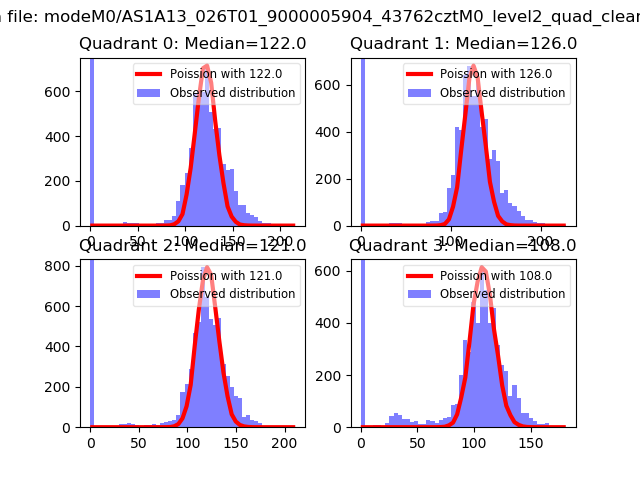 |
 |
| Quadrant-wise count rates Data is divided into 100 sec bins |
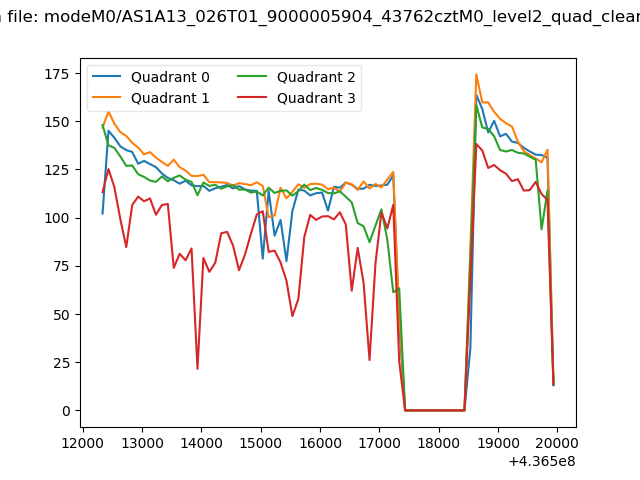 |
|
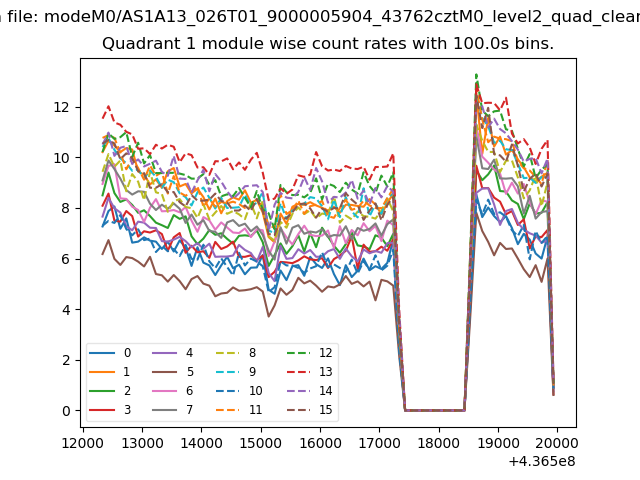
| Module-wise count rates for Quadrant A Data is divided into 100 sec bins |
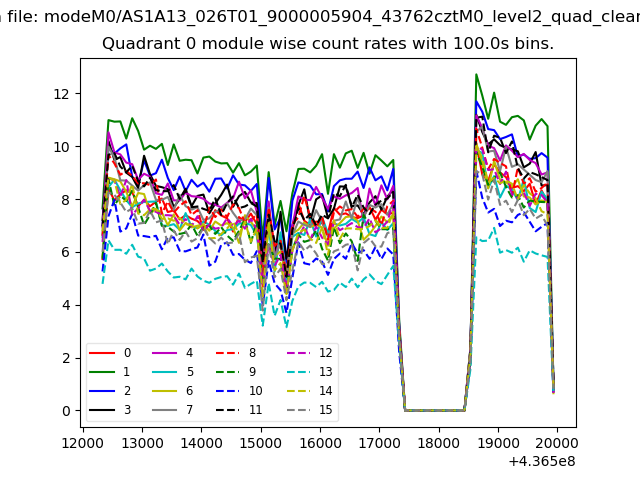 |
 |
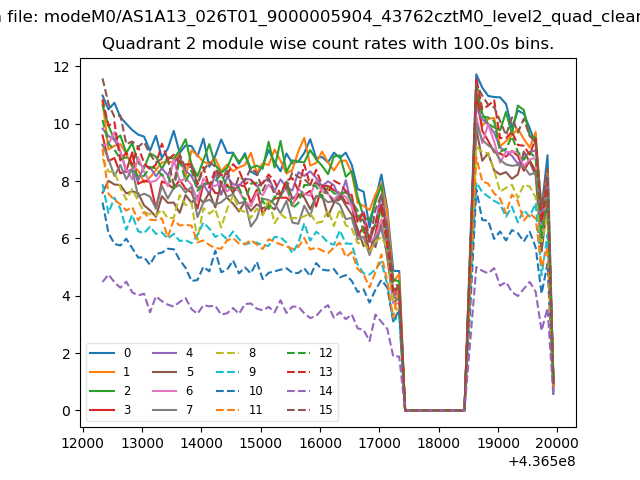
| Module-wise count rates for Quadrant B Data is divided into 100 sec bins |
 |
 |
| Module-wise count rates for Quadrant C Data is divided into 100 sec bins |
 |
 |
| Module-wise count rates for Quadrant D Data is divided into 100 sec bins |
 |
 |
| Parameter | Plot |
|---|---|
| CZT HV Monitor | 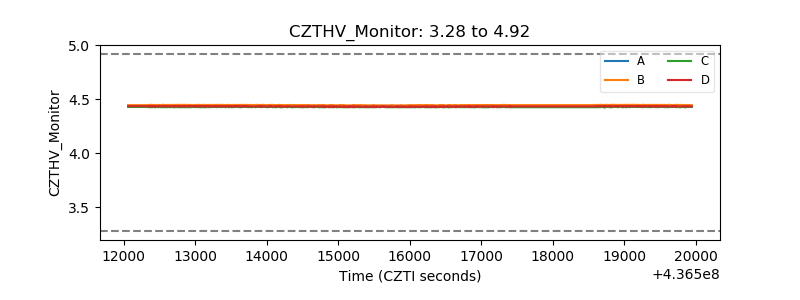 |
| D_VDD | 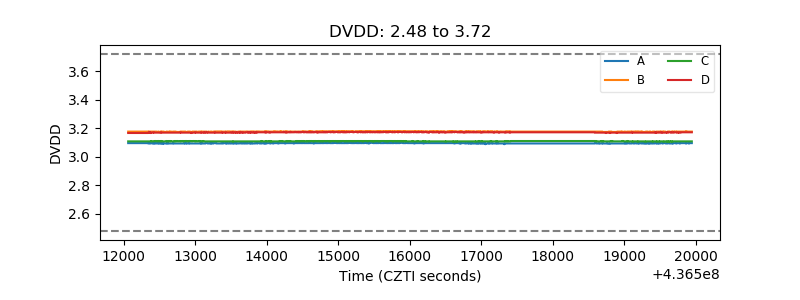 |
| Temperature 1 | 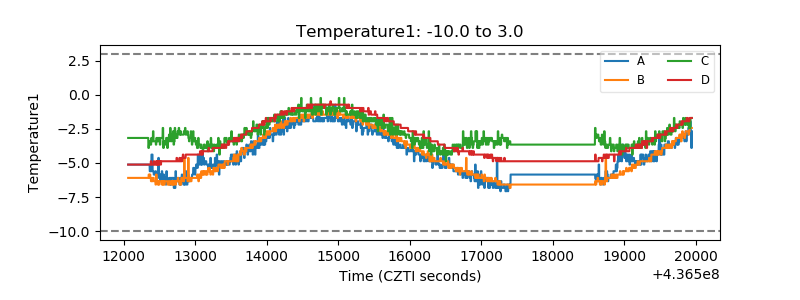 |
| Veto HV Monitor | 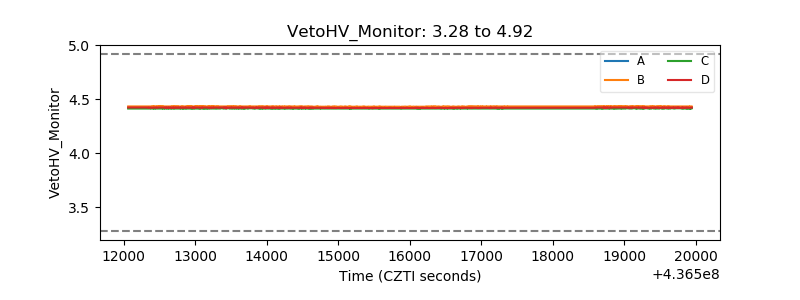 |
| Veto LLD | 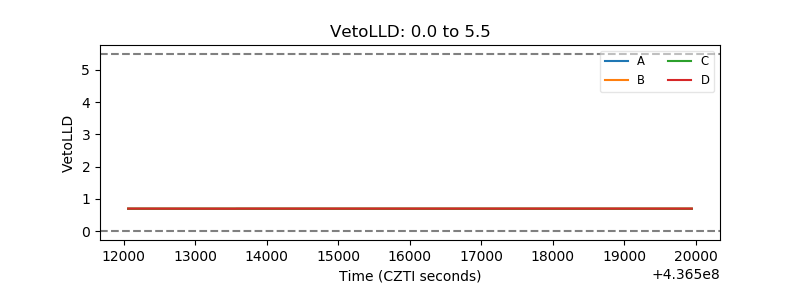 |
| Alpha Counter | 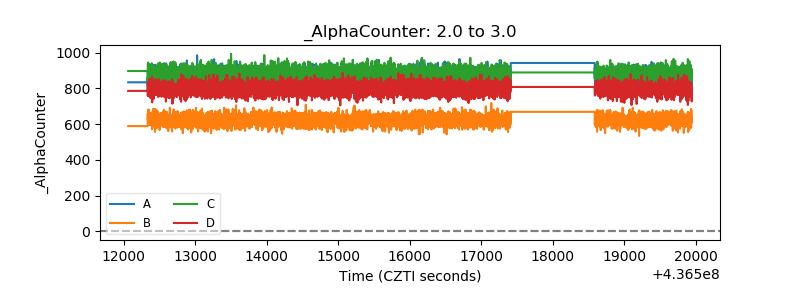 |
| _CPM_Rate | 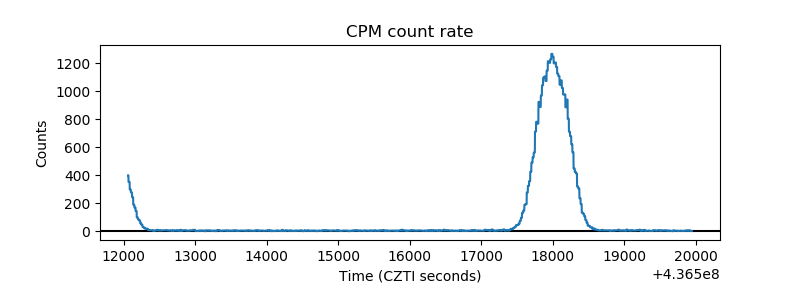 |
| CZT Counter | 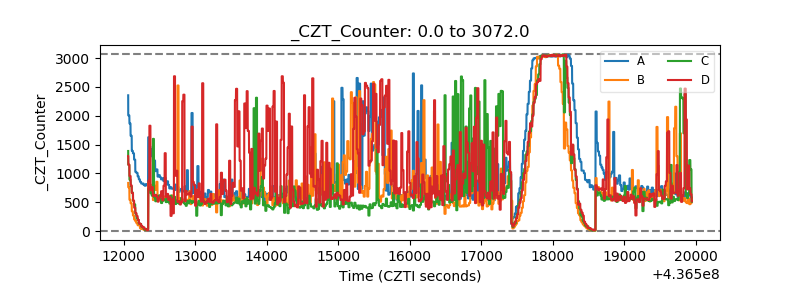 |
| +2.5 Volts monitor | 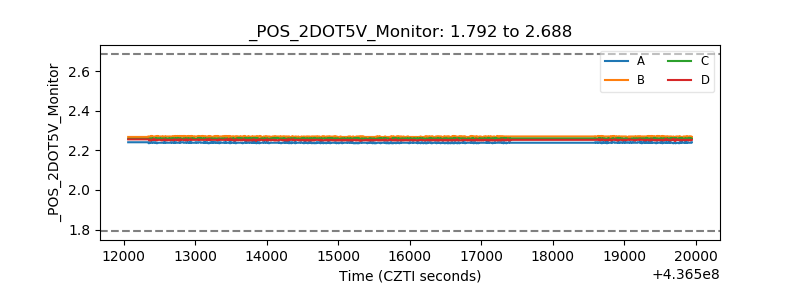 |
| +5 Volts monitor | 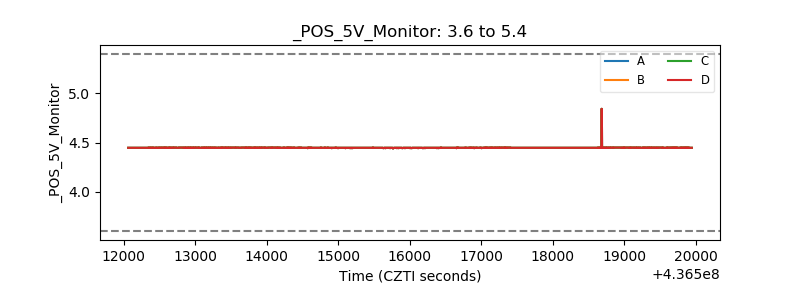 |
| _ROLL_ROT |  |
| _Roll_DEC | 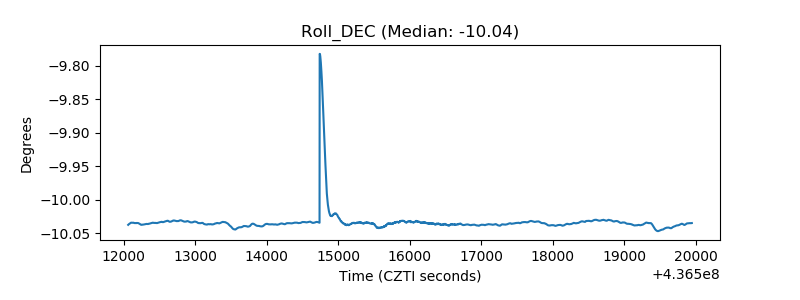 |
| _Roll_RA | 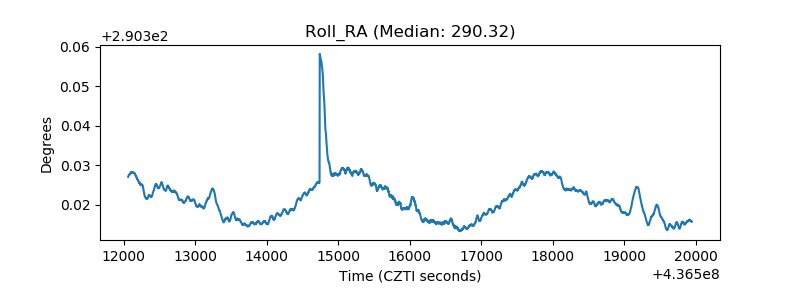 |
| Veto Counter | 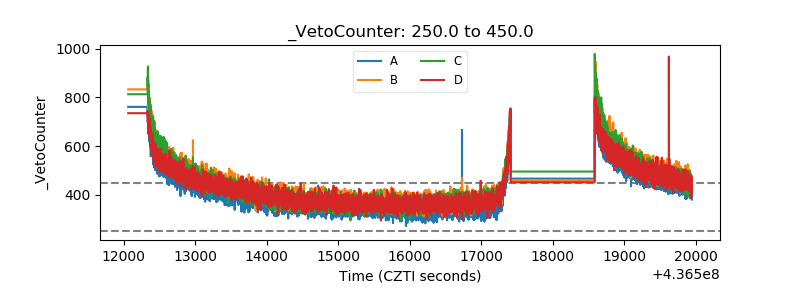 |