| Param | Original file | Final file |
|---|---|---|
| Filename | modeM0/AS1A13_026T01_9000005904_43763cztM0_level2.fits | modeM0/AS1A13_026T01_9000005904_43763cztM0_level2_quad_clean.evt |
| Size (bytes) | 574,810,560 | 107,720,640 |
| Size | 548.2 MB | 102.7 MB |
| Events in quadrant A | 5,001,150 | 755,480 |
| Events in quadrant B | 6,320,952 | 693,535 |
| Events in quadrant C | 4,241,865 | 736,168 |
| Events in quadrant D | 5,242,327 | 652,119 |
| Mode M0 | |||
|---|---|---|---|
| Quadrant | BADHDUFLAG | Total packets | Discarded packets |
| A | 0 | 19704 | 1 |
| B | 0 | 22925 | 2 |
| C | 0 | 16496 | 1 |
| D | 0 | 19690 | 1 |
| Mode SS | |||
|---|---|---|---|
| Quadrant | BADHDUFLAG | Total packets | Discarded packets |
| A | 0 | 122 | 0 |
| B | 0 | 122 | 0 |
| C | 0 | 122 | 0 |
| D | 0 | 122 | 0 |
| Mode M9 | |||
|---|---|---|---|
| Quadrant | BADHDUFLAG | Total packets | Discarded packets |
| A | 0 | 12 | 0 |
| B | 0 | 12 | 0 |
| C | 0 | 12 | 0 |
| D | 0 | 12 | 0 |
| Quadrant | Total seconds | Saturated seconds | Saturation percentage |
|---|---|---|---|
| A | 6085 | 292 | 4.798685% |
| B | 6085 | 1029 | 16.910435% |
| C | 6085 | 371 | 6.096960% |
| D | 6085 | 602 | 9.893180% |
Noise dominated data is calculated using 1-second bins in cleaned event files. If a bin has >2000 counts, and if more than 50% of those come from <1% of pixels, then it is considered to be noise-dominated and hence unusable.
| Quadrant | # 1 sec bins | Bins with >0 counts | Bins with >2000 counts | High rate bins dominated by noise | Noise dominated (total time) | Noise dominated (detector-on time) | Marked lightcurve |
|---|---|---|---|---|---|---|---|
| A | 7290 | 6086 | 120 | 120 | 1.65% | 1.97% | 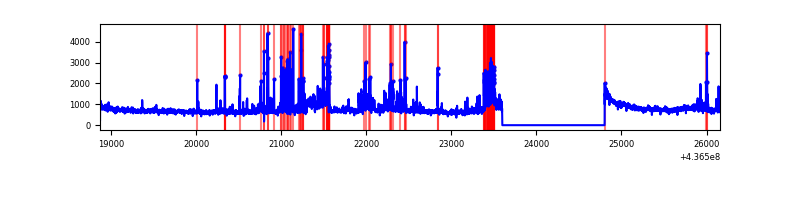 |
| B | 7290 | 6086 | 764 | 764 | 10.48% | 12.55% | 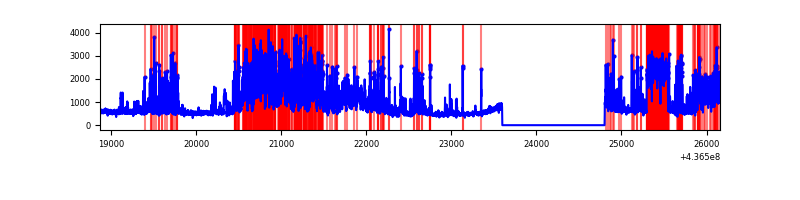 |
| C | 7290 | 6086 | 283 | 283 | 3.88% | 4.65% | 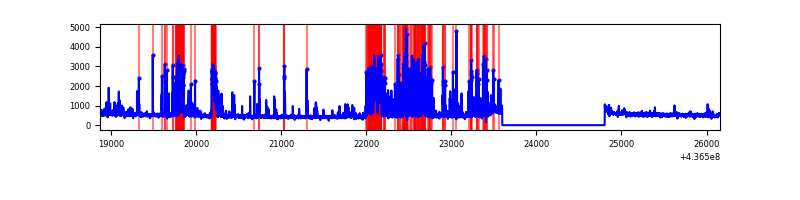 |
| D | 7290 | 6086 | 348 | 348 | 4.77% | 5.72% | 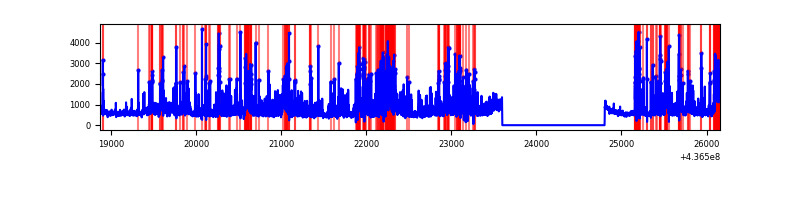 |
Top three noisy pixels from each quadrant. If the there are fewer than three noisy pixels in the level2.evt file, extra rows are filled as -1
| Pixel properties | Quadrant properties | ||||||
|---|---|---|---|---|---|---|---|
| Quadrant | DetID | PixID | Counts | Sigma | Mean | Median | Sigma |
| A | 10 | 83 | 901749 | 5765.1 | 761 | 747 | 156.3 |
| A | 15 | 223 | 492624 | 3147.3 | 761 | 747 | 156.3 |
| A | 14 | 63 | 238322 | 1520.13 | 761 | 747 | 156.3 |
| B | 0 | 200 | 1940386 | 13769.03 | 724 | 705 | 140.9 |
| B | 5 | 235 | 885897 | 6283.63 | 724 | 705 | 140.9 |
| B | 5 | 255 | 174289 | 1232.2 | 724 | 705 | 140.9 |
| C | 15 | 158 | 1136542 | 6662.53 | 731 | 738 | 170.5 |
| C | 14 | 254 | 135112 | 788.23 | 731 | 738 | 170.5 |
| C | 15 | 157 | 45055 | 259.96 | 731 | 738 | 170.5 |
| D | 4 | 212 | 723119 | 3961.84 | 727 | 707 | 182.3 |
| D | 5 | 235 | 464296 | 2542.41 | 727 | 707 | 182.3 |
| D | 13 | 249 | 123312 | 672.39 | 727 | 707 | 182.3 |
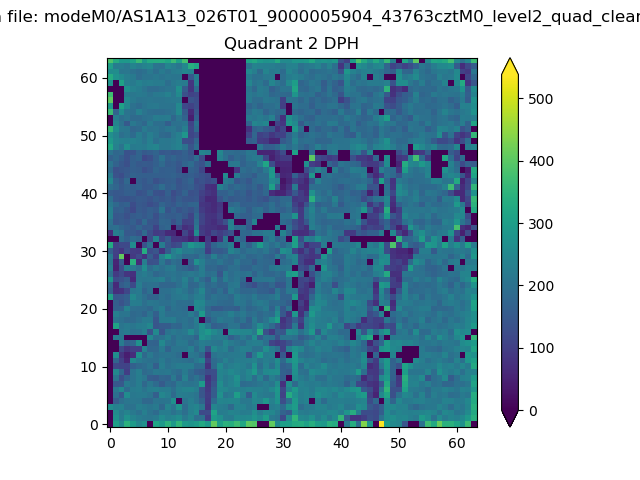
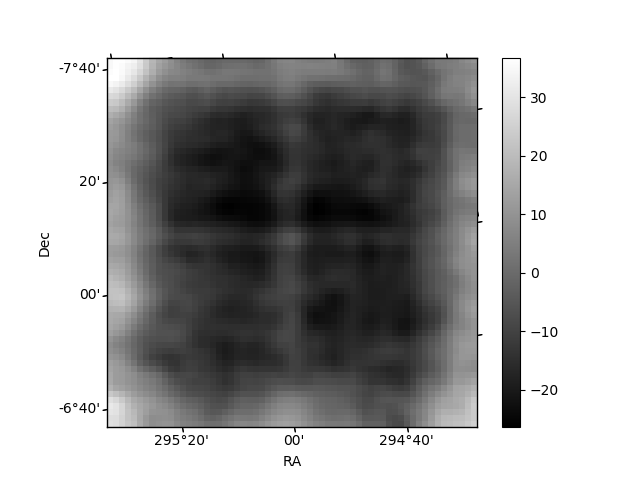
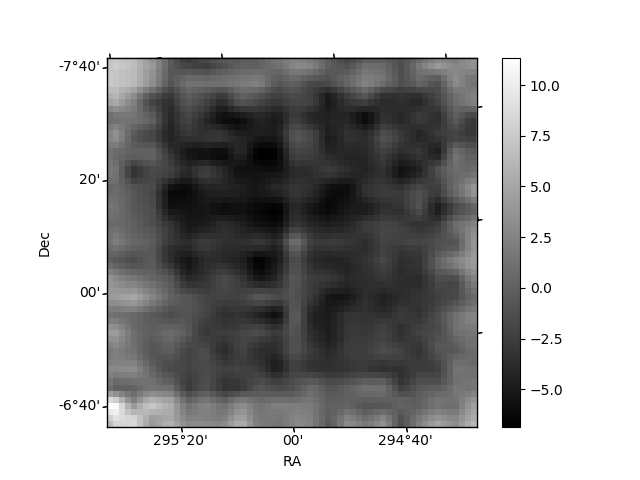
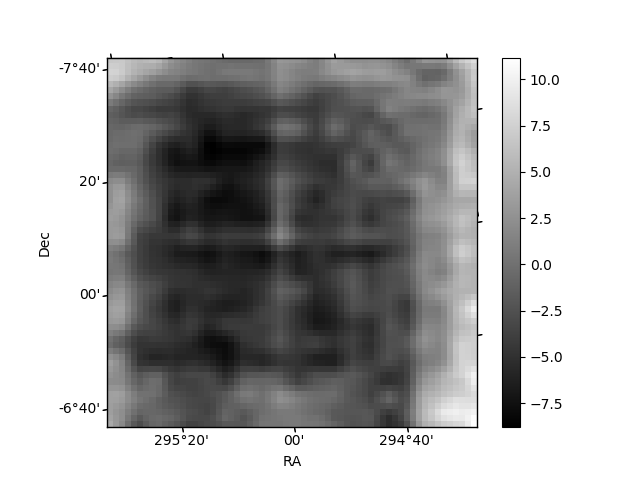
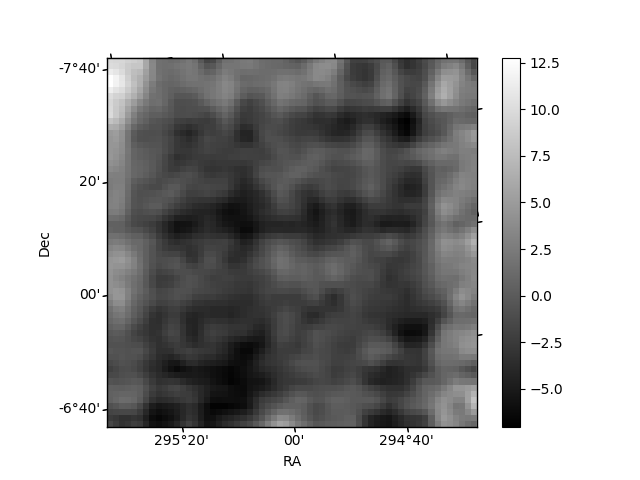
Histogram calculated using DETX and DETY for each event in the final _common_clean file
| Quadrant A | 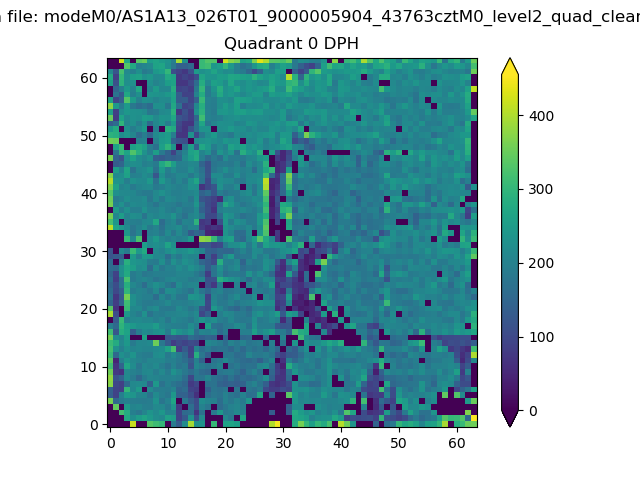 |
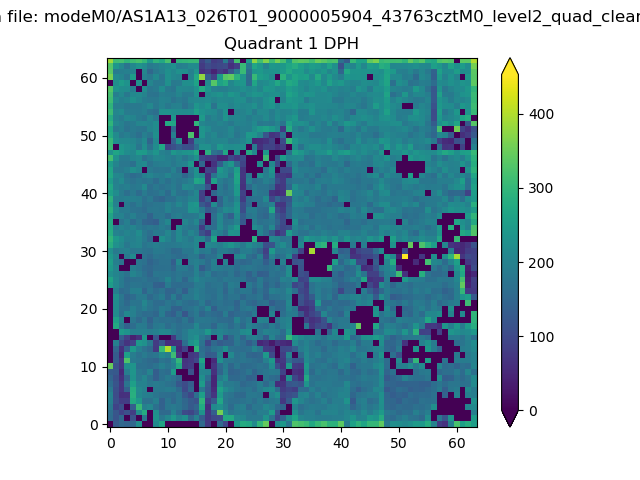 |
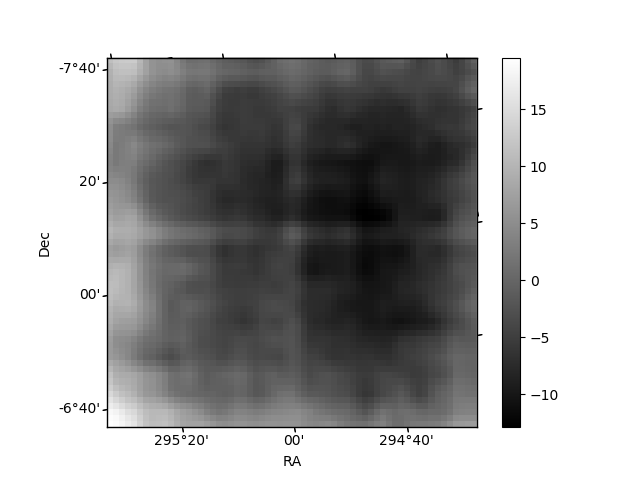
Quadrant B |
|---|---|---|---|
| Quadrant D | 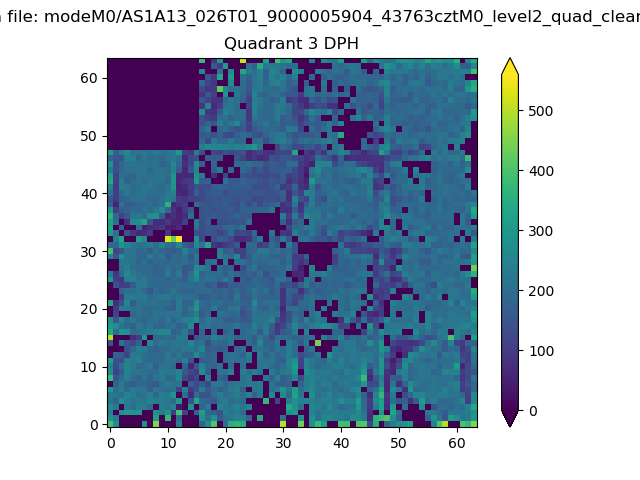 |
 |
Quadrant C |
| Plot type | Count rate plots | Images |
|---|---|---|
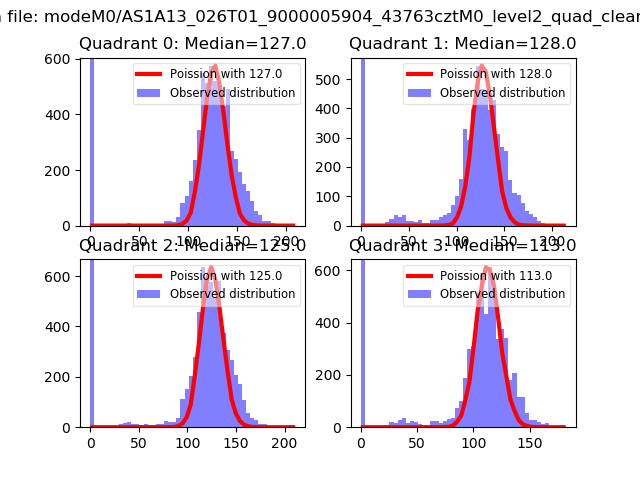
| Comparison with Poisson distribution Blue bars denote a histogram of data divided into 1 sec bins. Red curve is a Poisson curve with rate = median count rate of data. |
 |
 |
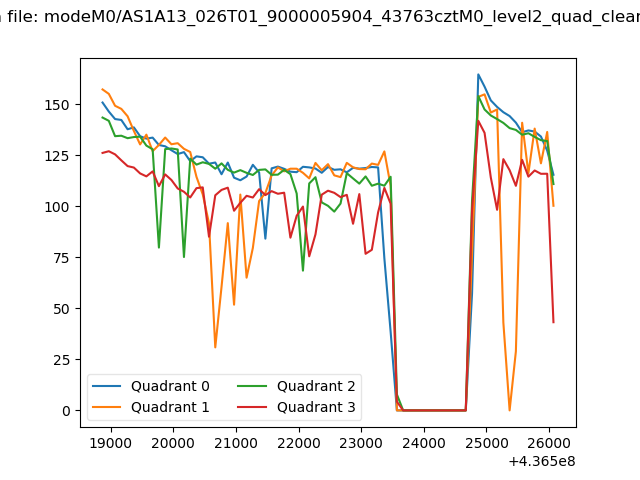
| Quadrant-wise count rates Data is divided into 100 sec bins |
 |
|
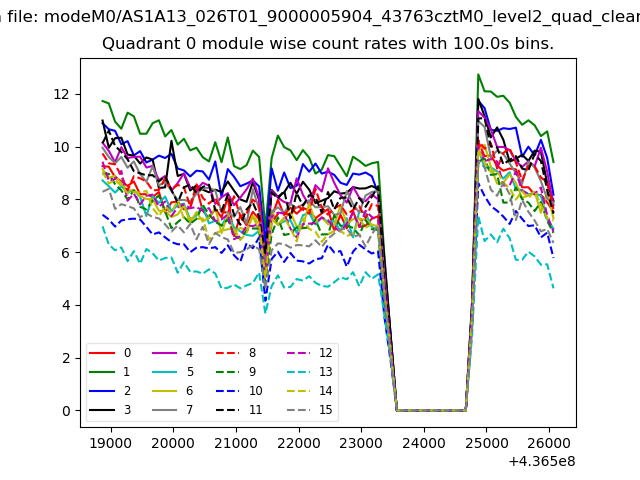
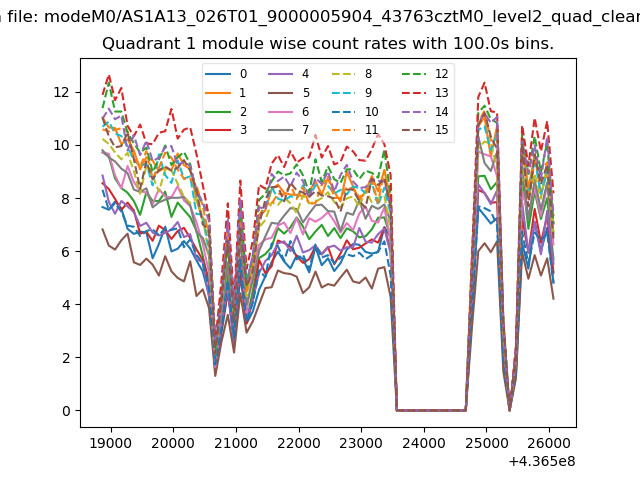
| Module-wise count rates for Quadrant A Data is divided into 100 sec bins |
 |
 |
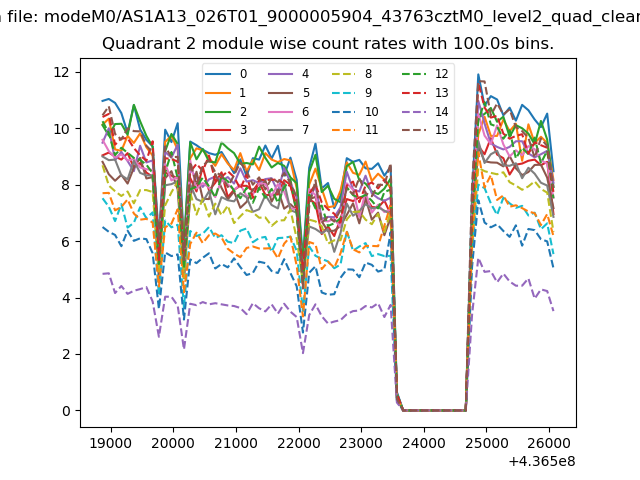
| Module-wise count rates for Quadrant B Data is divided into 100 sec bins |
 |
 |
| Module-wise count rates for Quadrant C Data is divided into 100 sec bins |
 |
 |
| Module-wise count rates for Quadrant D Data is divided into 100 sec bins |
 |
 |
| Parameter | Plot |
|---|---|
| CZT HV Monitor |  |
| D_VDD | 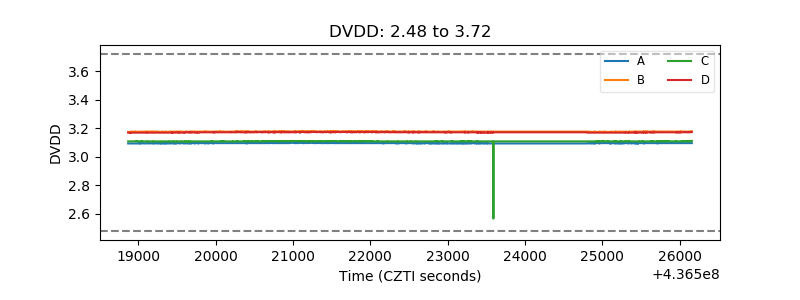 |
| Temperature 1 | 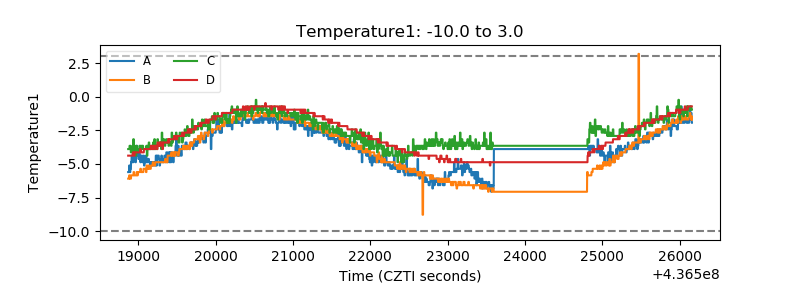 |
| Veto HV Monitor | 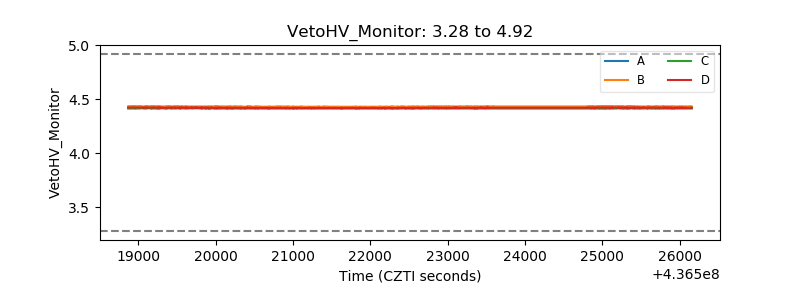 |
| Veto LLD | 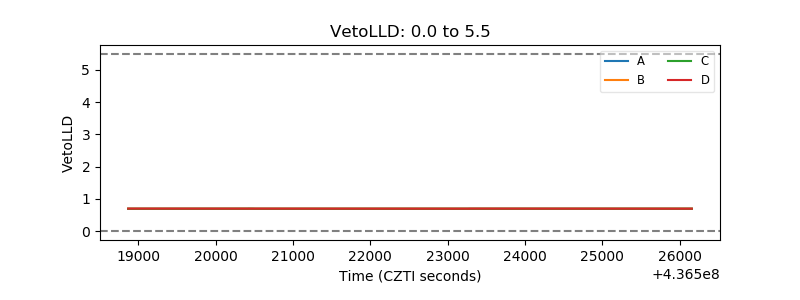 |
| Alpha Counter | 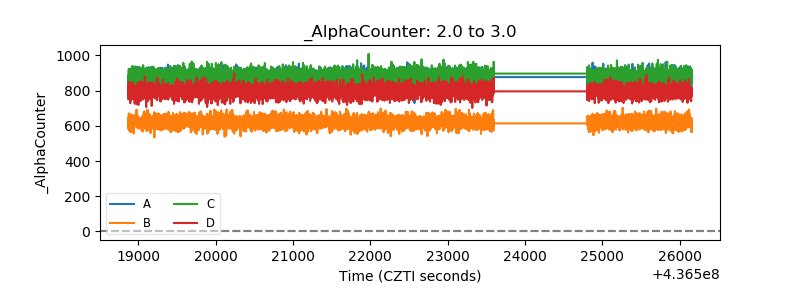 |
| _CPM_Rate | 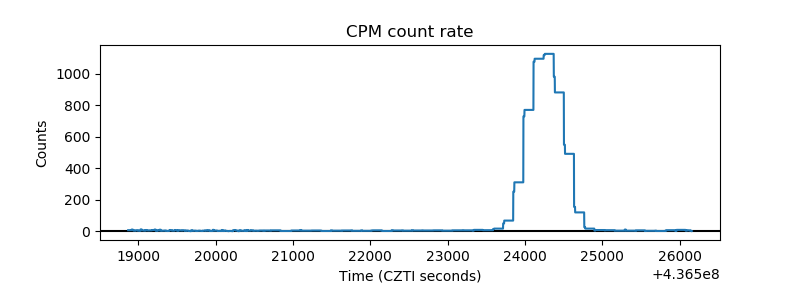 |
| CZT Counter | 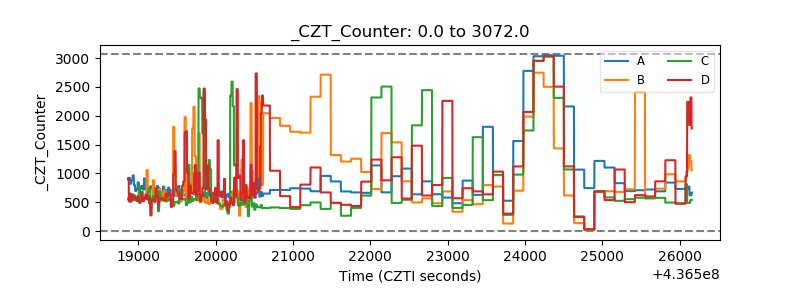 |
| +2.5 Volts monitor | 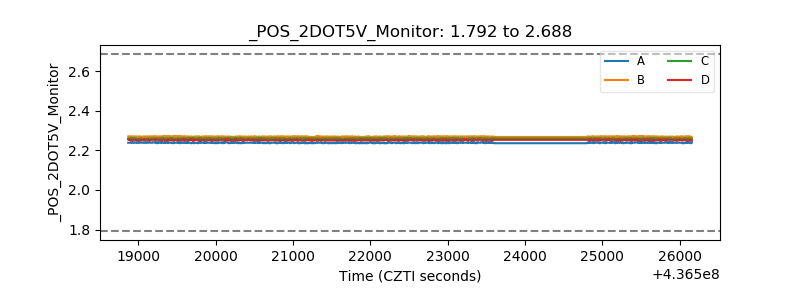 |
| +5 Volts monitor | 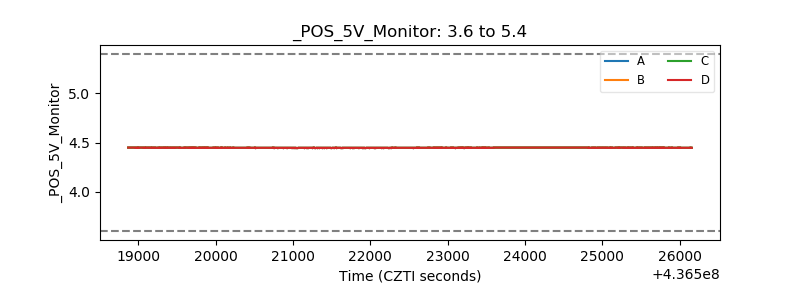 |
| _ROLL_ROT |  |
| _Roll_DEC | 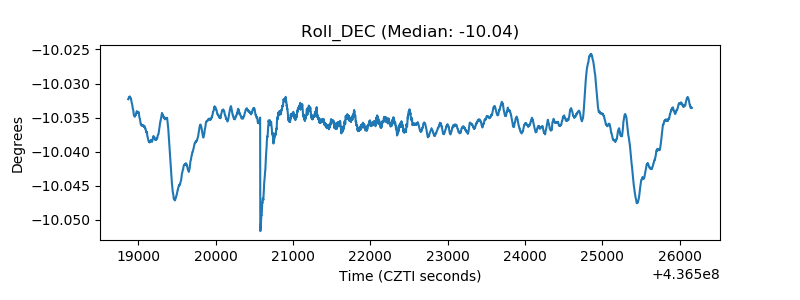 |
| _Roll_RA | 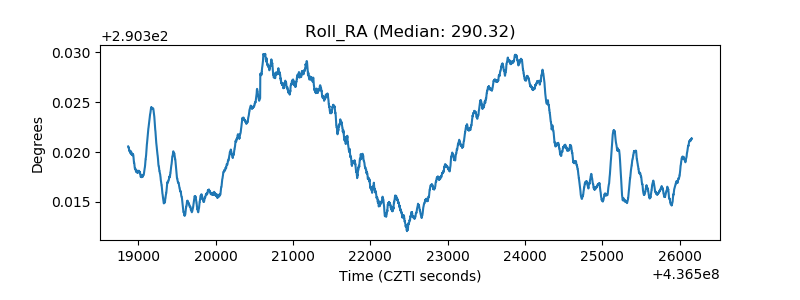 |
| Veto Counter | 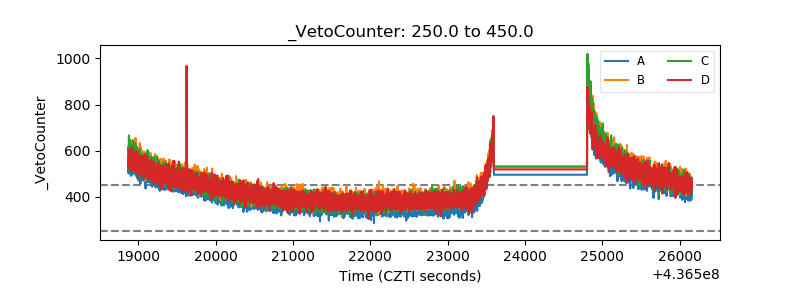 |