| Param | Original file | Final file |
|---|---|---|
| Filename | modeM0/AS1A13_026T01_9000005904_43764cztM0_level2.fits | modeM0/AS1A13_026T01_9000005904_43764cztM0_level2_quad_clean.evt |
| Size (bytes) | 570,821,760 | 114,307,200 |
| Size | 544.4 MB | 109.0 MB |
| Events in quadrant A | 5,087,525 | 804,248 |
| Events in quadrant B | 4,917,792 | 769,974 |
| Events in quadrant C | 4,225,530 | 785,284 |
| Events in quadrant D | 6,403,585 | 655,704 |
| Mode M0 | |||
|---|---|---|---|
| Quadrant | BADHDUFLAG | Total packets | Discarded packets |
| A | 0 | 20029 | 2 |
| B | 0 | 18923 | 2 |
| C | 0 | 16528 | 2 |
| D | 0 | 23436 | 2 |
| Mode SS | |||
|---|---|---|---|
| Quadrant | BADHDUFLAG | Total packets | Discarded packets |
| A | 0 | 130 | 0 |
| B | 0 | 130 | 0 |
| C | 0 | 130 | 0 |
| D | 0 | 130 | 0 |
| Mode M9 | |||
|---|---|---|---|
| Quadrant | BADHDUFLAG | Total packets | Discarded packets |
| A | 0 | 12 | 0 |
| B | 0 | 12 | 0 |
| C | 0 | 12 | 0 |
| D | 0 | 12 | 0 |
| Quadrant | Total seconds | Saturated seconds | Saturation percentage |
|---|---|---|---|
| A | 6392 | 240 | 3.754693% |
| B | 6392 | 673 | 10.528786% |
| C | 6393 | 270 | 4.223369% |
| D | 6393 | 881 | 13.780698% |
Noise dominated data is calculated using 1-second bins in cleaned event files. If a bin has >2000 counts, and if more than 50% of those come from <1% of pixels, then it is considered to be noise-dominated and hence unusable.
| Quadrant | # 1 sec bins | Bins with >0 counts | Bins with >2000 counts | High rate bins dominated by noise | Noise dominated (total time) | Noise dominated (detector-on time) | Marked lightcurve |
|---|---|---|---|---|---|---|---|
| A | 7597 | 6393 | 57 | 57 | 0.75% | 0.89% | 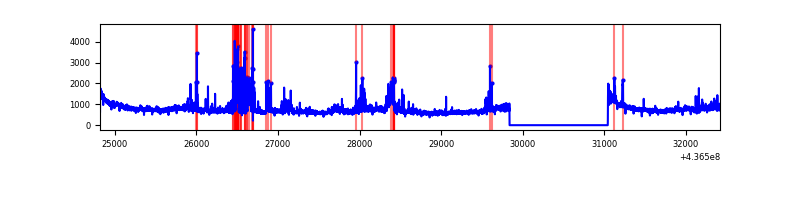 |
| B | 7597 | 6392 | 399 | 399 | 5.25% | 6.24% | 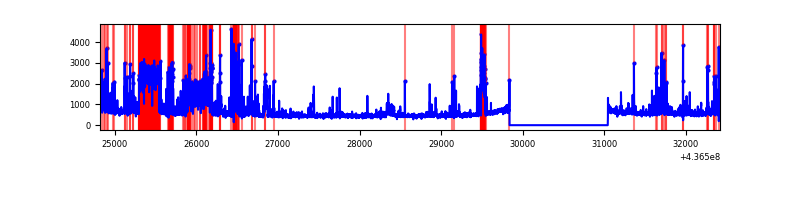 |
| C | 7598 | 6394 | 189 | 189 | 2.49% | 2.96% | 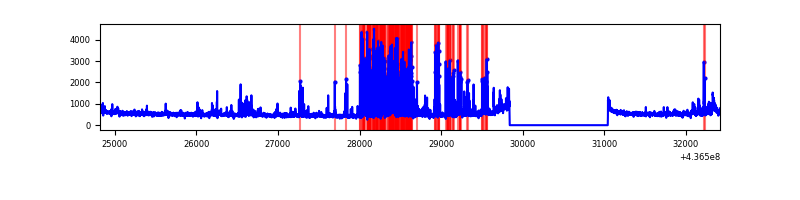 |
| D | 7598 | 6394 | 543 | 543 | 7.15% | 8.49% | 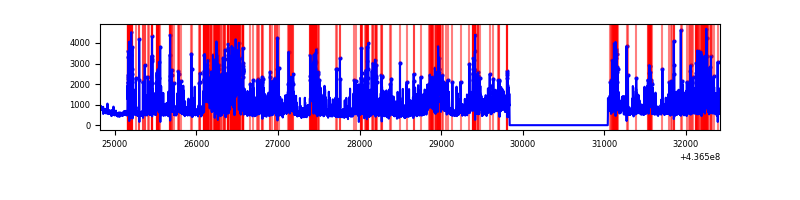 |
Top three noisy pixels from each quadrant. If the there are fewer than three noisy pixels in the level2.evt file, extra rows are filled as -1
| Pixel properties | Quadrant properties | ||||||
|---|---|---|---|---|---|---|---|
| Quadrant | DetID | PixID | Counts | Sigma | Mean | Median | Sigma |
| A | 10 | 83 | 1043688 | 6221.26 | 808 | 793 | 167.6 |
| A | 14 | 63 | 256435 | 1525.0 | 808 | 793 | 167.6 |
| A | 13 | 248 | 199815 | 1187.24 | 808 | 793 | 167.6 |
| B | 5 | 235 | 919190 | 6052.07 | 775 | 753 | 151.8 |
| B | 5 | 255 | 303360 | 1994.04 | 775 | 753 | 151.8 |
| B | 0 | 213 | 199317 | 1308.44 | 775 | 753 | 151.8 |
| C | 15 | 158 | 790146 | 4397.68 | 775 | 780 | 179.5 |
| C | 3 | 233 | 232342 | 1290.07 | 775 | 780 | 179.5 |
| C | 14 | 254 | 80600 | 444.69 | 775 | 780 | 179.5 |
| D | 5 | 235 | 902798 | 4784.83 | 751 | 729 | 188.5 |
| D | 12 | 233 | 369722 | 1957.24 | 751 | 729 | 188.5 |
| D | 4 | 212 | 367363 | 1944.73 | 751 | 729 | 188.5 |
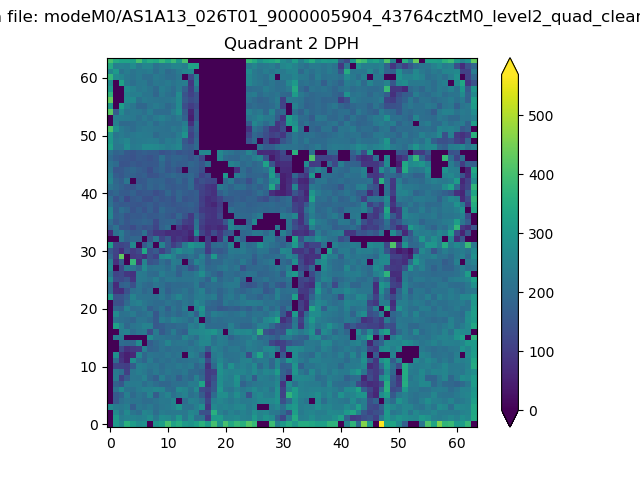
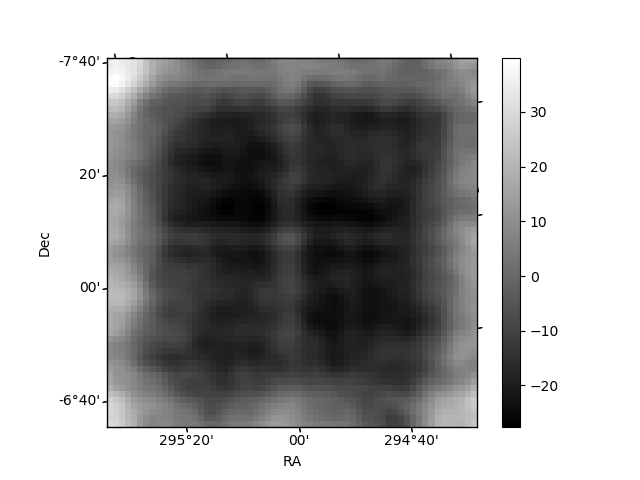
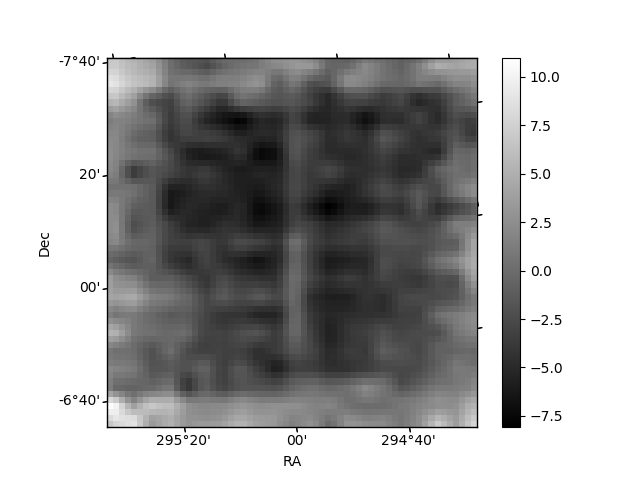
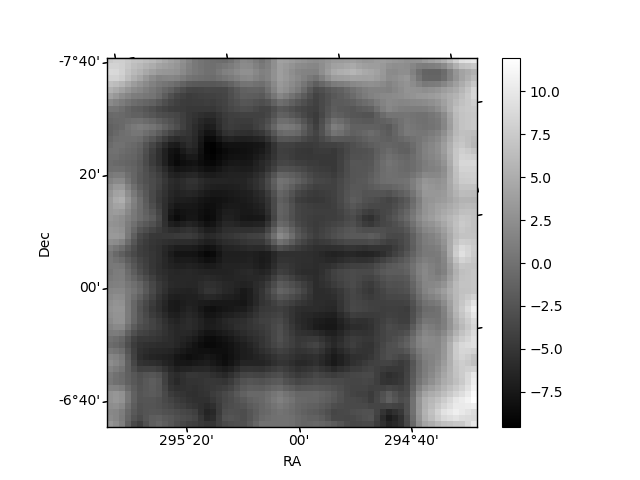
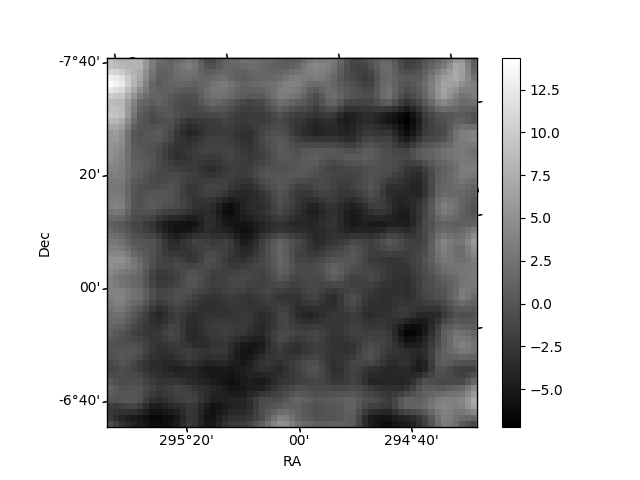
Histogram calculated using DETX and DETY for each event in the final _common_clean file
| Quadrant A | 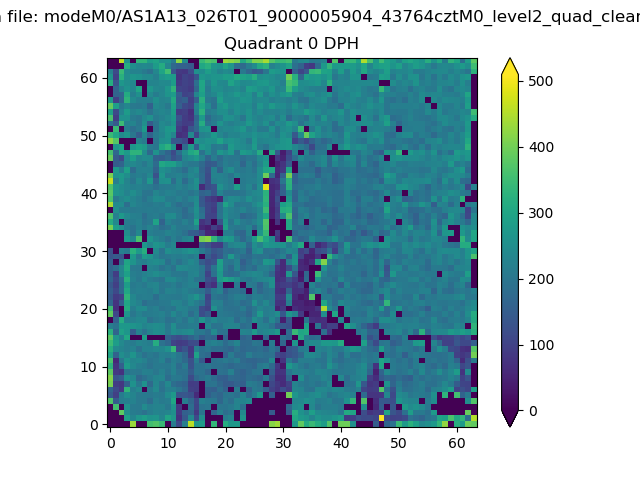 |
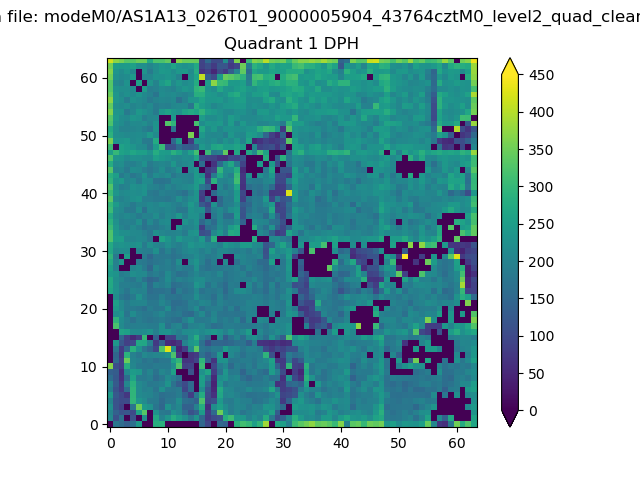 |
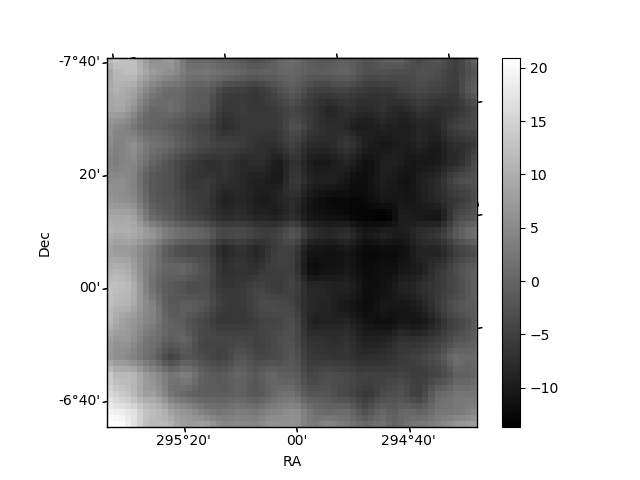
Quadrant B |
|---|---|---|---|
| Quadrant D | 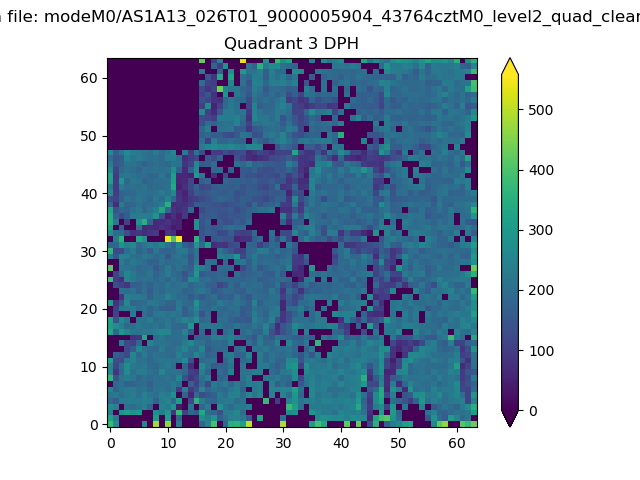 |
 |
Quadrant C |
| Plot type | Count rate plots | Images |
|---|---|---|
| Comparison with Poisson distribution Blue bars denote a histogram of data divided into 1 sec bins. Red curve is a Poisson curve with rate = median count rate of data. |
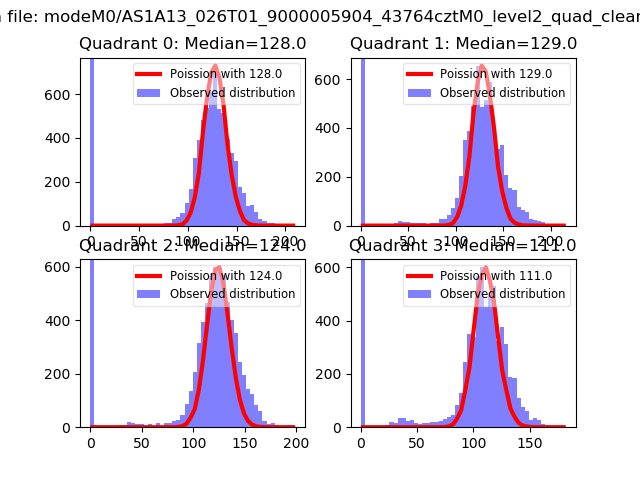 |
 |
| Quadrant-wise count rates Data is divided into 100 sec bins |
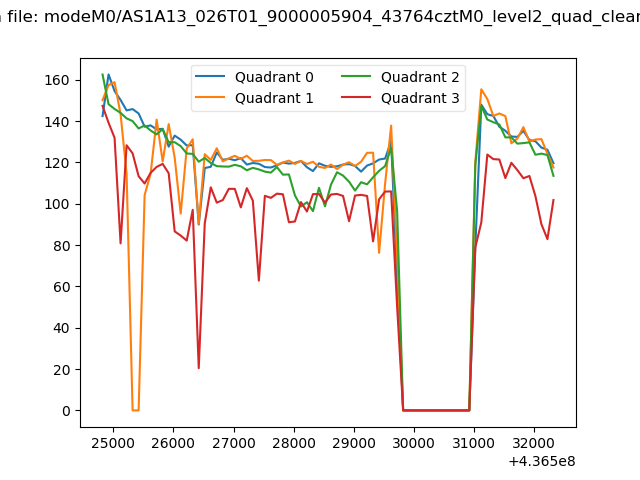 |
|
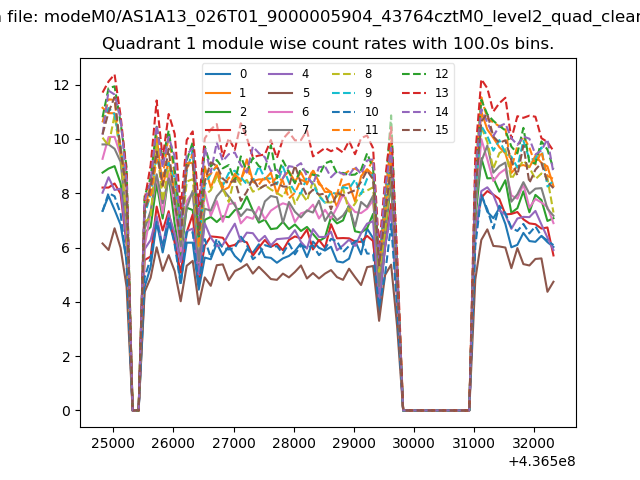
| Module-wise count rates for Quadrant A Data is divided into 100 sec bins |
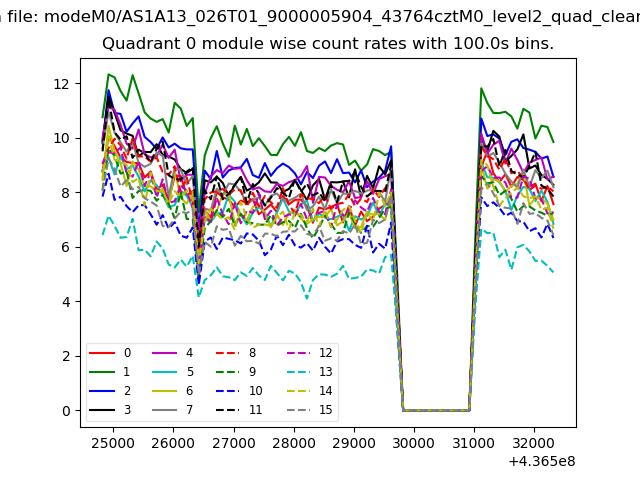 |
 |
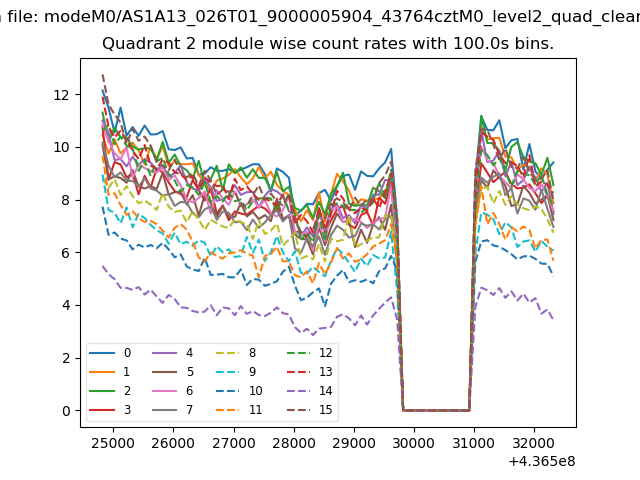
| Module-wise count rates for Quadrant B Data is divided into 100 sec bins |
 |
 |
| Module-wise count rates for Quadrant C Data is divided into 100 sec bins |
 |
 |
| Module-wise count rates for Quadrant D Data is divided into 100 sec bins |
 |
 |
| Parameter | Plot |
|---|---|
| CZT HV Monitor | 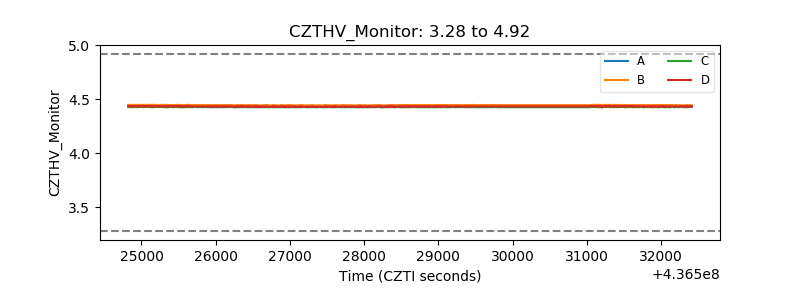 |
| D_VDD | 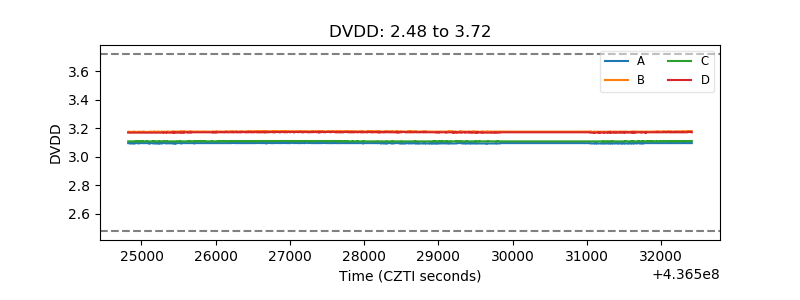 |
| Temperature 1 | 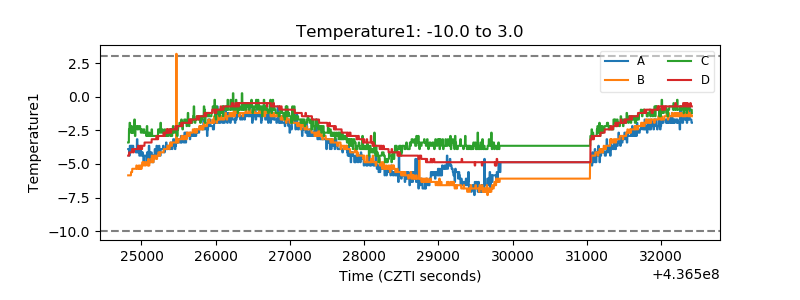 |
| Veto HV Monitor |  |
| Veto LLD | 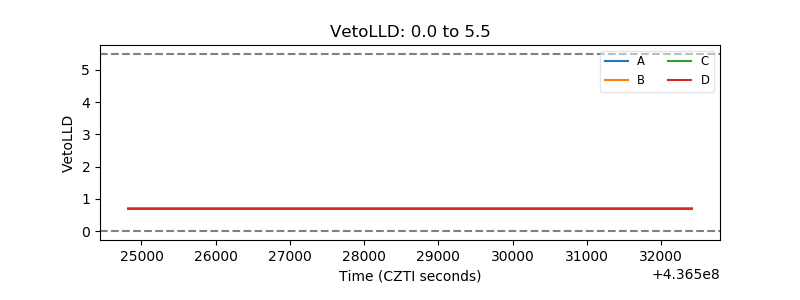 |
| Alpha Counter | 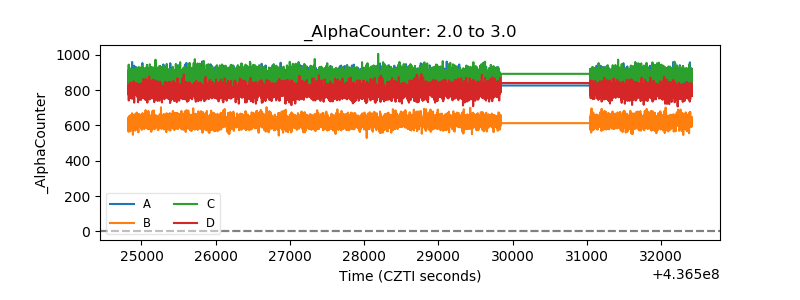 |
| _CPM_Rate | 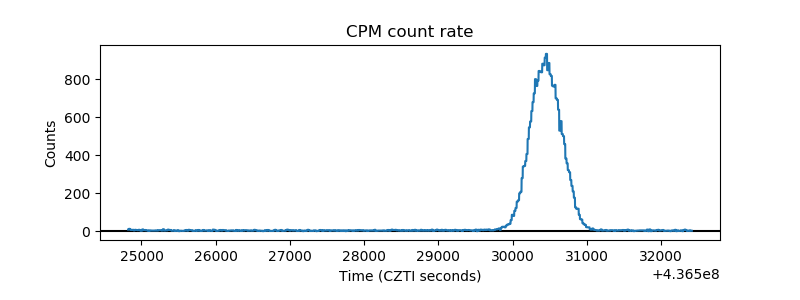 |
| CZT Counter | 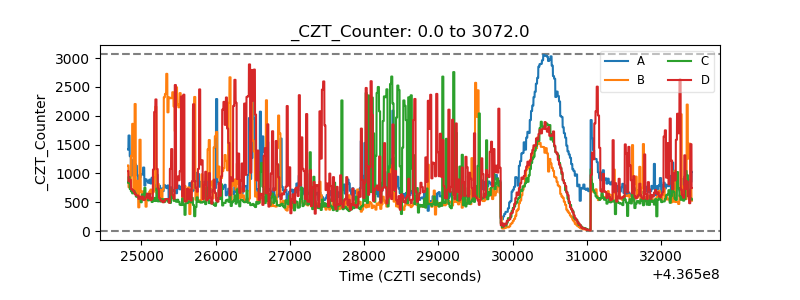 |
| +2.5 Volts monitor | 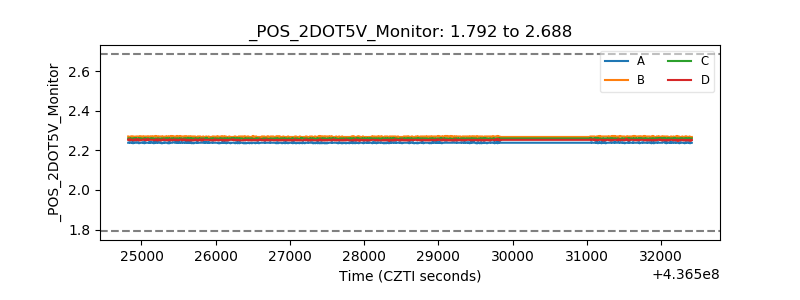 |
| +5 Volts monitor | 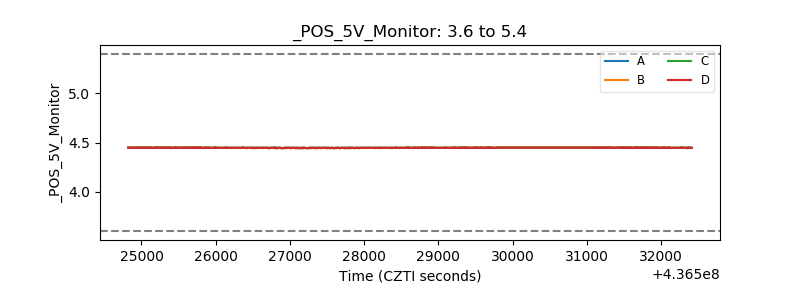 |
| _ROLL_ROT |  |
| _Roll_DEC | 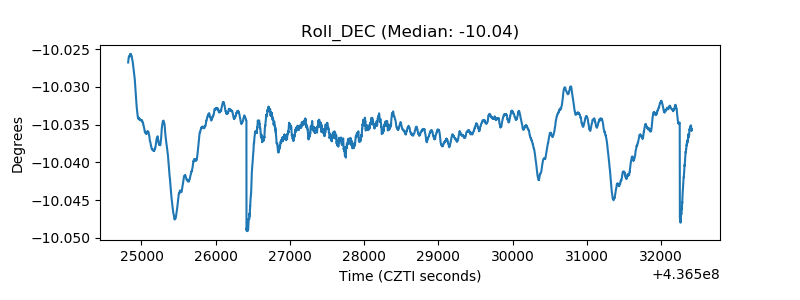 |
| _Roll_RA | 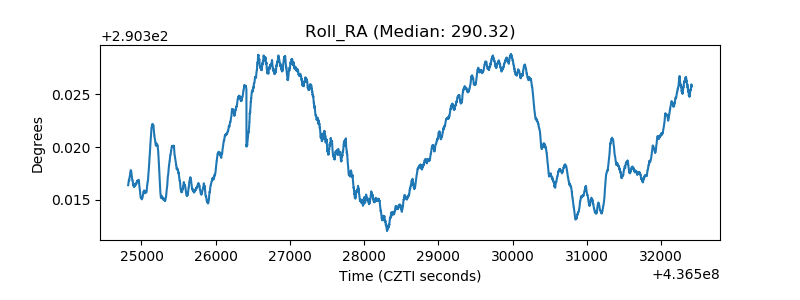 |
| Veto Counter | 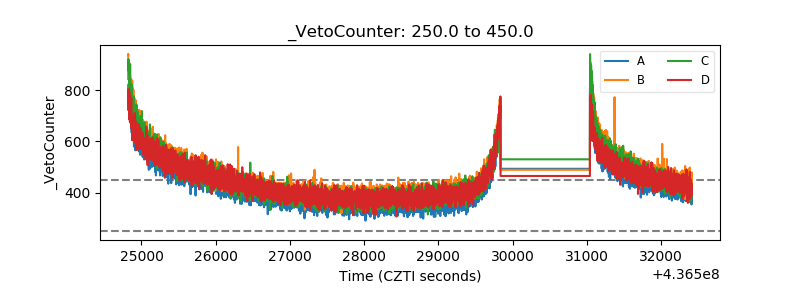 |