| Param | Original file | Final file |
|---|---|---|
| Filename | modeM0/AS1A13_026T01_9000005904_43765cztM0_level2.fits | modeM0/AS1A13_026T01_9000005904_43765cztM0_level2_quad_clean.evt |
| Size (bytes) | 619,865,280 | 117,414,720 |
| Size | 591.1 MB | 112.0 MB |
| Events in quadrant A | 6,163,838 | 794,945 |
| Events in quadrant B | 5,729,174 | 779,078 |
| Events in quadrant C | 4,552,230 | 807,397 |
| Events in quadrant D | 5,969,719 | 696,707 |
| Mode M0 | |||
|---|---|---|---|
| Quadrant | BADHDUFLAG | Total packets | Discarded packets |
| A | 0 | 23464 | 2 |
| B | 0 | 21609 | 2 |
| C | 0 | 18005 | 2 |
| D | 0 | 22466 | 2 |
| Mode SS | |||
|---|---|---|---|
| Quadrant | BADHDUFLAG | Total packets | Discarded packets |
| A | 0 | 138 | 0 |
| B | 0 | 138 | 0 |
| C | 0 | 138 | 0 |
| D | 0 | 138 | 0 |
| Mode M9 | |||
|---|---|---|---|
| Quadrant | BADHDUFLAG | Total packets | Discarded packets |
| A | 0 | 12 | 0 |
| B | 0 | 12 | 0 |
| C | 0 | 12 | 0 |
| D | 0 | 12 | 0 |
| Quadrant | Total seconds | Saturated seconds | Saturation percentage |
|---|---|---|---|
| A | 6851 | 475 | 6.933294% |
| B | 6851 | 826 | 12.056634% |
| C | 6851 | 188 | 2.744125% |
| D | 6851 | 655 | 9.560648% |
Noise dominated data is calculated using 1-second bins in cleaned event files. If a bin has >2000 counts, and if more than 50% of those come from <1% of pixels, then it is considered to be noise-dominated and hence unusable.
| Quadrant | # 1 sec bins | Bins with >0 counts | Bins with >2000 counts | High rate bins dominated by noise | Noise dominated (total time) | Noise dominated (detector-on time) | Marked lightcurve |
|---|---|---|---|---|---|---|---|
| A | 7956 | 6852 | 210 | 210 | 2.64% | 3.06% | 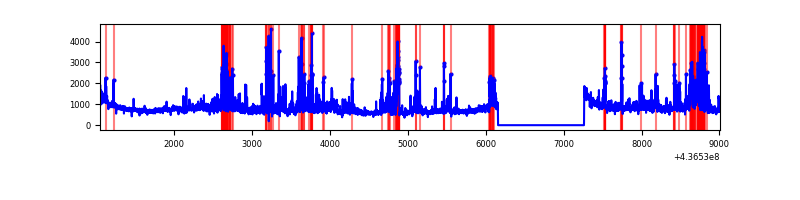 |
| B | 7956 | 6852 | 509 | 509 | 6.40% | 7.43% | 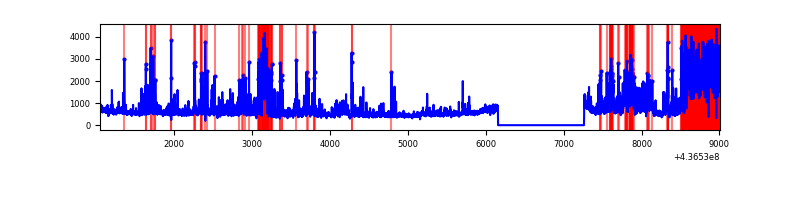 |
| C | 7956 | 6852 | 127 | 127 | 1.60% | 1.85% | 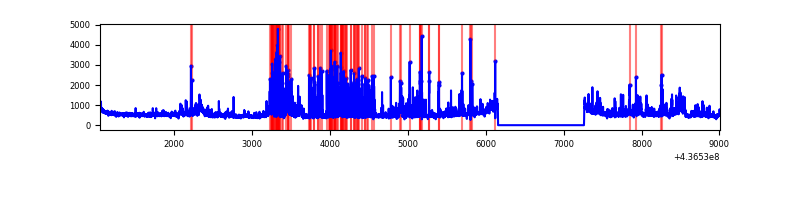 |
| D | 7956 | 6852 | 359 | 359 | 4.51% | 5.24% | 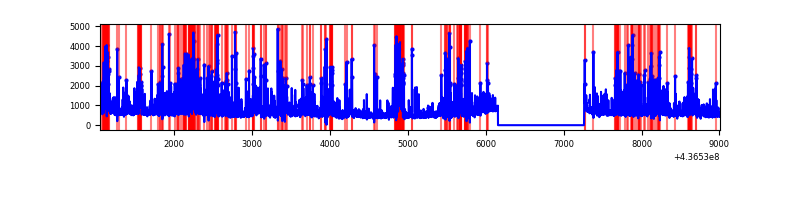 |
Top three noisy pixels from each quadrant. If the there are fewer than three noisy pixels in the level2.evt file, extra rows are filled as -1
| Pixel properties | Quadrant properties | ||||||
|---|---|---|---|---|---|---|---|
| Quadrant | DetID | PixID | Counts | Sigma | Mean | Median | Sigma |
| A | 10 | 83 | 1079924 | 6347.62 | 823 | 807 | 170.0 |
| A | 14 | 63 | 721349 | 4238.4 | 823 | 807 | 170.0 |
| A | 13 | 248 | 621205 | 3649.33 | 823 | 807 | 170.0 |
| B | 0 | 200 | 1622808 | 10239.26 | 799 | 776 | 158.4 |
| B | 5 | 172 | 202575 | 1273.88 | 799 | 776 | 158.4 |
| B | 0 | 213 | 187673 | 1179.81 | 799 | 776 | 158.4 |
| C | 3 | 233 | 783778 | 4172.07 | 804 | 807 | 187.7 |
| C | 15 | 158 | 386650 | 2055.97 | 804 | 807 | 187.7 |
| C | 15 | 157 | 97273 | 514.02 | 804 | 807 | 187.7 |
| D | 5 | 235 | 732492 | 3638.35 | 790 | 767 | 201.1 |
| D | 1 | 52 | 591928 | 2939.42 | 790 | 767 | 201.1 |
| D | 13 | 249 | 320318 | 1588.9 | 790 | 767 | 201.1 |
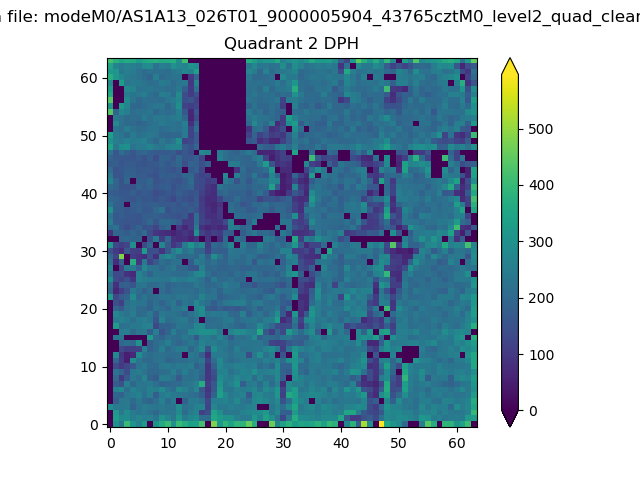
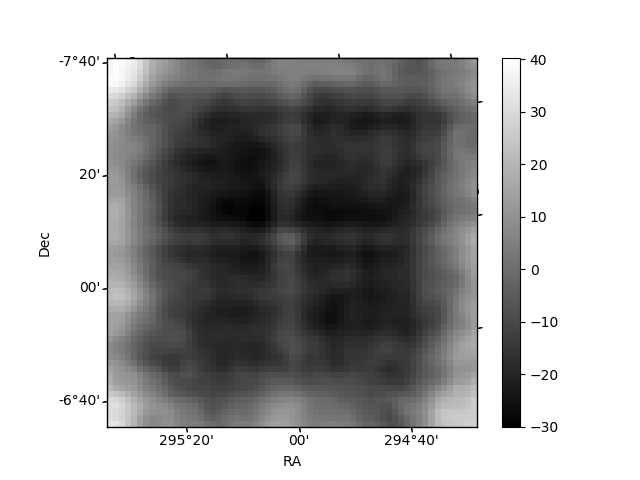
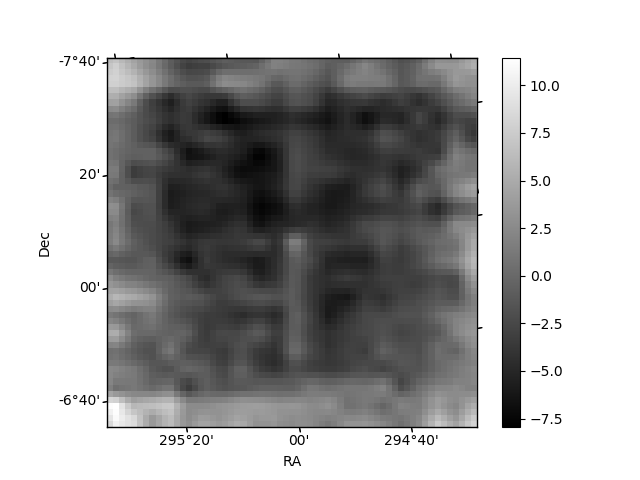
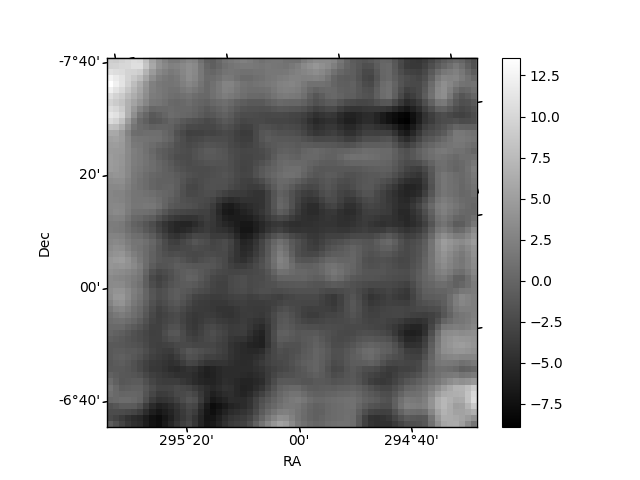
Histogram calculated using DETX and DETY for each event in the final _common_clean file
| Quadrant A | 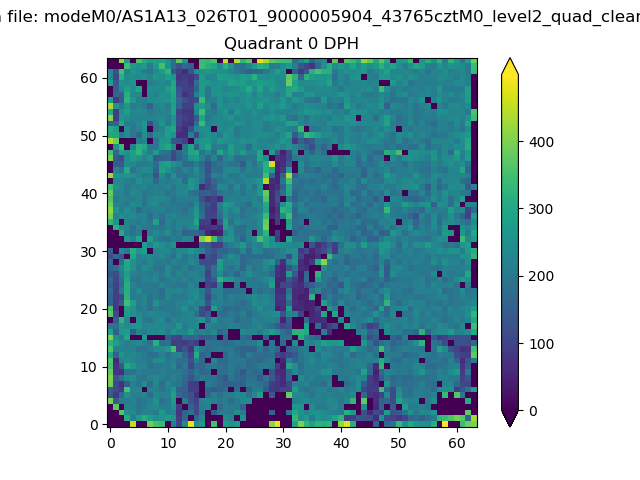 |
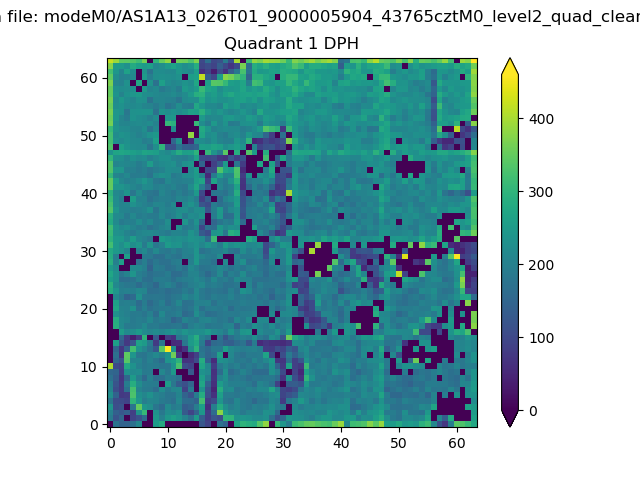 |
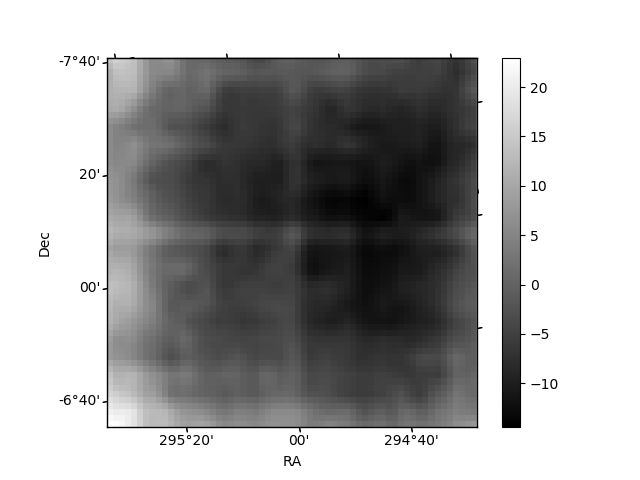
Quadrant B |
|---|---|---|---|
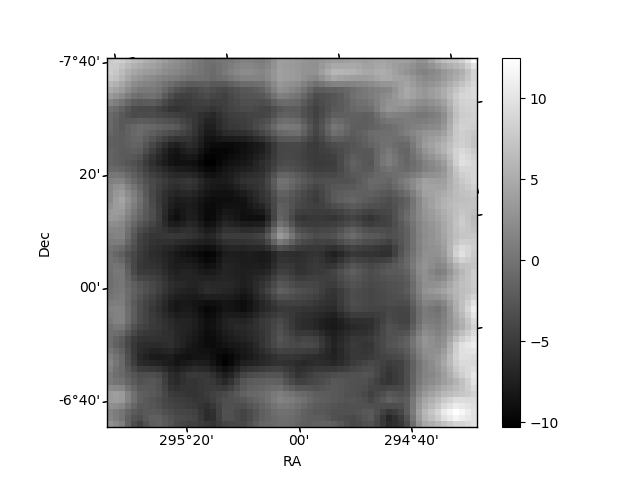
| Quadrant D | 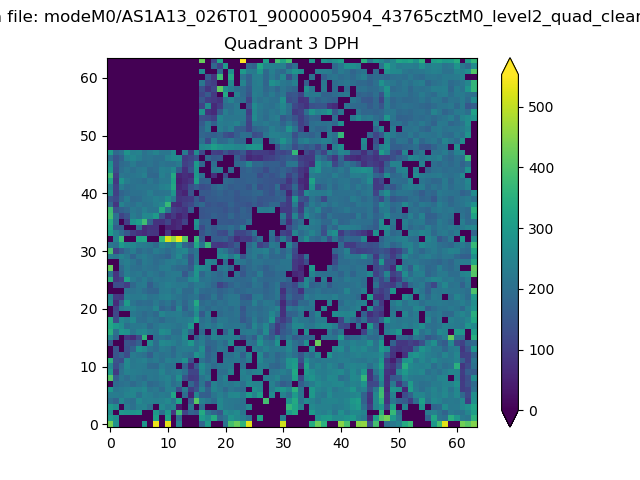 |
 |
Quadrant C |
| Plot type | Count rate plots | Images |
|---|---|---|
| Comparison with Poisson distribution Blue bars denote a histogram of data divided into 1 sec bins. Red curve is a Poisson curve with rate = median count rate of data. |
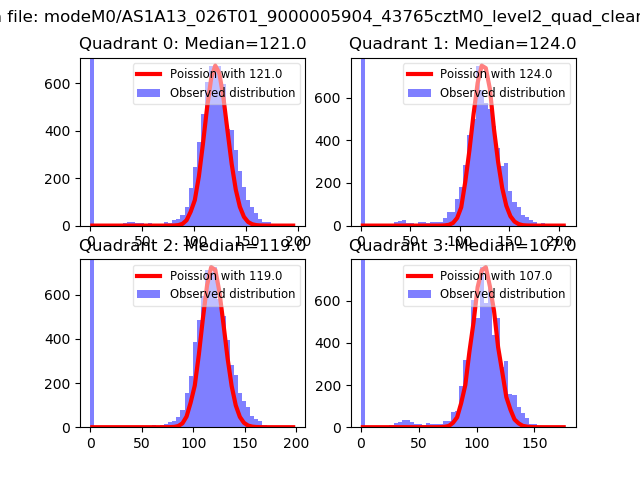 |
 |
| Quadrant-wise count rates Data is divided into 100 sec bins |
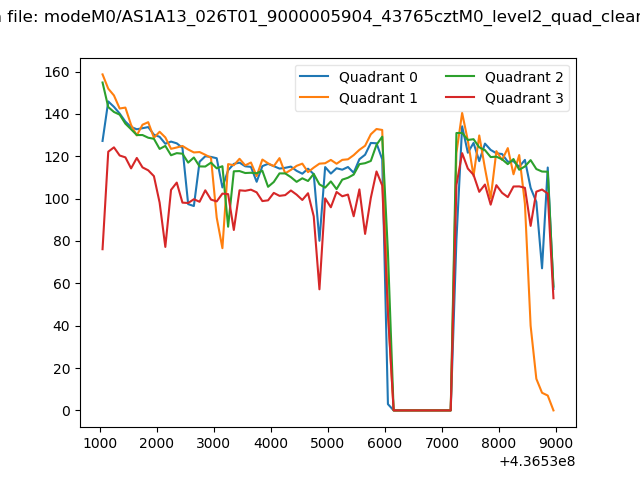 |
|
| Module-wise count rates for Quadrant A Data is divided into 100 sec bins |
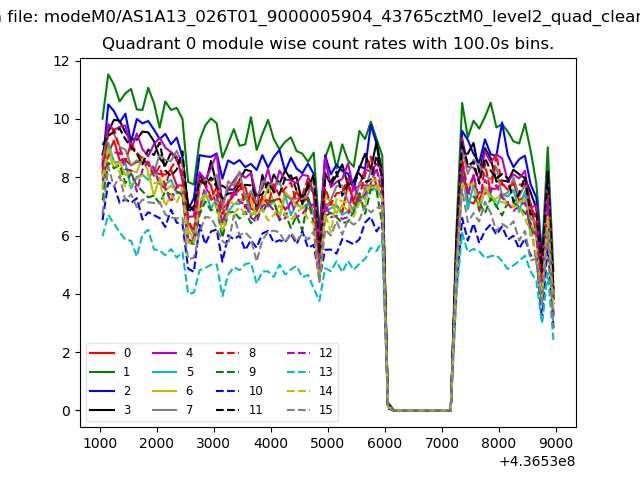 |
 |
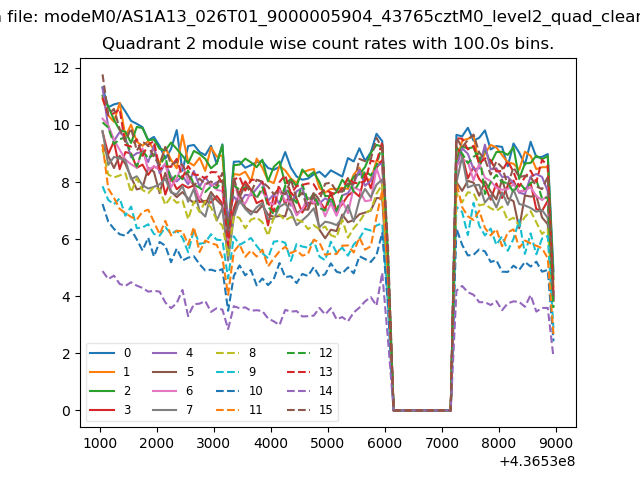
| Module-wise count rates for Quadrant B Data is divided into 100 sec bins |
 |
 |
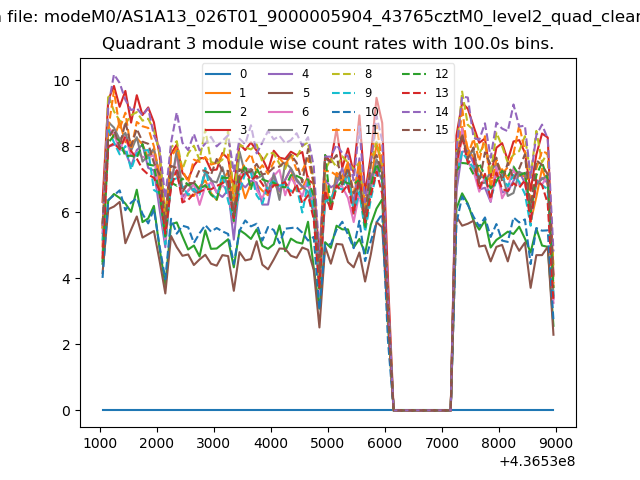
| Module-wise count rates for Quadrant C Data is divided into 100 sec bins |
 |
 |
| Module-wise count rates for Quadrant D Data is divided into 100 sec bins |
 |
 |
| Parameter | Plot |
|---|---|
| CZT HV Monitor |  |
| D_VDD | 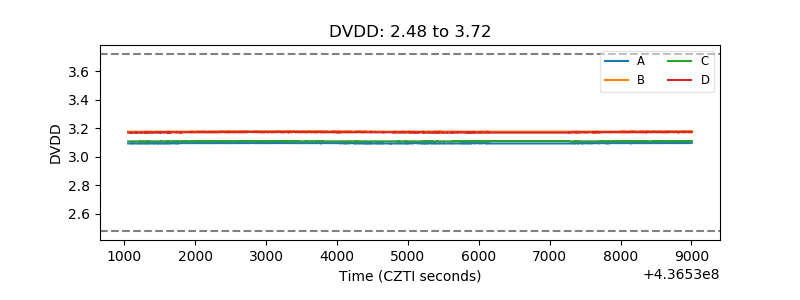 |
| Temperature 1 | 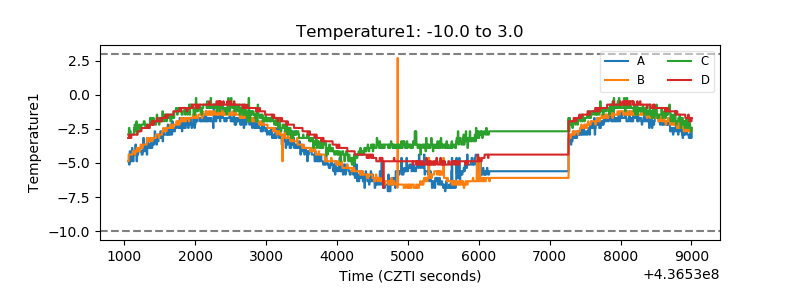 |
| Veto HV Monitor | 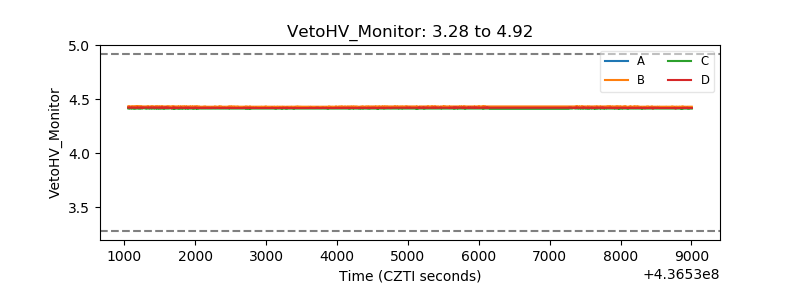 |
| Veto LLD | 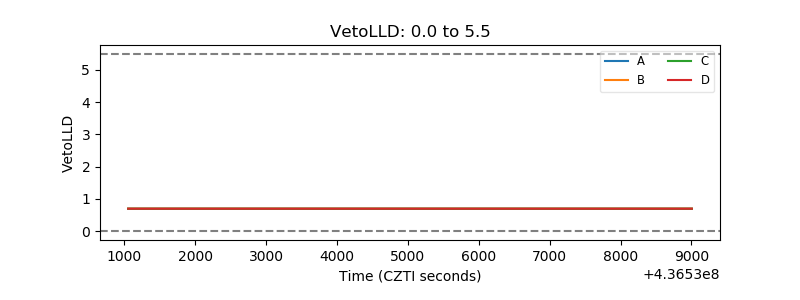 |
| Alpha Counter | 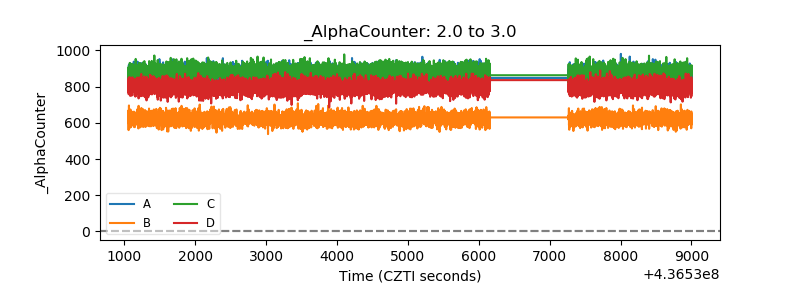 |
| _CPM_Rate | 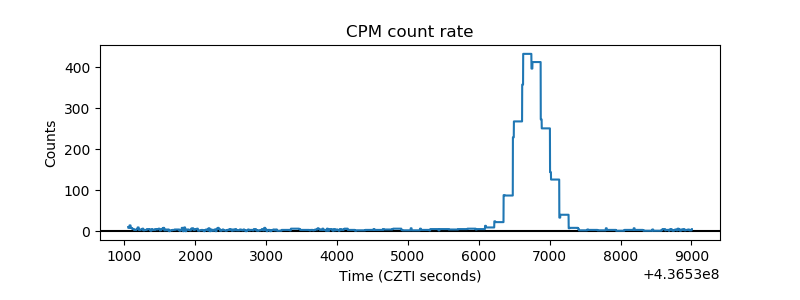 |
| CZT Counter | 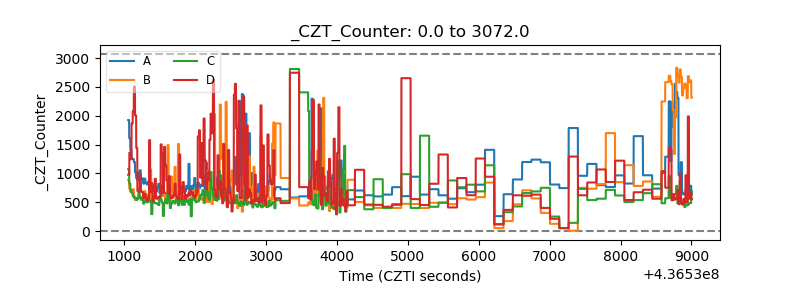 |
| +2.5 Volts monitor | 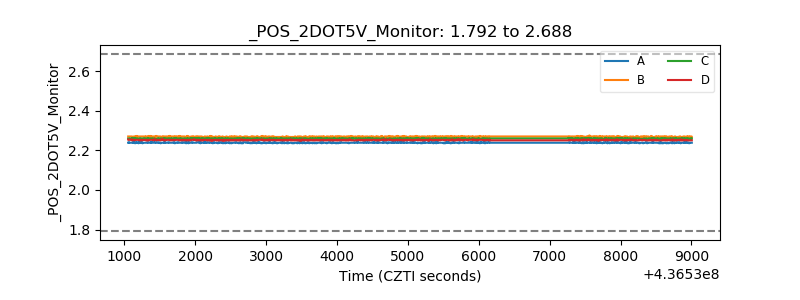 |
| +5 Volts monitor | 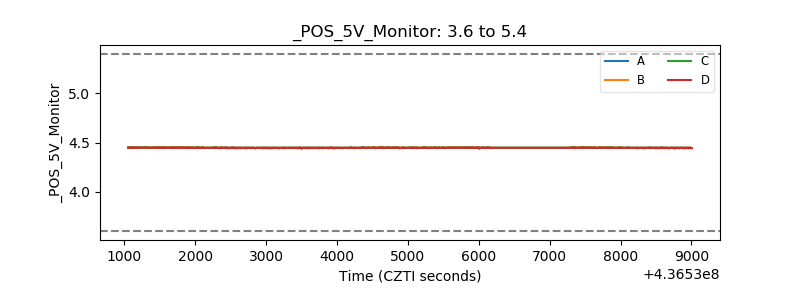 |
| _ROLL_ROT | 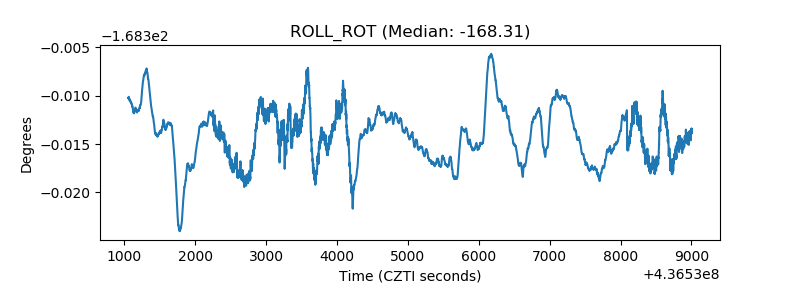 |
| _Roll_DEC | 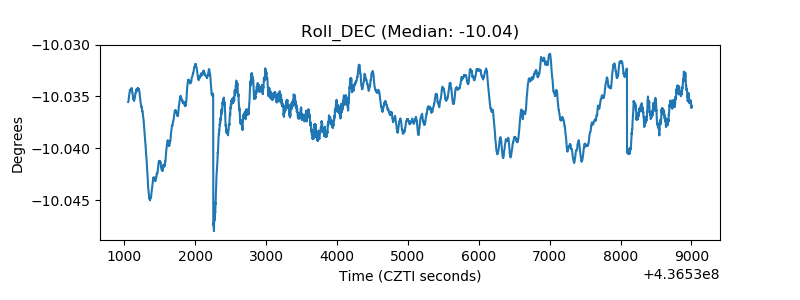 |
| _Roll_RA | 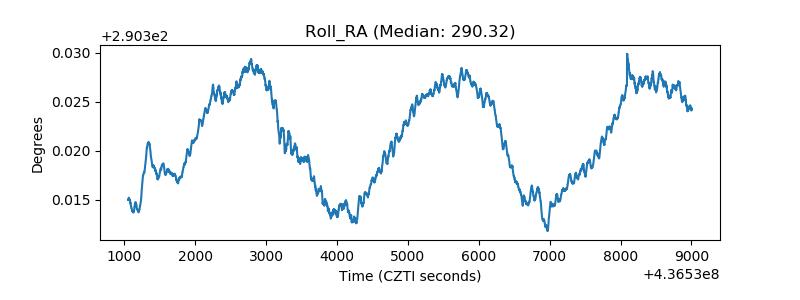 |
| Veto Counter | 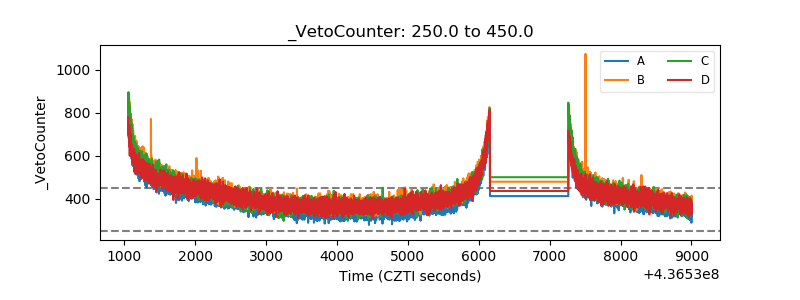 |